

Article Figures & Data
Figures
- Figure 1.
Generation of Pclogt/gt mutant animals. A, Sleeping beauty transposon mutagenesis was used to generate gene trap (gt) piccolo KO rats. The transposon element was inserted into exon 3 of the piccolo genomic sequence and caused a stop in the reading frame. Adapted from Ackermann et al. (2019). B, Pairs of heterozygous (Pclowt/gt) males and females produced litters with Mendelian distribution. Pie chart demonstrates the birth rates of homozygous WT (Pclowt/wt), homozygous gene trap mutation (Pclogt/gt), and heterozygous (Pclowt/gt) pups (data collected from 63 litters: Pclowt/wt = 195 pups; Pclowt/gt = 387 pups; Pclogt/gt = 137 pups). C, Western blot analysis of brain lysates prepared from postnatal day 2 (P2) animals to confirm the loss of full-length Piccolo protein from the brain. A band of the Piccolo-corresponding size of 560 kDa is detectable in lysates prepared from Pclowt/wt and Pclowt/gt animals, as well as bands between 70 and 420 kDa, representing smaller Piccolo isoforms. Nearly all of these are absent in Pclogt/gt brain lysates (data are representative of three independent experiments), although smaller bands between 100 and 70 kDA are still present in Pclogt/gt brain lysates. D, Image of postnatal day 1 (P1) littermates. E, Quantification of the body length of P0–P2 Pclowt/wt and Pclogt/gt pups (Pclowt/wt = 5.5 ± 0.077 cm, n = 23; Pclogt/gt = 5.15 ± 0.070 cm, n = 27; 6 independent litters; unpaired t test, t(48) = 3.394, **p = 0.0014). F, Quantification of the body weight of P0–P2 Pclowt/wt and Pclogt/gt pups (Pclowt/wt = 8.09 ± 0.203 g, n = 39; Pclogt/gt = 7.31 ± 0.166 g, n = 35; 12 independent litters; unpaired t test, t(72) = 2.937, **p = 0.0044). G, Image of brains dissected from P1 Pclowt/wt and Pclogt/gt pups. H, Quantification of the brain weight of P0–P2 Pclowt/wt and Pclogt/gt pups (Pclowt/wt = 0.293 ± 0.00533 g, n = 7; Pclogt/gt = 0.289 ± 0.00758 g, n = 3; 3 independent litters; unpaired t test, t(8) = 0.423, p = 0.683). I, Nissl-stained sagittal sections from P2 rat brains show no overt differences between Pclogt/gt and Pclowt/wt pups. Animals used in this experiment are as follows: wt1; ko1. J, Image of 4% PFA-perfused brains from Pclowt/wt and Pclogt/gt animals at 3 months of age. K, Quantification of the brain weight showing that Pclogt/gt brains are significantly lighter than Pclowt/wt brains (Pclowt/wt = 2.098 ± 0.074 g, Pclogt/gt = 1.435 ± 0.021 g; n = 6, Mann–Whitney U test, U = 0, **p = 0.0022). L, Nissl-stained sagittal sections from 3-month-old rat brains reveal microcephaly in Pclogt/gt compared with Pclowt/wt. Ventricles are larger, and cerebellum, pons, cerebrum, and subcortical regions are smaller. Animals used in this experiment are as follows: wt11; ko13. Scale bars: G, J, 1 cm; I, 1 mm; L, 0.5 cm. Error bars indicate SEM.
- Figure 2.
Pclogt/gt rats show cortical thinning and a smaller pons area compared with Pclowt/wt littermates. A, C, D, Nissl-stained somatosensory cortex (dashed lines) (A) and the brainstem, including pontine area (C,D) of Pclowt/wt and Pclogt/gt brains at 3 months of age. C, Zoom demonstrates that pontine neurons are of similar density in Pclowt/wt and Pclogt/gt. C, Pontine area visualized by staining with antibodies against VGluT1 and subsequent DAB conversion of Pclowt/wt and Pclogt/gt brains at 3 months of age. B, Quantification of the thickness of the somatosensory cortex (Pclowt/wt = 2.18 ± 0.045 mm, n = 25 brain sections; Pclogt/gt = 1.98 ± 0.041 mm, n = 21 brain sections; n = 3 independent experiments; unpaired t test, t(44) = 3.323, **p = 0.0018). E, Quantification of the area of the pons (Pclowt/wt = 12.24 ± 0.620 mm2, n = 26 brain sections; Pclogt/gt = 5.58 ± 0.333 mm2, n = 17 brain sections; n = 3 independent experiments; unpaired t test, t(41) = 8.164, ****p < 0.0001). Scale bars: A, C, 200 μm; B, C, 500 μm; B (zoom), 100 μm. Error bars indicate SEM. Animals used in this experiment are as follows: wt3, wt7-wt10; ko3, ko6, ko8, ko10.
- Figure 3.
Morphometric comparison of Pclogt/gt and Pclowt/wt cerebella. A–D, Images of sagittal sections of Pclowt/wt and Pclogt/gt cerebella at 3 months of age. The densely packed GCL is visualized by DAPI staining. B, Higher-magnification images of A, demonstrating GC density in the GCL. C, Quantification of the GCL thickness (Pclowt/wt = 200.8 ± 2.932 μm, n = 160 lobes; Pclogt/gt = 134.8 ± 2.859 μm, n = 148 lobes; n = 4 independent experiments; Mann–Whitney U test, U = 1953, ****p <0.0001). Animals used in this experiment are as follows: wt4, wt6-wt8; ko4-ko7. D, Quantification of the number of GCs per 100 μm2 (Pclowt/wt = 0.747 ± 0.326, n = 56 images from 3 rats; Pclogt/gt = 0.817 ± 0.343, n = 57 images from 4 rats; unpaired t test, t(111) = 1.462, p = 0.147). Animals used in this experiment are as follows: wt7, wt10, wt11; ko6, ko7, ko9, ko10. E–H, Images of sagittal sections of Pclowt/wt and Pclogt/gt cerebella at 3 months of age. PCs stained with antibodies against calbindin determine the ML (lobes I-III shown). F, Higher-magnification images of E. Note the closer packing of PCs in Pclogt/gt compared with Pclowt/wt. G, Quantification of the ML thickness (Pclowt/wt = 187.2 ± 2.719 μm, n = 148 lobes; Pclogt/gt = 127.2 ± 2.378 μm, n = 125 lobes; n = 4 independent experiments; Mann–Whitney U test, U = 1368, ****p < 0.0001). Animals used in this experiment are as follows: wt7, wt10, wt11; ko6, ko7, ko9, ko10. H, Quantification of the number of PCs per 100 μm length of PC layer (Pclowt/wt = 1.797 ± 0.036; n = 89 lobes; Pclogt/gt = 2.554 ± 0.058; n = 65 lobes; n = 3 independent experiments; unpaired t test, t(152) = 11.62, ****p < 0.0001). Animals used in this experiment are as follows: wt4, wt7, wt8; ko4, ko6, ko7. I, Images of sagittal sections stained with antibodies against calbindin showing that PCs migrate correctly to their position in the ML and are correctly oriented. Scale bars: A, 1 cm; B, 20 μm; I, 50 μm; F, 200 μm. Error bars indicate SEM. Data points represent images taken from lobes I, III, V, VII, and IX; 4 sections per animal (B, D). ns, not significant.
- Figure 4.
Aberrant CF innervation of PCs in Pclogt/gt rats compared with Pclowt/wt. A, B, Images of sagittal sections of Pclowt/wt and Pclogt/gt cerebella at 3 months of age stained with antibodies against VGluT1 and Piccolo demonstrate the loss of Piccolo in the ML (A) and the GCL (B) in Pclogt/gt rats. C, Images of sagittal sections of Pclowt/wt and Pclogt/gt cerebella at 3 months of age stained with antibodies against calbindin and VGluT2. The CF synapses, immunopositive for VGluT2, are increased in the ML of Pclogt/gt cerebella compared with Pclowt/wt controls (C,D). When Piccolo is absent, PF synapses in the ML, immunopositive for VGluT1, do not appear overtly different between Pclowt/wt and Pclogt/gt (A). However, MF and CF synapses are altered (B–D; see Fig. 5). D, Quantification of the percentage of the ML (dashed lines) immunopositive for VGluT2 from C (Pclowt/wt = 3.521 ± 0.160, n = 128 images; Pclogt/gt = 4.377 ± 0.241, n = 112 images; n = 3 independent experiments; Mann–Whitney U test, U = 5987, *p = 0.0278). Animals used in this experiment are as follows: wt7, wt8, wt10, wt11; ko6, ko7, ko9, ko10. Scale bars, 20 μm. Error bars indicate SEM. Data points represent images taken from lobes I, III, V, VII, and IX; 4 sections per animal.
- Figure 5.
Cerebella from Pclogt/gt animals have smaller MF rosettes. A, B, Images of sagittal sections of Pclowt/wt and Pclogt/gt cerebella at 3 months of age stained with antibodies against VGluT2, which is highly expressed at MF boutons, and the somatodendritic marker MAP2 (A) or VGluT2 and VGluT1 (B). A, GCs extend their dendrites into MF boutons in the Pclowt/wt condition. However, in Pclogt/gt, while GC dendrites are still juxtaposed to VGluT2-positive boutons, the boutons are smaller and therefore the arrangement is less organized. B, Presynaptic MF glomeruli from lobes I (top) and VII (bottom) are visualized by VGluT1 and VGluT2. The reduction in MF size is consistent regardless of the lobe. Rosettes are generally labeled with either VGluT1 or VGluT2 and occasionally with both markers consistent with them being innervated by a single synaptic input from different neuronal cell types. C, Quantification of the size of VGluT1/VGluT2 clusters (Pclowt/wt = 22.73 ± 0.896 μm2, n = 4 animals; Pclogt/gt = 9.46 ± 0.2899 μm2, n = 4 animals; unpaired t test, t(6) = 14.1, ****p < 0.0001). D, E, Histograms show the distribution of puncta sized 5–50 μm2 (D) and 50–260 μm2 (E). The shift of the data indicates that Pclogt/gt MFs have more smaller puncta (5 μm2), whereas Pclowt/wt MFs have more larger puncta (up to 260 μm2). Scale bars: A, 20μm (zoom) 10μm B, 50 μm; (zoom), 20 μm. Error bars indicate SEM. Data points represent average puncta size per animal from images taken from lobes I, III, V, VII, and IX, 4 sections per animal (C–E). Animals used in this experiment are as follows: wt7, wt8, wt10, wt11; ko6, ko7, ko9, ko10.
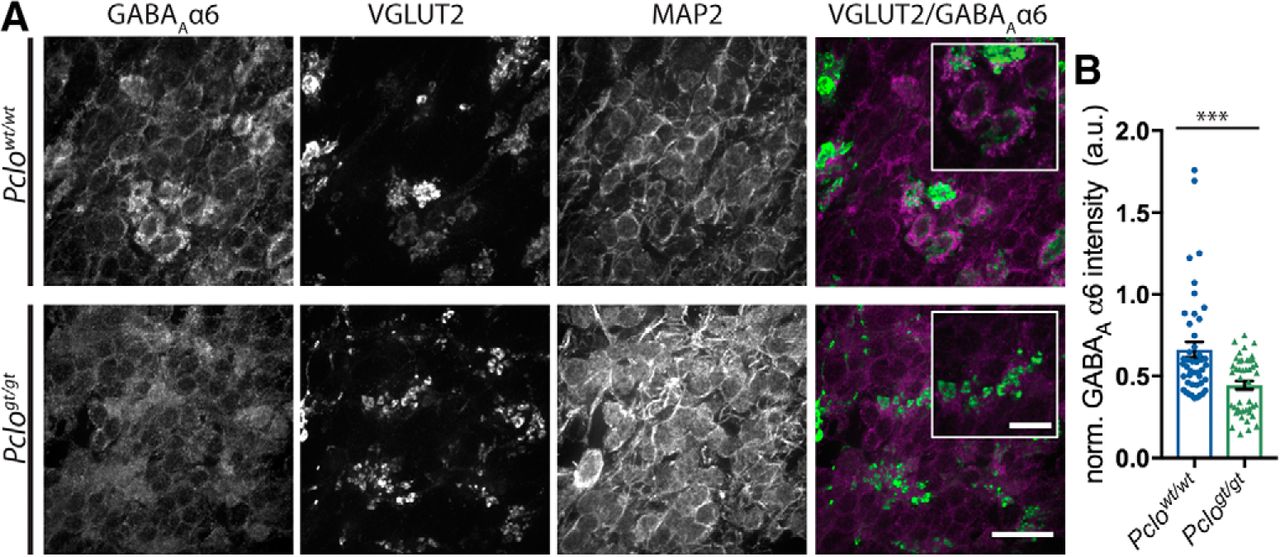
- Figure 6.
GABAAα6 subunit expression is lower in Pclogt/gt than in Pclowt/wt. A, Representative images of sagittal sections of Pclowt/wt and Pclogt/gt cerebella at 3 months of age stained with antibodies against the GABAA subunit α6, VGluT2, and MAP2. There are decreased levels of GABAAα6 in the GCL of Pclogt/gt animals compared with Pclowt/wt controls, quantified in B. B, Quantification of GABAA subunit α6, measured by the average intensity of antibody staining in images taken from the GCL of the cerebellum, normalized to MAP2 antibody intensities for the same image (Pclowt/wt = 0.661 ± 0.0479 a.u., n = 45 images from 3 individual animals; Pclogt/gt = 0.443 ± 0.26 a.u., n = 44 images from 3 individual animals; Mann–Whitney U test, U = 589, ***p = 0.0009). Scale bars, 20 μm. Error bars indicate SEM. Data points represent images taken from 4 sections per animal. Animals used in this experiment are as follows: wt10, wt11, wt13; ko9-ko11.
- Figure 7.
Glomerular rosettes are smaller and less complex in Pclogt/gt. A, B, G, K, EM images of the GCL of Pclowt/wt and Pclogt/gt cerebella at 3 months of age. GCs are indicated by “gc” (A,B), cerebellar glomeruli are highlighted in blue (Pclowt/wt) and green (Pclogt/gt) (A), and the presynaptic terminals of cerebellar MF are highlighted in blue (Pclowt/wt) and green (Pclogt/gt) (B). Asterisks indicate AZs (B), which can be seen at a higher magnification in G. K, Zoom emphasizes the presence of more CCVs in Pclogt/gt MF boutons compared with Pclowt/wt. C–F, H–J, Quantification of the size of glomeruli (C), the size of the MF presynapse (D), the complexity (squared perimeter/presynaptic area) of the MF bouton (E), the density of SVs (F), the number of AZs per area (H), the AZ length (I), and the number of AZs per presynaptic profile (J). There is a strong decrease in glomerulus and MF bouton size (C,D). C, Pclowt/wt = 34.59 ± 1.287 μm2, n = 130 images; Pclogt/gt = 18.82 ± 0.853 μm2, n = 103 images; n = 3 independent experiments; Mann–Whitney U test, U = 1733. ****p < 0.0001. D, Pclowt/wt = 17.73 ± 0.603 μm2, n = 141 images; Pclogt/gt = 11.69 ± 0.497 μm2, n = 95 images; n = 3 independent experiments; Mann–Whitney U test, U = 3057. ****p < 0.0001. E, Pclowt/wt = 90.5 ± 4.089, n = 141 images; Pclogt/gt = 58.1 ± 3.818, n = 84 images; n = 3 independent experiments; Mann–Whitney U test, U = 3373. ****p < 0.0001. F, Pclowt/wt = 94.24 ± 3.853 SVs/μm2, n = 62 images; Pclogt/gt = 100.7 ± 4.705 SVs/μm2, n = 71 images; n = 3 independent experiments; Mann–Whitney U test, U = 2042. p = 0.476. H, Pclowt/wt = 0.625 ± 0.021, n = 121 images; Pclogt/gt = 0.652 ± 0.032, n = 84 images; n = 3 independent experiments; Mann–Whitney U test, U = 4942. p = 0.7390. I, Pclowt/wt = 0.261 ± 0.000487 μm, n = 129 images; Pclogt/gt = 0.257 ± 0.00653 μm, n = 101 images; n = 3 independent experiments; Mann–Whitney U test, U = 5963. p = 0.271. J, Pclowt/wt = 10 ± 0.304, n = 141 images; Pclogt/gt = 6.571 ± 0.295, n = 84 images; n = 3 independent experiments; Mann–Whitney U test, U = 2650. ****p < 0.0001. Scale bars: A, 2.5 μm; B, 1 μm; G, 125 nm; K, 500 nm; K (zoom), 250 nm. Error bars indicate SEM. Animals used in this experiment are as follows: wt15-wt17; ko14-ko16. ns, not significant.
- Figure 8.
Physiological assessment of MF boutons. A, Example two-photon image of a cerebellar GC from a Pclogt/gt rat filled with ATTO dye. B, Average data of biophysical properties of GCs for Pclowt/wt and Pclogt/gt rats. The input resistance of GCs was higher in Pclogt/gt compared with Pclowt/wt (Pclowt/wt = 722.6 ± 76.24 mΩ, n = 22 cells; Pclogt/gt = 1160 ± 154.9 mΩ, n = 23 cells; n = 3 rats per genotype; Mann–Whitney U test, U = 165, *p = 0.0462). Whereas no differences were found in capacitance (Pclowt/wt = 3.717 ± 0.269 pF, n = 21 cells; Pclogt/gt = 3.643 ± 0.231 pF, n = 23 cells; n = 3 rats per genotype; Mann–Whitney U test, U = 236.5, p = 0.912), resting membrane potential (Vm) (Pclowt/wt = −99.96 ± 1.261 mV, n = 18 cells; Pclogt/gt = −100.8 ± 0.786 mV, n = 23 cells; n = 3 rats per genotype; Mann–Whitney U test, U = 187, p = 0.612), the half-duration of the AP (Pclowt/wt = 179.7 ± 11.84 μs, n = 18 cells; Pclogt/gt = 172.2 ± 7.366 μs, n = 23 cells; n = 3 rats per genotype; Mann–Whitney U test, U = 200, p = 0.866), the amplitude of the AP (Pclowt/wt = 67.85 ± 3.016 mV, n = 18 cells; Pclogt/gt = 63.92 ± 2.761 mV, n = 23 cells; n = 3 rats per genotype; Mann–Whitney U test, U = 166, p = 0.291), and the voltage threshold to elicit an AP (Pclowt/wt = −51.27 ± 1.748 mV, n = 18 cells; Pclogt/gt = −48.6 ± 1.659 mV, n = 23 cells; n = 3 rats per genotype; Mann–Whitney U test, U = 153 p = 0.162). C, mEPSCs from Pclogt/gt GCs were not different in their amplitude (Pclowt/wt = −19.62 ± 1.682 pA, n = 15 cells from 2 rats; Pclogt/gt = −22.44 ± 1.765 pA, n = 23 cells from 3 rats; Mann–Whitney U test, U = 136, p = 0.286) but in their frequency (Pclowt/wt = 0.102 ± 0.0167 Hz, n = 15 cells; Pclogt/gt = 0.257 ± 0.0481 Hz, n = 22 cells; n = 3 rats per genotype; Mann–Whitney U test, U = 98.5, *p = 0.0392). D, EPSCs from GCs measured after stimulation of single MFs were increased in Pclogt/gt compared with Pclowt/wt (Pclowt/wt = 47.58 ± 12.12 pA, n = 13 cells; Pclogt/gt = 67.62 ± 9.64 pA, n = 15 cells; n = 3 rats per genotype; Mann–Whitney U test, U = 52, *p = 0.0356), whereas the decay of the EPSCs was not altered (Pclowt/wt = 1.79 ± 0.258 ms, n = 12 cells; Pclogt/gt = 1.404 ± 0.141 ms, n = 14 cells; n = 3 rats per genotype; Mann–Whitney U test, U = 60, *p = 0.231). Right, Example traces of evoked EPSCs, as quantified in D, in response 1 Hz stimulation in the presence of 20 μm SR95531 and 40 μm d-APV. Scale bar: A, 20 μm. Error bars indicate SEM. Data points represent individual cells from 3 rats per genotype. Animals used in this experiment are as follows: wt18-wt20; ko17-ko19. ns, not significant.
- Figure 9.
Behavioral outcome of Piccolo LOF resembles PCH3 symptoms. A, Rotarod performance for Pclowt/wt, Pclowt/gt, and Pclogt/gt rats for 16 trials over 4 d. Pclogt/gt rats fell significantly faster than Pclow/w on Trials 6 and 8 and faster than both Pclowt/wt and Pclowt/gt on Trials 9–16. B, Grip strength task for Pclowt/wt, Pclowt/gt, and Pclogt/gt rats for 9 trials over 2 d. No differences were found for forelimb grip strength between the groups. C, Ladder walk task for Pclowt/wt, 859 Pclowt/gt, and Pclogt/gt rats for 3 trials over 1 d. Pclogt/gt rats had a higher rate of stepping errors (ladder rung foot slips/misses) than Pclowt/wt and Pclowt/gt rats. D, Open field task for Pclowt/wt, Pclowt/gt, and Pclogt/gt rats for 1 trial each over 1 d. Pclogt/gt rats performed fewer rearing behaviors than Pclowt/wt and significantly less than Pclowt/gt rats in the perimeter sectors of the arena. Other behaviors, such as crossing the open field and grooming, were not different between the three groups. Animals used in the above experiments are as follows: wt21-wt24; he1-he4; ko20-ko23. E, Locomotor activity of Pclowt/wt, Pclowt/gt, and Pclogt/gt rats during the 12 h dark phase. Pclogt/gt rats covered a >50% longer distance than Pclowt/wt and Pclowt/gt rats. Data points are individual means over 15 nights. F, Performance of Pclowt/wt, Pclowt/gt, and Pclogt/gt rats during the isometric pull-task (handle position 11 mm inside the cage). Only 4 of 11 Pclogt/gt rats succeeded at the 60 g force threshold, and Pclogt/gt rats pulled with a significantly lower success rate at all force thresholds compared with Pclowt/wt and Pclowt/gt. Error bars indicate SEM. Data points represent individual rats. For statistical analysis, see Table 1. Animals used in the above experiments are as follows: wt25-wt34; he5-he8; ko24-ko35. *, **, ***, **** describe significance between Pclowt/wt and Pclogt/gt and #, ##, ### describe significance between Pclowt/wt and Pclogt/gt.


Tables
Behavioral test Trial/event Pclowt/wt n Pclowt/gt n Pclogt/gt n wt/wt versus wt/gt (df), t value, p value wt/wt versus gt/gt (df), t value, p value One-way ANOVA Rotarod performance: 1 26.75 ± 6.486 4 16.5 ± 8.431 4 3.25 ± 0.75 4 (144), 0.681, >0.9999 (144), 1.561, >0.9999 Time to fall (s) 2 3 ± 9.138 4 38.75 ± 13.231 4 3.25 ± 0.479 4 (144), 0.515, >0.9999 (144), 1.843, >0.9999 3 29 ± 12.748 4 26.75 ± 13.949 4 2.75 ± 0.25 4 (144), 0.15, >0.9999 (144), 1.744, >0.9999 4 35.25 ± 11.25 4 23 ± 11.979 4 3.25 ± 0.479 4 (144), 0.814, >0.9999 (144), 2.126, >0.9999 5 41.75 ± 10.053 4 38 ± 15.647 4 4.5 ± 1.041 4 (144), 0.249, >0.9999 (144), 2.474, 0.6963 6 56.25 ± 5.023 4 42.5 ± 13.531 4 3.5 ± 0.5 4 (144), 0.1913, >0.9999 (144), 3.504, 0.0293 7 50.75 ± 17.585 4 44 ± 6.205 4 4.5 ± 1.323 4 (144), 0.45, >0.9999 (144), 3.072, 0.122 8 65.25 ± 18.688 4 41.75 ± 11.048 4 4.5 ± 0.957 4 (144), 1.561, >0.9999 (144), 4.035, 0.0042 9 63.25 ± 16.163 4 61.5 ± 18.319 4 3.25 ± 0.75 4 (144), 0.116, 0.0079 (144), 3.986, 0.0051 10 84.5 ± 6.225 4 60.25 ± 18.396 4 2.5 ± 0.5 4 (144), 1.611, 0.0089 (144), 5.447, 0.0001 11 72 ± 5.339 4 76.75 ± 12.419 4 3 ± 0.408 4 (144), 0.316, 0.001 (144), 4.583, 0.0005 12 71 ± 6.178 4 68.75 ± 9.681 4 4 ± 0.707 4 (144), 0.15, 0.0015 (144), 4.451, 0.0008 13 59 ± 8.297 4 57.75 ± 12.99 4 2.5 ± 0.5 4 (144), 0.083, 0.0164 (144), 3.753, 0.0121 14 69.25 ± 12.479 4 61 ± 13.638 4 2.5 ± 0.645 4 (144), 0.548, 0.0074 (144), 4.434, 0.0009 15 60.5 ± 16.297 4 65 ± 18.757 4 1.75 ± 0.479 4 (144), 0.3, 0.0022 (144), 3.903, 0.0070 16 56.5 ± 16.775 4 68.75 ± 17.109 4 2.25 ± 0.25 4 (144), 0.814,0.009 (144), 3.604, 0.0207 Grip strength task:force (g) 737.2 ± 109.9 4 621.2 ± 93.46 4 757.5 ± 66.74 4 F(2,9) = 0.642, p = 0.549 Ladder walk: FL errors/step 0.09 ± 0.00925 4 0.148 ± 0.0263 4 0.297 ± 0.0145 4 #p = 0.0157 **p = 0.002 Ladder walk: HL errors/step 0.0563 ± 0.0221 4 0.0663 ± 0.00877 4 0.238 ± 0.0543 4 #p = 0.0186 *p = 0.0135 Open field task: total events Cross 178.3 ± 29.68 4 164.5 ± 45.51 4 235.5 ± 27.11 4 p > 0.9999 p = 0.8337 F(2,9) = 1.154, p = 0.828 Rear 64.25 ± 18.31 4 76.25 ± 11.3 4 22 ± 4.203 4 p > 0.9999 p = 0.1277 F(2,9) = 5.069, p = 0.0335 Groom 2.75 ± 0.75 4 2 ± 1.08 4 5 ± 1.155 4 p > 0.9999 p = 0.4494 F(2,9) = 2.388, p = 0.1473 Mean distance traveled 135.7 ± 11.25 10 129.3 ± 10.44 4 217.8 ± 14.33 12 p > 0.9999 ***p = 0.0004 Pull-task: force (success rate) 30 g 86.722 ± 2.3 10 84.374 ± 6.324 4 61.044 ± 5.928 11 p > 0.9999 **p = 0.0018 40 g 83.603 ± 2.86 10 85.136 ± 7.373 4 47.804 ± 6.897 10 p > 0.9999 ****p = 0.0001 50 g 80.49 ± 3.442 10 71.93 ± 8.695 4 33.647 ± 6.802 10 p > 0.9999 ****p = 0.0001 60 g 69.19 ± 4.99 10 70.409 ± 10.181 3 30.003 ± 11.359 4 p > 0.9999 ***p = 0.0004 ↵aData are mean ± SEM, F, n, df, t, and p values for behavioral data as depicted in Figure 9.


