

Article Figures & Data
Figures
- Figure 1.
A dopaminergic afferent projection from the VTA to different amygdala subnuclei. A, Schematic of the experimental approach for B–F. An AAV1 vector driving the Cre-dependent expression of eGFP was injected into the VTA of a DATCre mouse. B, The injection area on the level of the VTA, with eGFP fluorescence (green channel) and the TH immunohistochemistry (red channel). The area indicated by the white box is shown at a higher magnification on the right. eGFP expression is limited to TH+ cells. C, Quantifications of (left) the percentage of eGFP+ cells that were also TH+ among all eGFP+ cells, and (right) the percentage of eGFP+ and TH+-positive cells within all TH+ cells, respectively (mean ± SEM). D, eGFP-expressing axons were observed in the BA, medial portion of the CeA (CeA-m), and in the amygdala-striatal transition zone (AStr), but were largely absent in the LA. White lines and white dashed lines indicate outlines of a mouse brain atlas (Franklin and Paxinos, 2016) overlaid over the images. E, F, Confocal images of eGFP and TH+ fibers in the BA (E) and CeA-m (F), corresponding to the white dashed boxes in D. G, Schematic of the retrograde labeling approach for H-L. H, Images of the CTB-Alexa-647 (magenta) injection site in the BA at three indicated bregma levels. I, Image of the VTA at the indicated bregma level. Magenta represents neurons back-labeled with CTB-Alexa-647. Green represents GFP (ChR2-eYFP)-positive DAT+ neurons. J, A confocal image of a CTB-Alexa-647-labeled BA-projecting neuron in the VTA. K, Plot of the DV position of CTB-Alexa-647-positive neurons within the VTA (0% represents the most dorsal position), for all sections along the anteroposterior axis of 1 mouse, and the corresponding histogram (right). Note the preferential position of BA projectors in the dorsal half of the VTA. L, Plot of the ML position of CTB-Alexa-647-positive neurons (BA projectors; n = 160), for all sections along the anteroposterior axis. Black lines indicate the medial and lateral borders of the VTA. M, Mediolateral position of BA projectors (n = 107) from another mouse (C57Bl6) back-labeled by injection of CTB-Alexa-647 into the BA.
- Figure 2.
VTA neurons, and among them dopamine neurons, respond to footshocks and acquire CS responsiveness. A, Scheme of the 3 d auditory-cued fear learning protocol (top), and freezing data (bottom) of the example mouse of C–I. B, Schematic drawing of an optrode with 16 recording channels implanted in the VTA of a DATCre x ChR2 mouse. C, Post hoc histologic image showing the placement of an optrode (dashed line) in the VTA of the example mouse (FT7612) of C–I. The tracks of two tetrodes are visible (arrows). Bottom, Scheme of the arrangement of four tetrodes (T1-T4) around the optical fiber. D, Illustration of optogenetic identification of putative DAT+ units. Raster plot for four electrodes (EI-EIV) of one tetrode, showing unsorted spikes aligned to the onsets of n = 100, 2-ms-long laser light pulses (blue shading). Spikes at 2-8 ms after the light pulse were collected and subjected to spike clustering (see Materials and Methods). E, Spiking activity of a single opto-tagged putative DAT+ unit during day 2 (training day). AP frequency (top) and z score (bottom) are shown in response to the CS (averages over the n = 30 tone presentations for each tone block), as well as in response to footshocks (averages over the n = 6 footshock presentations; right). F, Spiking activity of the same unit as in E, in response to CS presentations on day 3 (fear memory retrieval). Right, AP waveforms for the unit shown in E, F. G, H, Responses of all units in mouse FT7612 to tone presentations during days 1-3 (G), and to footshocks on day 2 (H). The peak z score responses were plotted as a function of the tone-block number (CS) or paired CS-US presentation. Pink represents units classified as CS-entrained (G) or as US responders (H). Gray represents the others. Thick red and black lines indicate average ± SEM across these groups, respectively. Square symbols connected by lines represent DAT+ units identified by optotagging. I–K, Venn-type diagrams showing the number of units in the different response classes and their overlap. I, The data are from the example mouse shown in A–H. Note the overall similar distribution and overlap of response types across the N = 3 mice. Two US-responsive units in mouse FT6963 showed reduced AP firing frequencies on the footshock (J, dashed areas). L, AP firing response of unit 17 of mouse FT6963 during day 2 of the fear learning protocol. This unit responded with a decreased AP firing frequency to footshock stimulation, and corresponds to the red dashed area in J.
- Figure 3.
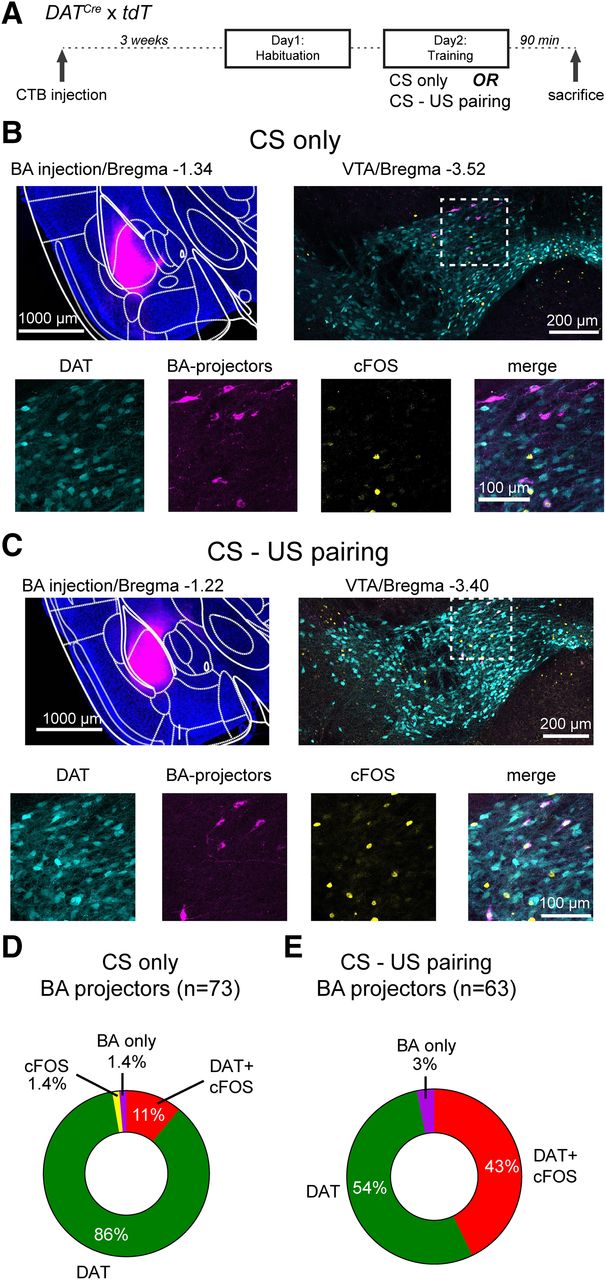
Combined cfos labeling and retrograde tracing show that BA projectors increase their activity during tone-footshock pairing. A, Schematic of the protocol used for cfos labeling; 90 min after the training session, mice were killed and prepared for cfos immunohistochemistry. B, Example images from a mouse that received only tones during the training on day 2 (CS only; control group). Top left, Wide-field fluorescence image of the BA injected with CTB-Alexa-647 for retrograde labeling (magenta channel). Top right, Confocal image on the level of the VTA, with tdTomato-positive DAT+ neurons (cyan channel) as well as labeling by the cfos antibody (yellow channel) and by CTB-Alexa-647 (magenta). Bottom row, Images represent the individual and merged channels for the boxed area in the top right. C, Corresponding images from a different mouse, which underwent CS-US pairing (i.e., with footshocks) during the training day. D, Quantification of all CTB-labeled neurons (BA projectors; n = 73) and their colabeling in N = 2 mice in the control group. A large percentage of BA projectors is DAT+ (the sum of DAT and DAT+ cfos classes; 97%), but only 11% are stained by cfos. E, Quantification of all CTB-labeled neurons (BA projectors; n = 63) from N = 2 mice that underwent the CS-US pairing before cfos immunohistochemistry. Note the larger percentage of DAT+, cfos+ BA projectors (43%; for statistical analysis, see Results).
- Figure 4.
Optogenetic inhibition of VTA dopamine neurons during the footshock decreases auditory-cued fear memory. A, Schematic of the experimental approach for B, C. An AAV1:CBA:FLEX:Arch-eGFP vector was injected unilaterally into the VTA. B, Current (top; holding potential, −60 mV) and membrane potential responses (bottom) evoked by yellow light (λ = 595 nm) in an Arch-expressing DAT neuron. C, Quantification of the peak and steady-state current response (left) and hyperpolarization (right) from n = 5 recordings in N = 3 mice. D, Schematic of the experimental approach for E-H. A stereotactic injection of the Cre-dependent Arch-eGFP vector into the VTA of DATCre mice was followed by unilateral optic fiber implantation above the injection site. E, Post hoc histologic verification of Arch-GFP expression and optic fiber placement (white dashed line) in the VTA of one example mouse. Red represents TH immunohistochemistry signal. Green represents fluorescence of Arch-eGFP. Scale bar, 200 µm. F, Schematic of yellow laser light illumination during the CS-US pairing protocol. The tone block (n = 30 tone beeps of 0.1 s at 1 Hz) is followed by a 1 s footshock. Yellow laser light (λ = 561 nm) is applied for 3 s starting 1 s before the footshock to activate Arch. G, Average time course of freezing level in Arch-expressing mice (n = 6, red), and in eGFP-expressing control mice (n = 6; black). *Significance of the photoinhibition effect as assessed by Bonferroni post hoc test at the indicated time points, following a two-way repeated-measures ANOVA. H, Percentage of freezing during cued fear memory retrieval averaged over four CS presentations on day 3 (N = 6 and N = 6 mice in the test and control group; p = 0.0134,t test). One data point from a mouse in the control group showed unusually low freezing on retrieval (26%) and was removed from the dataset. Error bars indicate mean ± SEM. *p < 0.05, **p < 0.01.
- Fig. 5.
Photoinhibition of the dopaminergic projection from the VTA to the BA during the footshock decreases the amount of cued and contextual fear memory. A, Schematic of the experimental approach for B–E. An AAV1:CBA:FLEX:Arch-eGFP vector was injected bilaterally into the VTA of DATCre mice, and optical fibers were implanted above each BA. B, Post hoc histologic validation of the bilateral optical fiber implantation above the BA. Scale bar, 200 μm. C, Scheme of the timing of yellow light application (561 nm, 3 s) delivered to each BA, aimed to suppress footshock-driven activity of VTA axons in the BA. D, Average time courses of freezing in Arch-eGFP-expressing mice (red data points) and in eGFP-expressing control mice (black). *Statistical significance of photoinhibition effect assessed by Bonferroni post hoc test for multiple comparisons at the respective time points, following the two-way repeated-measures ANOVA. E, Percentage of freezing during cued fear retrieval on day 3, averaged over the four CS presentations (N = 8 and N = 7 mice in the control and test group, respectively; p = 0.0043; t test). F, Experimental approach for G–I, in which optical fibers were implanted bilaterally above each CeA. G, Post hoc histologic validation of the bilateral optical fiber implantation above each CeA in 1 mouse. Scale bar, 200 μm. H, I, Time course and average freezing levels after silencing the VTA dopaminergic fibers over the CeA. There was no significant difference between the Arch and the eGFP (control) group (two-way repeated-measures ANOVA in H and t test in I; p = 0.9). Error bars indicate mean ± SEM. *p < 0.05, **p < 0.01.


