

Article Figures & Data
Figures
- Figure 1.
Adenosine and glutamate gate HFS-LTD at cortico-dSPN synapses. A, top left, Experimental configuration in horizontal brain slices of C57BL/6J mice. Bottom left, Confocal laser scanning microscope images of triple immunofluorescence for biotin, A2AR, and SP in patch-recorded neurons. Right, Scheme of HFS protocol. B, top left, Scheme showing glutamatergic cortical inputs to dSPNs, which are recruited following cortical electrical stimulation. Top right, Averaged recordings (10 EPSPs) before (black line) and after (blue line) HFS. Bottom left, Relative EPSP amplitude before and after HFS (vertical blue bar, as in other panels and figures) of cortical connections to dSPN in DLS in control conditions (white, n = 6, 6 mice), in the presence of the mGluR5 antagonist MPEP (yellow, n = 7, 6 mice), and in the presence of the GABABR antagonist, CGP55845 (green, n = 6, 5 mice). Bottom right, Mean normalized EPSP amplitudes before (pre) and 25–30 min after HFS (post; as in other figures) in control (white, n = 6, 6 mice, t = 9.3, df = 5, ***p = 0.0002, paired t test), MPEP (yellow, n = 7, 6 mice, t = 1, df = 6, p = 0.3, paired t test), and CGP55845 (green, n = 6, 5 mice, t = 5, df = 5, **p = 0.0038, paired t test). C, top, Averaged recordings (10 EPSCs) before (black) and after (blue) HFS. Bottom left, Relative EPSP amplitude before and after HFS in control conditions (black, n = 8, 7 mice), in the presence of MPEP (yellow, n = 5, 3 mice), the A1R antagonist DPCPX (brown, n = 8, 7 mice), and the eCB CB1R antagonist AM-251 (purple, n = 5, 3 mice). Bottom right, Mean EPSC amplitudes before and after HFS in control (black, n = 8, 7 mice, t = 4.9, df = 7, **p = 0.0018, paired t test), MPEP (yellow, n = 5, 3 mice, t = 0.4, df = 4, p = 0.7, paired t test), DPCPX (brown, n = 8, 7 mice, t = 2.2, df = 7, p = 0.06, paired t test), or AM-251 (purple, n = 5, 3 mice, t = 2.8, df = 4, *p = 0.049, paired t test). D, left, Mean CV−2 before and after HFS for the EPSP group in control conditions (white, n = 6, 6 mice, t = 2.6, df = 5, *p = 0.048, paired t test) or in the presence of MPEP (yellow, n = 7, 6 mice, W = 10, p = 0.47, Wilcoxon matched-pairs signed-rank test) or CGP (green, n = 6, 5 mice, t = 3.2, df = 5, *p = 0.024, paired t test). Right, Mean CV−2 before and after HFS delivery for the EPSC group in control conditions (black, n = 8, 7 mice, t = 2.9, df = 7, *p = 0.024, paired t test) or in the presence of MPEP (yellow, n = 5, 3 mice, W = −1, p > 0.9999, Wilcoxon matched-pairs signed-rank test), DPCPX (brown, n = 8, 7 mice, t = 1.4, df = 7, p = 0.2, paired t test), or AM-251 (purple, n = 5, 3 mice, t = 12, df = 4, p = 0.3, paired t test). Bar diagrams summarize the ratio of the SD and the mean EPSP or EPSC amplitude of the last 7 min before compared with the last 7 min after HFS delivery (as in other figures). Data are presented as mean ± SEM.
- Figure 2.
Cortical HFS enhances Ca2+ transients in DLS astrocytes through mGluR5 activation. A, top left, C57Bl/6J mice received bilateral DLS injection of the genetically-encoded cytosolic Ca2+ indicator GCaMP6f under the astrocyte GfaABC1D promoter (AAV5.G, faABC1D.cytoGCaMP6f.SV40). Bottom left, Scheme of experimental configuration for two-photon Ca2+ imaging measurements in DLS astrocytes of horizontal brain slices. Right, Representative image of ROIs automatically generated by CALSEE in control conditions. B, Representative heatmap (left) and traces (top right) of Ca2+ fluorescence from ROIs (y-axis in left) before (pre), during (HFS, black box, as in other panels), and after (post) HFS delivery in control conditions. Bottom right, Time course of Ca2+ event probability averaged in 10-s bins in control conditions before, during, and after HFS delivery. C, left, Representative heatmap of Ca2+ traces from ROIs (y-axis) before, during, and after HFS delivery in the presence of MPEP. Right, Time course of Ca2+ event probability averaged in 10-s bins in MPEP group before, during, and after HFS delivery. D, Mean Ca2+ event probability 60 s before HFS (pre), during HFS (HFS), 70 s after HFS (post), and 12 min after HFS delivery (Post_12) in different pharmacological conditions (black, control, n = 11, 5 mice, pre vs HFS vs post, RM1WA, F(10,20) = 9.082, **p = 0.0019, Dunnett; red, LY, n = 14, 3 mice, RM1WA, F(13,26) = 24.27, ****p < 0.0001, Dunnett; green, CGP, n = 12, 2 mice, RM1WA, F(11,22) = 24.35, ****p < 0.0001, Dunnett; brown, CPT, n = 9, 2 mice, RM1WA, F(8,16) = 8.736, **p = 0.003, Dunnett; yellow, MPEP, n = 9, 2 mice, RM1WA, F(8,16) = 0.6, p = 0.5; black, Control_2, n = 6, 2 mice, RM1WA, F(5,15) = 14.63, **p = 0.0029, Dunnett). Data are presented as mean ± SEM. *p < 0.05, **p < 0.01, ***p < 0.001, and ****p < 0.0001.
- Figure 3.
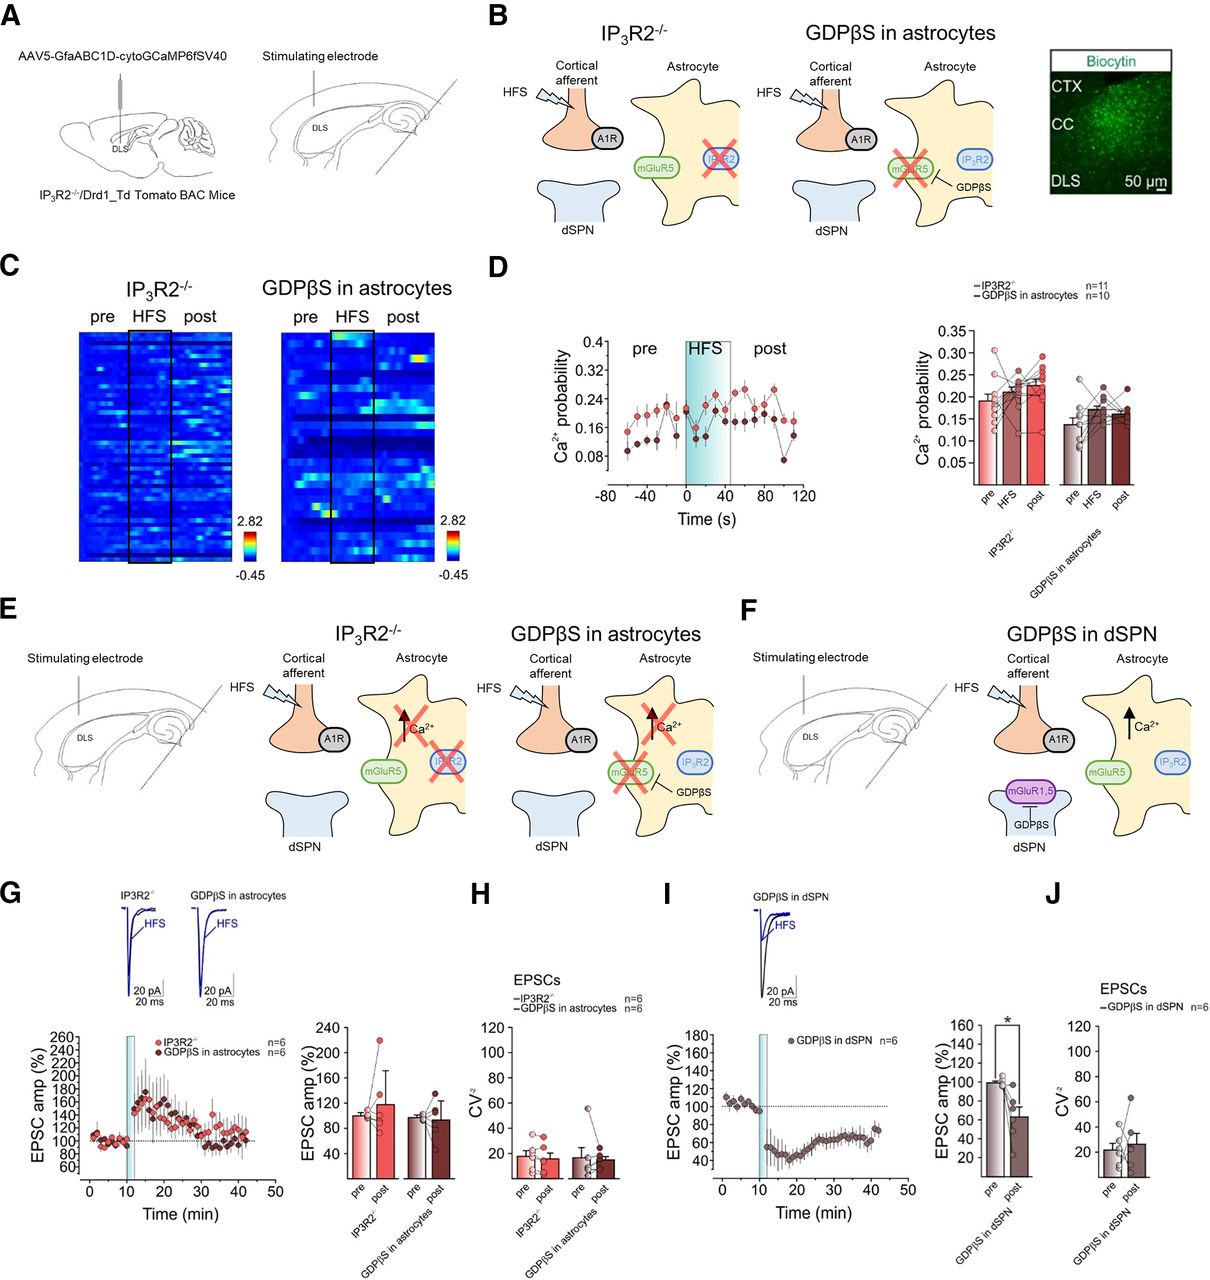
Blocking astrocyte Ca2+ activity prevents HFS-LTD at cortico-dSPN synapses. A, left, IP3R2 knock-out mice (IP3R2−/−) and Drd1-Td Tomato BAC mice received bilateral DLS injection of the genetically-encoded cytosolic Ca2+ indicator GCaMP6f under the astrocyte GfaABC1D promoter (AAV5-GfaABC1D-cytoGCaMP6fSV40). Right, Schematic of experimental configuration for two-photon Ca2+ imaging measurements in DLS astrocytes of horizontal brain slices. B, Scheme of the molecular mechanisms regulating HFS-LTD at tripartite synapses in IP3R2−/− (left) and in Drd1-Td Tomato mice with GDPβS patch-loaded astrocytes (middle). Right, Image of immunofluorescence for biocytin of biocytin-loaded astrocyte syncytium in DLS. C, Representative heatmaps of Ca2+ traces from ROIs before, during, and after HFS delivery in IP3R2−/− (left) and in Drd1-Td Tomato mice with GDPβS patch-loaded astrocyte syncytium (right). D, Left, Time course of Ca2+ event probability before, during, and after HFS in IP3R2−/− (red, n = 11, 2 mice) and in GDPβS patch-loaded astrocyte syncytium (brown, n = 10, 2 mice). Right, Mean Ca2+ event probability before, during, and after HFS in IP3R2−/− (red, n = 11, 2 mice, pre vs HFS vs post, RM1WA, F(10,20) = 1.897, p = 0.2) and in GDPβS patch-loaded astrocyte syncytium (brown, n = 10, 2 mice, pre vs HFS vs post, Friedman test, p = 0.1). E, Scheme of experimental configuration (left) and the molecular mechanisms regulating HFS-LTD at tripartite synapses in IP3R2−/− (middle) and in Drd1-Td Tomato mice with GDPβS patch-loaded astrocytes (right). F, Scheme of experimental configuration (left) and the molecular mechanisms regulating HFS-LTD at tripartite synapses in C57Bl/6J mice with GDPβS patch-loaded dSPN (right). G, top, Averaged recordings (10 EPSCs) before (black) and after (blue) HFS. Bottom left, Relative EPSC amplitudes before and after HFS in IP3R2−/− (red, n = 6, 5 mice) and in Drd1-Td Tomato mice with GDPβS patch-loaded astrocyte syncytium (brown, n = 6, 4 mice). Bottom right, Mean normalized EPSC amplitudes before and after HFS in IP3R2−/− (red, n = 6, 5 mice, t = 0.8, df = 5, p = 0.5, paired t test) and GDPβS in astrocytes (brown, n = 6, 4 mice, t = 0.3, df = 5, p = 0.8, paired t test). H, Mean CV−2 before and after HFS in IP3R2−/− (red, n = 6, 5 mice, t = 1.7, df = 5, p = 0.16, paired t test) and in GDPβS in astrocytes (brown, n = 6, 4 mice, W = 7, p = 0.56, Wilcoxon matched-pairs signed-rank test). I, top, Averaged recordings (10 EPSCs) before (black) and after (blue) HFS. Bottom left, Relative EPSC amplitudes before and after HFS in C57Bl/6J mice with GDPβS patch-loaded dSPN (gray, n = 6, 4 mice). Bottom right, Mean normalized EPSC amplitudes before and after HFS in GDPβS patch-loaded dSPN (gray, n = 6, 4 mice, t = 3.3, df = 5, *p = 0.02, paired t test). J, Mean CV−2 before and after HFS in GDPβS patch-loaded dSPN (gray, n = 6, 4 mice, t = 0.4, df = 5, p = 0.7, paired t test). Data are presented as mean ± SEM.
- Figure 4.
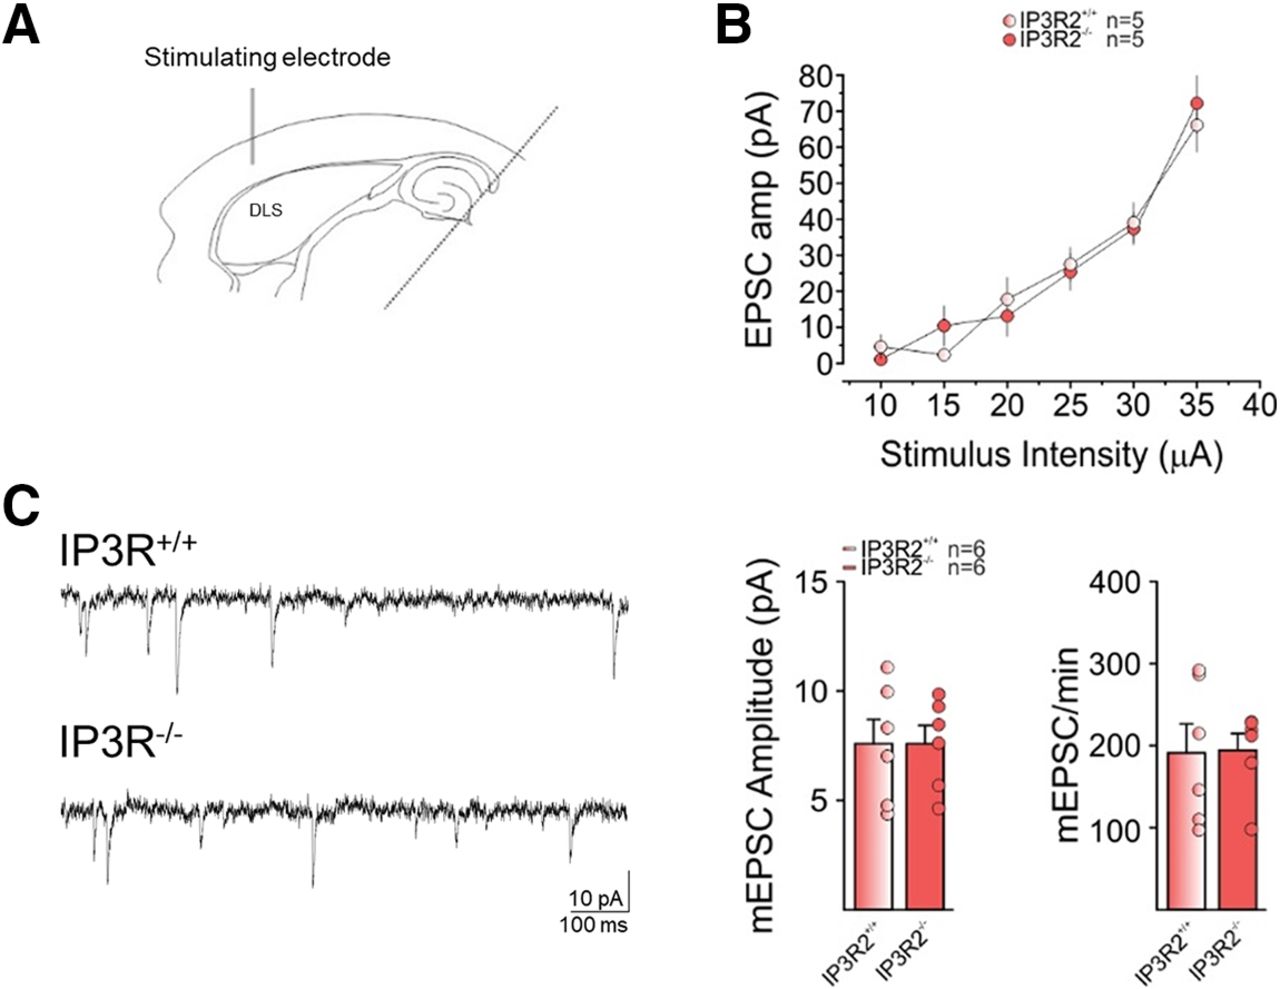
Basal synaptic transmission is not affected in IP3R2−/− mice. A, Experimental configuration in horizontal brain slices of IP3R2−/− and wild-type (WT) littermates. B, Changes in EPSC amplitude evoked by different stimulus intensities in IP3R2−/− (light red, n = 5, 2 mice) and WT littermates (red, n = 5, 2 mice; F(1,5) = 86.10, RM1WA, p = 0.07). C, left, Representative traces of miniature EPSCs (mEPSCs) in IP3R2−/− (bottom) and WT littermates (top). Right, Mean mEPSC amplitude (pA) in IP3R2−/− (red, n = 6, 2 mice) and WT littermates (light red, n = 6, 2 mice, t = 0.00,019, df = 10, p = 0.99, t test) and mean mEPSC/min in IP3R2−/− (red, n = 6, 2 mice) and WT littermates (light red, n = 6, 2 mice, t = 0.07, df = 10, p = 0.94, t test).
- Figure 5.
Astrocyte Gq DREADD activation induces A1R-dependent LTD at cortico-dSPN synapses. A, left, C57BL/6J mice received bilateral DLS injection of AAV5-GfaABC1D-cytoGCaMP6fSV40 along with either AAV8-GFAP-mCherry (control condition) or AAV8-GFAP-hM3Dq-mCherry virus. Middle, Schematic of experimental configuration for two photon Ca2+ imaging measurements in DLS astrocytes of horizontal brain slices. Right, Scheme of the molecular mechanisms regulating synaptic plasticity at tripartite synapses in C57Bl/6J mice with astrocyte-specific Gq DREADDs. B, Confocal laser scanning microscope image of immunohistochemistry showing colocalization of hM3Dq-mCherry with the astrocytic marker GFAP, but not with the neuronal marker NeuN. C, left, Representative heatmap of Ca2+ traces from ROIs before and during CNO bath application in mice expressing AAV8-GFAP-hM3Dq-mCherry. Middle, Time course of Ca2+ event probability before and after (last 4 min) CNO bath application in mice expressing AAV8-GFAP-hM3Dq-mCherry. Right, mean Ca2+ event probability before (pre) and after (post) CNO bath application in mice expressing AAV8-GFAP-mCherry (control condition; orange, n = 8, 2 mice, t = 1.5, df = 7, p = 0.2, paired t test) or AAV8-GFAP-hM3Dq-mCherry (red, n = 11, 2 mice, t = 4, df = 10, **p = 0.002, paired t test). D, left, Drd2_eGFP mice received bilateral DLS injection of AAV8-GFAP-mCherry (control condition) or AAV8-GFAP-hM3Dq-mCherry virus. Middle, Scheme of experimental condition. Right, Scheme of the molecular mechanisms regulating synaptic plasticity at tripartite synapses in C57Bl/6J mice with astrocyte-specific Gq DREADDs. E, left, Averaged recordings (10 EPSCs) before (black) and after (blue) CNO bath application. Middle, Relative EPSC amplitudes before and after CNO bath application in mice expressing AAV8-GFAP-mCherry (orange, n = 4, 3 mice), or in mice expressing AAV8-GFAP-hM3Dq-mCherry in control (red, n = 5, 5 mice), in CPT (maroon, n = 5, 4 mice), or in CPT plus MPEP and LY (gray, n = 6, 4 mice). Right, Mean normalized EPSC amplitudes before and after CNO in mice expressing AAV8-GFAP-mCherry (orange, n = 4, 3 mice, W = 0, p > 0.9999, Wilcoxon matched-pairs signed-rank test), or in mice expressing AAV8-GFAP-hM3Dq-mCherry in control (red, n = 5, 5 mice, t = 3.6, df = 4, *p = 0.02, paired t test), in CPT (maroon, n = 5, 4 mice, t = 4.3, df = 4, *p = 0.01, paired t test) or in CPT plus MPEP and LY (gray, n = 6, 4 mice, t = 0.2, df = 5, p = 0.9, paired t test). F, Mean CV−2 before and after CNO in mice expressing AAV8-GFAP-mCherry (orange, n = 4, 3 mice, W = 0, p > 0.9999, Wilcoxon matched-pairs signed-rank test), in mice expressing AAV8-GFAP-hM3Dq-mCherry in control (red, n = 5, 5 mice, W = −7, p = 0.44, Wilcoxon matched-pairs signed-rank test), in CPT (maroon, n = 5, 4 mice, W = 13, p = 0.13, Wilcoxon matched-pairs signed-rank test), or in CPT plus MPEP and LY (gray, n = 6, 4 mice, t = 1.3, df = 5, p = 0.26, paired t test). Data are presented as mean ± SEM.
- Figure 6.
CNO-induced synaptic depression does not occlude HFS-LTD. A, left, C57BL/6J mice received bilateral DLS injection of AAV8-GFAP-hM3Dq-mCherry. Middle left, Experimental configuration in horizontal brain slices. Middle right, Bright field image (left) and confocal laser scanning microscope image (middle) showing the expression of mCherry in the DLS. Right, Scheme of the molecular mechanisms regulating synaptic plasticity at tripartite synapses in C57Bl/6J mice with astrocyte-specific Gq DREADDs. B, Left, Averaged recordings (10 EPSCs) before CNO bath application (black), after CNO bath application (blue), and after CNO+HFS (gray). Right, Relative EPSC amplitudes (relative to Pre-CNO) before and after CNO bath application and subsequent HFS in C57BL/6J mice expressing AAV8-GFAP-hM3Dq-mCherry. C, Relative mean EPSC amplitudes 5 min before (Pre-CNO) and 25–30 min after CNO (Post-CNO; red, n = 5, 3 mice; Pre-CNO vs Post-CNO, t = 4.8, df = 4, **p = 0.009, paired t test) and relative mean EPSCs amplitudes 5 min before (Post-CNO_Pre-HFS) and 15–20 min after HFS (Post-CNO_Post-HFS; silver, n = 5, 3 mice; Post-CNO_Pre-HFS vs Post-CNO_Post-HFS, t = 4.1, df = 4, *p = 0.015, paired t test). D, Mean CV−2 before (orange) and after (red) CNO application and subsequent HFS (silver; n = 5, 3 mice, RM1WA F(4,8) = 0.87, p = 0.45). All data are presented as mean ± SEM.
- Figure 7.
Working model of astrocyte-mediated LTD at cortico-dSPN synapses. HFS of deep Layer V of somatosensory cortex (1) induces glutamate release from cortical afferents that activates mGluR5 on astrocytes (2), leading to GPCR-IP3R2-mediated Ca2+ increases (3), and extracellular accumulation of astrocyte-derived adenosine (4). Adenosine activates A1R located on cortical afferents to suppress subsequent glutamate release, resulting in LTD (5).


