

Article Figures & Data
Figures
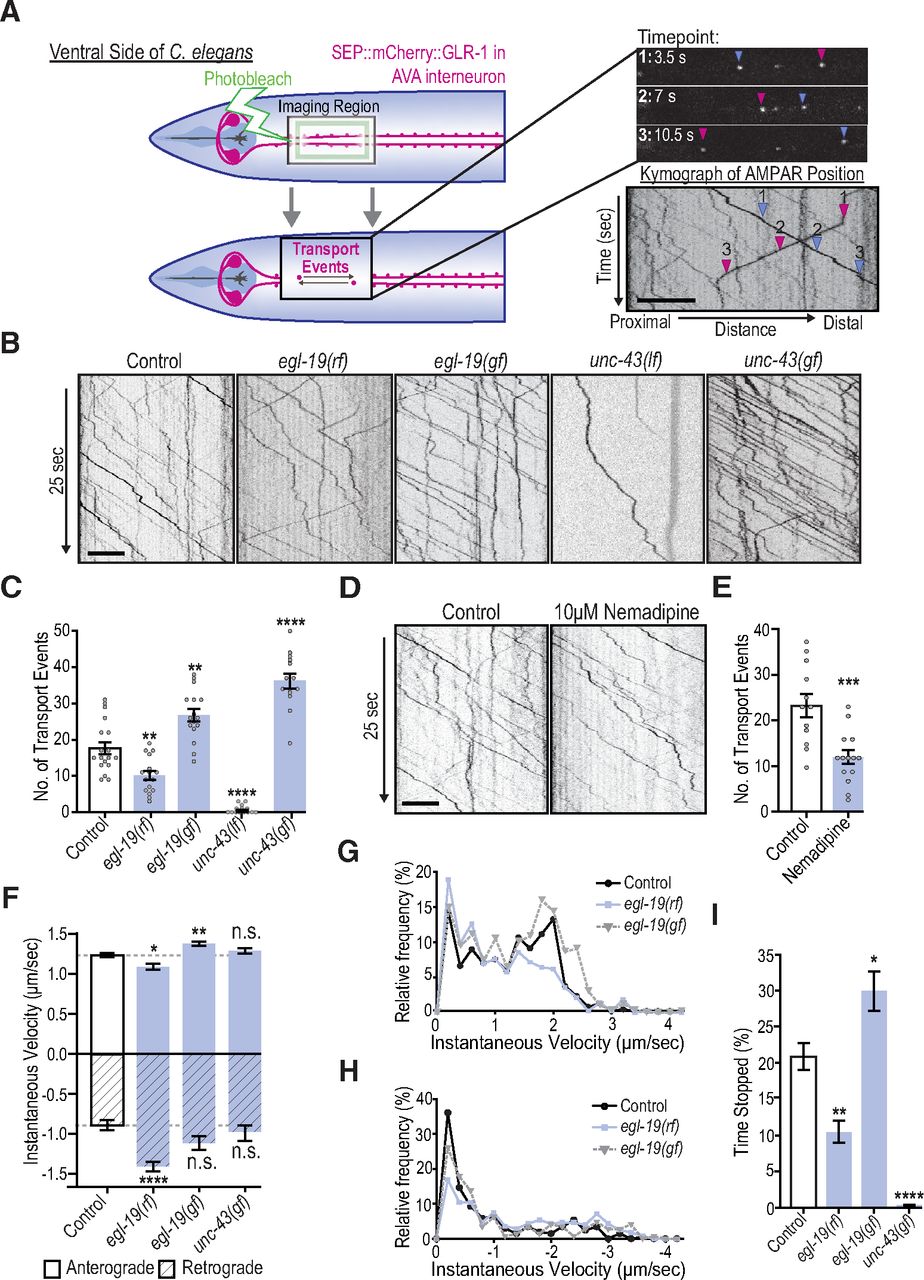
- Figure 1.
Activity-dependent calcium signaling regulates GLR-1 transport. A, Left, Diagram illustrating the location and procedure for in vivo imaging of mCherry::SEP::GLR-1 in AVA. Top right, Representative images at three time points showing positions of AMPAR-containing vesicles as they progress away from the cell body (blue arrowhead) and toward the cell body (fuchsia arrowhead). Bottom right, Kymograph displaying the position (x axis) of AMPAR-containing vesicles over time (y axis). Arrowheads indicate position of vesicles in kymograph that correspond to representative images at time points 1-3. Scale bar, 5 µm. All animals are expressing SEP::mCherry::GLR-1 in the glr-1(ky176) background. For all transport experiments, animals with no additional mutations in this background are referred to as “controls.” B, 25 s of representative kymographs from controls, egl-19 reduced-function (rf), egl-19 gain-of-function (gf), unc-43 loss-of-function (lf), and unc-43 gain-of-function (gf) mutants. Scale bar, 5 µm. C, Total GLR-1 transport (anterograde and retrograde events) quantified from kymographs representative of a 50 s image stream (n > 14 worms for each group). **p = 0.036, ****p < 0.0001, compared with controls. D, 25 s of representative kymographs of DMSO (control) and 10 µm nemadipine-treated worms. Scale bar, 5 µm. E, Total GLR-1 transport from DMSO controls (n = 12) and nemadipine-treated groups (n = 14). ***p = 0.005, compared with DMSO control. F–I, Stop and velocity analysis of >60 transport events from controls, egl-19(rf), egl-19(gf), and unc-43(gf) mutants. F, Instantaneous velocity of AMPAR vesicles traveling in either an anterograde (solid) or retrograde fashion (diagonal lines; n > 60 transport events). n.s. = not significant, *p = 0.012, **p = 0.003, ****p < 0.0001, compared with controls. G, H, Distribution of instantaneous velocities (binned every 0.2 µm/s) for anterograde (G) and retrograde (H) transport for controls, egl-19(rf), and egl-19(gf) mutants. I, The percent of time GLR-1-containing vesicles spent stopped in each genotype as quantified from the same transport events in A. *p = 0.043, **p = 0.001, ****p < 0.0001, compared with controls. Error bars indicate SEM.
- Figure 3.
Physiologic increase in ROS levels cause decreased GLR-1 transport and alters transport dynamics. For all transport experiments, each group is expressing SEP::mCherry::GLR-1 in the glr-1(ky176) background, and groups not subject to H2O2 treatment or additional mutations are referred to as “controls.” A, Representative kymographs from controls, 10, 50, and 100 nm H2O2-treated worms. Scale bar, 5 µm. B, Quantification of total transport events from 50 s recordings from control (n = 22), 10 (n = 20), 50 (n = 21), and 100 nm H2O2-treated (n = 22) worms. n.s. = not significant, ****p < 0.0001. C, Representative kymographs from controls and ctl-2(lf) mutants. D, Quantification of total transport events in controls (n = 21) and ctl-2(lf) (n = 28). **p = 0.0012. E, G, Instantaneous velocity analysis of anterograde transport events in (E) control and 50 nm H2O2-treated worms (n > 90 events; ****p < 0.0001 compared with controls) or (G) controls and ctl-2(lf) mutants (n > 50 events; ****p < 0.0001 compared with controls). F, H, Frequency distribution of the anterograde instantaneous velocities (binned every 0.2 µm/s) in (F) controls and 50 nm H2O2-treated worms or (H) controls and ctl-2(lf) mutants. I, J, Percent of time GLR-1 vesicles spent stopped in each group. ****p < 0.0001, compared with controls.
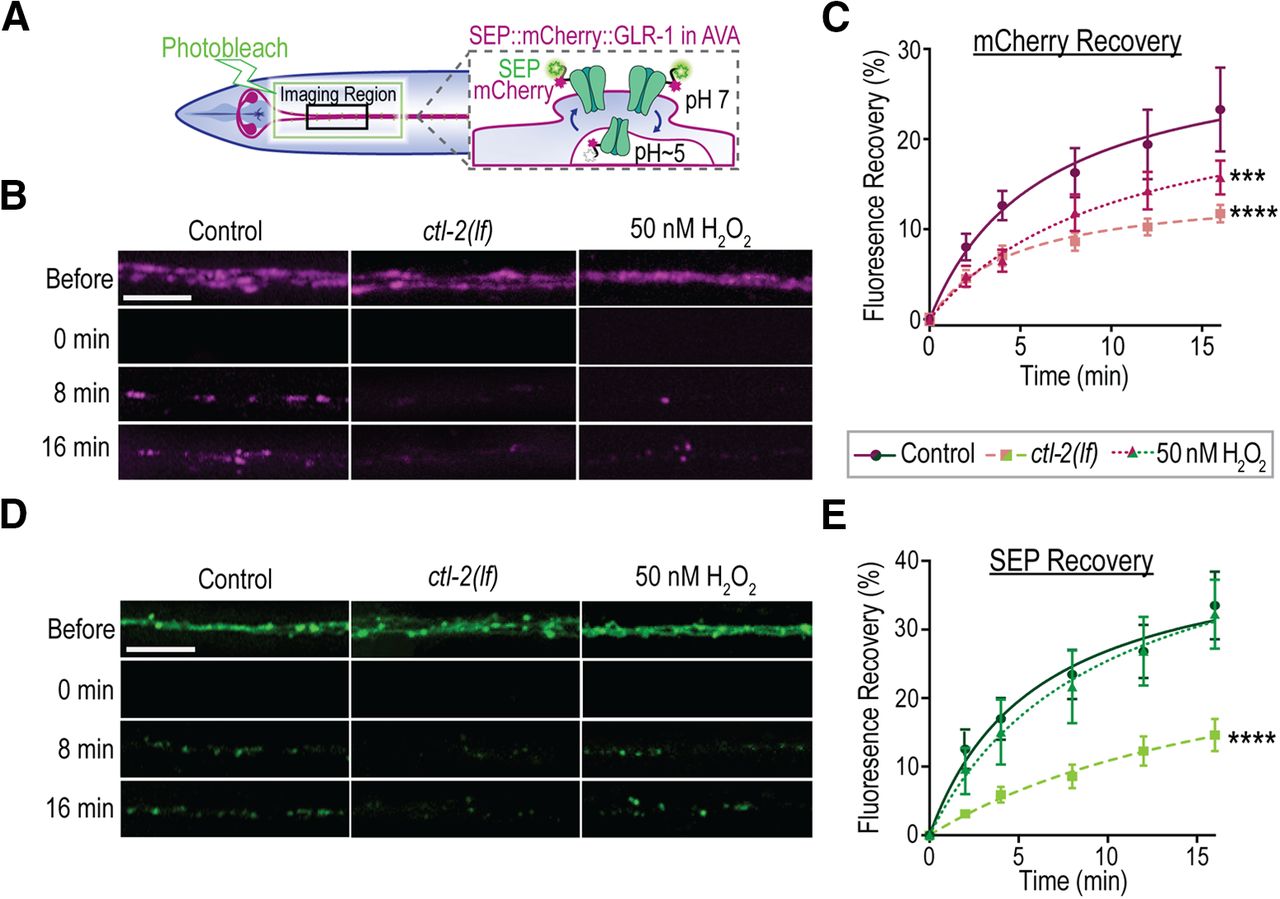
- Figure 4.
Physiologic increase in ROS cause decreased GLR-1 delivery and exocytosis to synapses. A, Illustration of imaging location of FRAP in the AVA interneurons expressing GLR-1 tagged with SEP, a pH-sensitive GFP, and mCherry. All experimental groups express this dual-tagged GLR-1 in the AVA in the glr-1(ky176) background. Groups that were not subject to H2O2 treatment or additional mutations are referred to as “control.” B, Representative maximum projections of the mCherry fluorescence in the AVA interneurons before, immediately after (0 min), 8 and 16 min after photobleaching of the imaging region. Scale bar, 5 µm. C, Percent recovery of mCherry fluorescence after photobleaching over time in control, untreated ctl-2(lf), and 50 nm H2O2-treated worms (n = 10 for each group). ***p = 0.001, ****p < 0.0001, compared with controls. D, Representative maximum projections of the SEP fluorescence in the AVA interneurons before, immediately after, 8 and 16 min after photobleaching of the imaging region. Scale bar, 5 µm. E, Percent recovery of SEP fluorescence compared with before photobleaching from the same worms as in Figure 4C. ****p < 0.0001, compared with controls.
- Figure 5.
Increased ROS acts on GLR-1 transport upstream of CaMKII activation. A, Previously proposed model of an activity-dependent calcium signaling pathway regulating AMPAR transport (Hoerndli et al., 2015). All experimental groups express SEP::mCherry::GLR-1 in the glr-1(ky176) background. B, 25 s of representative kymographs from each experimental group. Scale bar, 5 µm. C, Quantification of transport events from full-length kymographs (50 s) in control, unc-43(lf), and unc-43(gf) without (–, white bars) and with (+, blue bars) the ctl-2(lf) mutation (n ≥ 13). n.s. = not significant, **p = 0.0012, ****p < 0.0001, compared with controls lacking the ctl-2(lf) mutation. D, Instantaneous velocity of anterograde transport for the same animals from B and C (n > 60 events). n.s. = not significant, ****p < 0.0001, compared with controls lacking the ctl-2(lf) mutation. E, Percent of time GLR-1 vesicles spent stopped in these same genotypes (n > 60 events). **p = 0.009, ****p < 0.0001, compared with controls lacking the ctl-2(lf) mutation. F, 25 s of representative kymographs from each experimental group. Scale bar, 5 µm. G, Quantification of transport events in control or unc-43(gf) with (+, blue bars) or without (–, white bars) 50 nm H2O2 treatment (n ≥ 14). n.s. = not significant, *p = 0.025, ***p = 0.0002, ****p < 0.0001, compared with untreated control.
- Figure 6.
ROS decrease GLR-1 transport numbers and alter transport dynamics by acting on or downstream of L-VGCCs. All experimental groups express SEP::mCherry::GLR-1 in the glr-1(ky176) background. A, G, I, 25 s from representative kymographs from each experimental group. Scale bar, 5 µm. B, Quantification of transport events from controls, egl-19(rf), or egl-19(gf) without (–, white bars) or with (+, blue bars) the ctl-2(lf) mutation (n ≥ 15). n.s. = not significant, *p = 0.012, **p = 0.007, ***p = 0.0005, compared with controls lacking the ctl-2(lf) mutation. ††††p < 0.0001, compared with egl-19(gf) alone. C, Instantaneous velocity of anterograde transport events in each group (n ≥ 44 events). n.s. = not significant, *p < 0.05, **p = 0.0035, ***p = 0.0005, ****p < 0.0001, compared with controls lacking the ctl-2(lf) mutation. ††††p < 0.0001, compared with egl-19(gf) alone. D, E, Frequency distribution of instantaneous velocity (binned every 0.2 µm/s) of anterograde transport events for egl-19(gf) single and double mutants (D) as well as egl-19(rf) single and double mutants (E) compared with controls lacking ctl-2(lf). F, Percent of time each GLR-1 vesicle spent stopped for each group (n ≥ 44 events). n.s. = not significant, *p = 0.044, **p ≤ 0.009, ****p < 0.0001, compared with controls lacking ctl-2(lf). ††††p < 0.0001, compared with egl-19(gf) alone. H, Quantification of transport events from controls and egl-19(gf) without (–, white bars) or with (+, blue bars) 50 nm H2O2 treatment (n ≥ 18). n.s. = not significant, *p ≤ 0.038, compared with untreated controls. ††p = 0.007, compared with untreated egl-19(gf). J, Quantification of transport events in controls and ctl-2(lf) with (+, blue bars) and without (–, white bars) 10 µm nemadipine treatment (n > 10). n.s. = not significant, *p < 0.05, compared with untreated controls.
- Figure 7.
ROS decrease GLR-1 synaptic delivery and exocytosis by acting on or downstream of L-VGCCs. All experimental groups express mCherry::SEP:: GLR-1 in the AVA in the glr-1(ky176) background. Groups without additional mutations are referred to as “control.” A, Representative maximum projections of the mCherry fluorescence in the AVA interneurons before, immediately after, and 16 min after photobleaching of the imaging region from each experimental group. Scale bar, 5 µm. B, Recovery of mCherry fluorescence following photobleaching in control, egl-19(rf), and egl-19(gf) with (dashed curves) and without (solid curves) ctl-2(lf) (n ≥ 8). **p = 0.003, ****p < 0.0001, compared with controls. †††p = 0.0001, compared with egl-19(gf) single mutant. C, Representative maximum projections of the SEP fluorescence in the same groups. Scale bar, 5 µm. D, SEP fluorescence recovery in the same experimental groups. ****p < 0.0001, compared with controls. ††††p < 0.0001, compared with egl-19(gf).
- Figure 8.
Proposed ROS signaling effect on GLR-1 transport. Model showing that increases in ROS inhibit the activity-dependent changes in cytoplasmic calcium, which occur mostly because of calcium influx through L-VGCC (yellow channel, VGCC), but also AMPARs (green channel) and NMDARs (orange channel). Intracellular release of calcium, such as from the ER via ryanodine receptors (blue channel, RyR), can also contribute to cytoplasmic elevations in calcium. As a consequence, decreased cytoplasmic calcium limits calmodulin (CaM) binding and activation of CaMKII, reducing the number of AMPAR transport and delivery to synapses.


