

Article Figures & Data
Figures
- Figure 1.
Social interaction reduces stress-induced grooming behavior and STP in CRHPVN neurons. A, Single-housed female mice were subjected to the FS protocol (0.5 mA for 2 s every 30 s over 5 min) and then returned to the homecage for 30 min. B, One mouse from a female dyad of littermates was exposed to FS and returned to its partner in the homecage for 30 min. Ci, Histogram showing the percentage of single-housed FS mice (N = 10 mice) that exhibited self-grooming behavior during each 30-s bin over the 30-min observation period. Cii, Cumulative graph illustrates the relative grooming of single-housed FS mice. Di, Histogram showing the percentage of pair-housed FS mice (N = 8 mice) that exhibited self-grooming behavior during each 30-s bin over the 30-min observation period. Dii, Cumulative graph illustrates the relative grooming of pair-housed FS mice. E, Single-housed FS mice engaged in more self-grooming than pair-housed FS mice (single-housed, mean: 467.2 ± 41.6 s, N = 10 mice; pair-housed, mean: 308.6 ± 25.6 s, N = 8 mice; p = 0.008, unpaired t test, two-tailed, t(16) = 3.1). Horizontal bars represent the means. Fi, Histograms showing the percentage of single-housed (left; N = 10 mice) and pair-housed (right; N = 8 mice) FS mice that exhibited locomotor activity during each 30-s bin over the 30-min observation period. Fii, Cumulative graph illustrates the relative locomotion of single-housed (gray line) and pair-housed (pink line) FS mice. G, Single-housed and pair-housed FS mice spent a similar amount of time engaged in locomotion (single-housed, mean: 277.9 ± 11.8 s, N = 10 mice; pair-housed, mean: 287.9 ± 33.8 s, N = 8 mice; p = 0.77, unpaired t test, two-tailed, t(16) = 0.30). Horizontal bars represent the means. H, Histogram showing the percentage of unstressed partner mice (N = 8 mice) that engaged in anogenital or head/torso investigation toward the stressed subject during each 30-s bin over the 30-min observation period. Ii, EPSCs in CRHPVN neurons of single-housed FS mice potentiated following HFS (gray bar) relative to baseline. Inset, synaptic currents before and after HFS in single-housed FS mice. Iii, STP was present in cells from single-housed FS mice (mean: 142.0 ± 8.6%, n = 11 cells, p = 0.0002 vs baseline, one-sample t test, two-tailed, t(10) = 5.6). Iiii, STP was present in single-housed FS mice (mean: 138.1 ± 8.7%, N = 3 mice, p = 0.04 vs baseline, one-sample t test, two-tailed, t(2) = 4.4). Ji, EPSCs in CRHPVN neurons of pair-housed FS mice potentiated following HFS (gray bar) relative to baseline. Inset, synaptic currents before and after HFS in pair-housed FS mice. Jii, STP was present in cells from pair-housed FS mice (mean: 116.9 ± 6.3%, n = 20 cells, p = 0.01 vs baseline, one-sample t test, two-tailed, t(19) = 2.8). Jiii, STP was absent in pair-housed FS mice (mean: 110.8 ± 7.1%, N = 5 mice, p = 0.06 vs baseline, one-sample t test, two-tailed, t(4) = 2.6). K, STP (average ESPC amplitude first minute post-HFS relative to baseline, individual cells shown) was larger in single-housed FS mice than in pair-housed FS mice (p = 0.02, unpaired t test, two-tailed, t(29) = 2.4). Horizontal bars represent the means. Scale bars (Ii, Ji) represent 5 ms and 20 pA. Inset currents (Ii, Ji) before HFS are scaled to allow for easier comparison after HFS. *p < 0.05, **p < 0.01, ***p < 0.001. Error bars represent ±SEM.
- Figure 2.
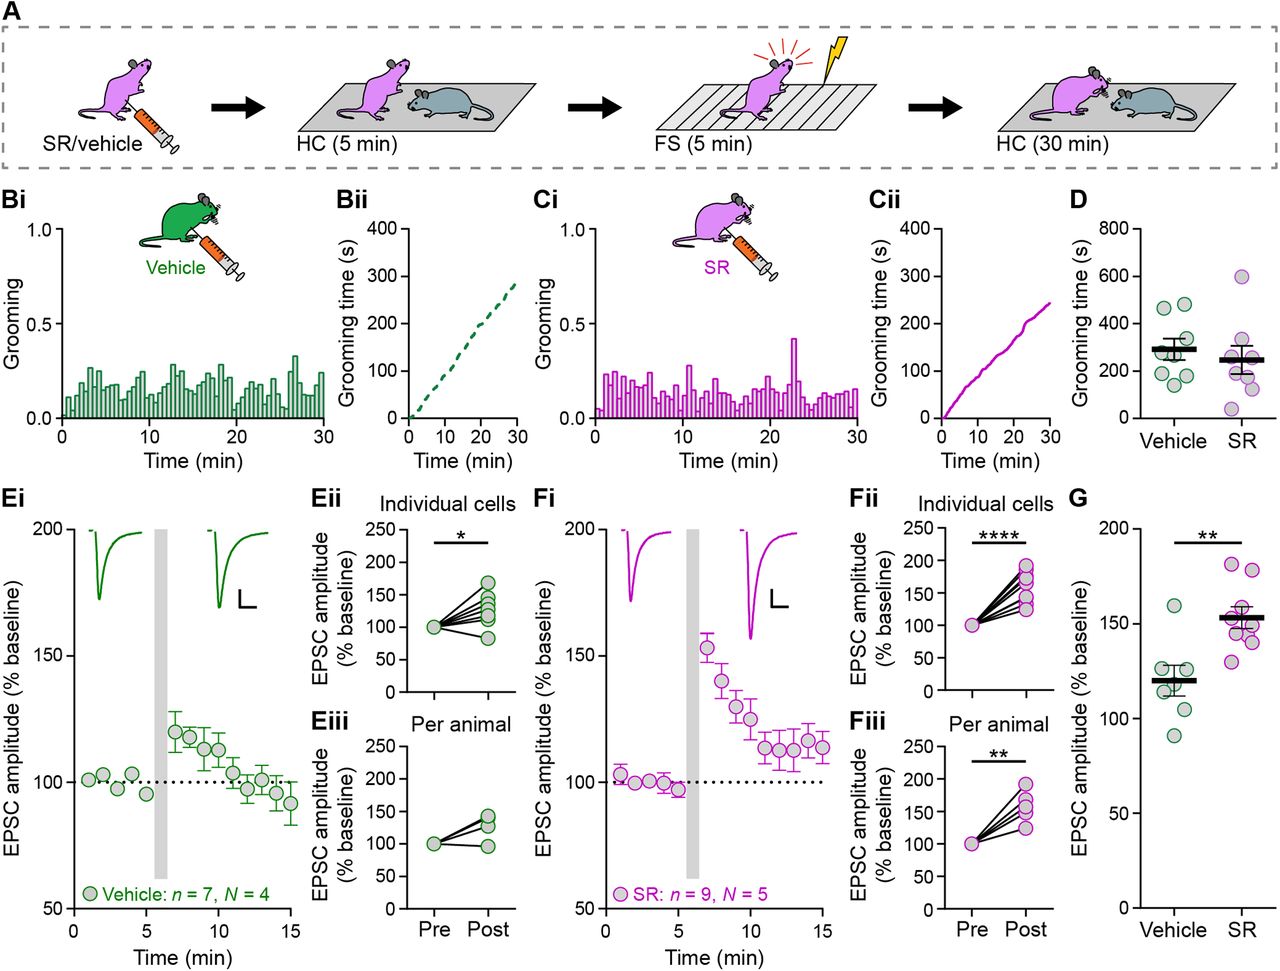
V1aR antagonism prevents social buffering of stress-induced STP but not grooming behavior. A, One mouse from a female dyad of littermates was injected intraperitoneally with either the V1aR antagonist SR (2 mg/kg) or vehicle 5 min before FS. Immediately following FS, the mouse was returned to its partner in the homecage for 30 min. Bi, Histogram showing the percentage of vehicle-injected FS mice (N = 8 mice) that exhibited self-grooming behavior during each 30-s bin over the 30-min observation period. Bii, Cumulative graph illustrates the relative grooming of vehicle-injected FS mice. Ci, Histogram showing the percentage of SR-injected FS mice (N = 8 mice) that exhibited self-grooming behavior during each 30-s bin over the 30-min observation period. Cii, Cumulative graph illustrates the relative grooming of SR-injected FS mice. D, Vehicle-injected and SR-injected FS mice spent a similar amount of time self-grooming (vehicle, mean: 292.2 ± 45.3 s, N = 8 mice; SR, mean: 246.9 ± 59.5 s, N = 8 mice; p = 0.55, unpaired t test, two-tailed, t(14) = 0.61). Horizontal bars represent the means. Ei, EPSCs in CRHPVN neurons of female FS mice injected with vehicle potentiated following HFS (gray bar) relative to baseline. Inset, synaptic currents before and after HFS in vehicle-injected FS mice. Eii, STP was present in cells from vehicle-injected FS mice (mean: 119.9 ± 8.1%, n = 7 cells, p = 0.04 vs baseline, one-sample t test, two-tailed, t(6) = 2.5). Eiii, STP was absent in vehicle-injected FS mice (mean: 119.7 ± 8.2%, N = 4 mice, p = 0.09 vs baseline, one-sample t test, two-tailed, t(3) = 2.4). Fi, EPSCs in CRHPVN neurons of female FS mice injected with or SR potentiated following HFS (gray bar) relative to baseline. Inset, synaptic currents before and after HFS in SR-injected FS mice. Fii, STP was present in cells from SR-injected FS mice (mean: 153.2 ± 5.7%, n = 9 cells, p < 0.0001 vs baseline, one-sample t test, two-tailed, t(8) = 8.1). Fiii, STP was present in SR-injected FS mice (mean: 154.4 ± 6.4%, N = 5 mice, p = 0.004 vs baseline, one-sample t test, two-tailed, t(4) = 5.9). G, STP (individual cells shown) was larger in SR-injected FS mice than in vehicle-injected FS mice (p = 0.004, unpaired t test, two-tailed, t(14) = 3.5). Horizontal bars represent the means. Scale bars (Ei, Fi) represent 5 ms and 20 pA. Inset currents (Ei, Fi) before HFS are scaled to allow for easier comparison after HFS. *p < 0.05, **p < 0.01, ****p < 0.0001. Error bars represent ±SEM.
- Figure 3.
No role for VP receptor signaling in investigative behavior. A, Naive mice spent a similar amount of time investigating vehicle-injected and SR-injected FS mice (vehicle, mean: 185.1 ± 14.5 s, N = 8 mice; SR, mean: 166.4 ± 18.8 s, N = 8 mice; p = 0.45, unpaired t test, two-tailed, t(14) = 0.79) during the 30-min observation period. Horizontal bars represent the means. B, Naive mice spent a similar amount of time investigating the anogenital region (AG vehicle, mean: 90.3 ± 9.1 s, N = 8 mice; AG SR, mean: 81.9 ± 11.3 s, N = 8 mice; p = 0.76, one-way ANOVA, F(3,28) = 0.39; p = 0.99, followed by Sidak's multiple comparisons test) and head/torso region (H/T vehicle, mean: 94.8 ± 8.2 s, N = 8 mice; H/T SR, mean: 84.5 ± 8.3 s, N = 8 mice; p = 0.97, Sidak's multiple comparisons test) of SR-injected and vehicle-injected FS mice. Horizontal bars represent the means. C, Color plots (above) show the overall social discrimination indices for naive mice toward their respective vehicle-injected or SR-injected FS partners. Color plots (below) show the social discrimination indices for each individual naive mouse toward their respective FS partner. D–F, The duration of locomotion (vehicle, mean: 227.6 ± 20.6 s, N = 8 mice; SR, mean: 227.6 ± 30.1 s, N = 8 mice; p = 0.99, unpaired t test, two-tailed, t(14) = 0.0009; D), surveying (vehicle, mean: 542.0 ± 40.0 s, N = 8 mice; SR, mean: 483.9 ± 53.4 s, N = 8 mice; p = 0.40, unpaired t test, two-tailed, t(14) = 0.87; E), and rearing (vehicle, mean: 62.8 ± 17.9 s, N = 8 mice; SR, mean: 69.2 ± 21.8 s, N = 8 mice; p = 0.82, unpaired t test, two-tailed, t(14) = 0.23; F) were not different between vehicle-injected and SR-injected FS mice. Horizontal bars represent the means. Error bars represent ±SEM.
- Figure 4.
VP reduces STP in CRHPVN neurons from females but not males. A, EPSCs in CRHPVN neurons potentiated following HFS (gray bar) relative to baseline in aCSF control slices (green outline) and in VP-incubated slices (blue outline) from single-housed female mice stressed with FS. Inset, synaptic currents before and after HFS in aCSF-incubated and VP-incubated cells. B, STP was present in aCSF-incubated cells (mean: 152.2 ± 8.2%, n = 17 cells, p < 0.0001 vs baseline, one-sample t test, two-tailed, t(16) = 5.8), in VP-incubated cells (mean: 120.2 ± 5.7%, n = 16 cells, p = 0.002 vs baseline, one-sample t test, two-tailed, t(15) = 3.7), and in SR+VP-incubated cells (pink outline, mean: 147.5 ± 9.0%, n = 10 cells, p = 0.0007 vs baseline, one-sample t test, two-tailed). C, STP was present female aCSF mice (mean: 153.8 ± 9.4%, N = 14 mice, p = 0.0002 vs baseline, one-sample t test, two-tailed, t(13) = 5.1), in female VP mice (mean: 117.3 ± 5.9%, N = 11 mice, p = 0.005 vs baseline, one-sample t test, two-tailed, t(10) = 3.5), and in female SR+VP mice (mean: 146.8 ± 8.9%, N = 7 mice, p = 0.001 vs baseline, one-sample t test, two-tailed). D, STP (individual cells shown) was larger in aCSF-incubated cells (p = 0.007, one-way ANOVA, F(2,40) = 1.7; p = 0.008, followed by Sidak's multiple comparisons test) and in SR+VP-incubated cells (p = 0.04, Sidak's multiple comparisons test) than in VP-incubated cells. Horizontal bars represent the means. E, EPSCs in CRHPVN neurons potentiated following HFS (gray bar) relative to baseline in aCSF control slices (green outline) and in VP-incubated slices (blue outline) from single-housed male mice stressed with FS. Inset, synaptic currents before and after HFS in aCSF-incubated and VP-incubated cells. F, STP was present in aCSF-incubated cells (mean: 137.1 ± 7.6%, n = 12 cells, p = 0.0001 vs baseline, one-sample t test, two-tailed, t(11) = 5.9) and in VP-incubated cells (mean: 126.3 ± 7.9%, n = 9 cells, p = 0.009 vs baseline, one-sample t test, two-tailed, t(8) = 3.4). G, STP was present in male aCSF mice (mean: 138.5 ± 5.8%, N = 8 mice, p = 0.0001 vs baseline, one-sample t test, two-tailed, t(7) = 7.7) and in male VP mice (mean: 124.9 ± 9.2%, N = 5 mice, p = 0.04 vs baseline, one-sample t test, two-tailed, t(4) = 2.8). H, STP (individual cells shown) in aCSF-incubated cells was similar to that in VP-incubated cells (p = 0.35, unpaired t test, two-tailed, t(19) = 0.96). Horizontal bars represent the means. Scale bars (A, E) represent 5 ms and 20 pA. Inset currents (A, E) before HFS are scaled to allow for easier comparison after HFS. *p < 0.05, **p < 0.01, ***p < 0.001, ****p < 0.0001. Error bars represent ±SEM.
- Figure 5.
VP has limited electrophysiological effects on CRHPVN neurons following stress. A, Representative current-clamp recording from a CRHPVN neuron from a female mouse showing that a VP puff (100 nm, arrowhead) had no effect on the membrane potential or firing. B, C, Summary data of the effects of VP on firing frequency (baseline, mean: 1.0 ± 0.6 Hz; VP, mean: 1.1 ± 0.6 Hz; n = 5 cells, N = 4 mice; p = 0.20, t(4) = 1.5; B) and membrane potential (baseline, mean: –48.3 ± 3.7 mV; VP, mean: –48.6 ± 4.0 mV; n = 5 cells, N = 4 mice; p = 0.63, t(4) = 0.52; C) of CRHPVN neurons from female FS mice. D, Representative voltage-clamp traces from a CRHPVN neuron from a female mouse showing that bath application of VP (100 nm) had no effect on the frequency or amplitude of sEPSCs. E, F, Summary data of the effects of VP on the frequency (baseline, mean: 7.2 ± 1.8 Hz; VP, mean: 6.5 ± 1.4 Hz; n = 5 cells, N = 5 mice; p = 0.53, t(4) = 0.68; E) and amplitude (baseline, mean: 27.6 ± 4.8 pA; VP, mean: 28.3 ± 5.2 pA; n = 5 cells, N = 5 mice; p = 0.43, t(4) = 0.88; F) of sEPSCs in CRHPVN neurons. Scale bars (A) represent 5 s and 15 mV. Scale bars (D) represent 15 ms and 20 pA. Error bars represent ± SEM.
- Figure 6.
VP decreases the AMPA/NMDA ratio in CRHPVN neurons. A, The AMPA/NMDA ratio (individual cells shown with currents scaled to AMPA current in aCSF) was larger in aCSF-incubated cells (green outline, mean: 3.8 ± 0.5, n = 9 cells, N = 6 mice) than in VP-incubated cells (blue outline, mean: 2.2 ± 0.4, n = 5 cells, N = 3 mice; p = 0.04, unpaired t test, two-tailed, t(12) = 2.3) from female mice stressed with FS. Horizontal bars represent the means. Inset, AMPA and NMDA currents from aCSF-incubated and VP-incubated cells. B, The AMPA/NMDA ratio was decreased following acute application of 100 nm VP within the same cells (baseline, mean: 3.3 ± 0.7; VP, mean: 2.4 ± 0.5, n = 5 cells; p = 0.01, paired t test, two-tailed, t(4) = 4.1). Inset, AMPA and NMDA currents from the same cell before and after VP application. C, The AMPA/NMDA ratio was similar between VP-incubated cells and cells following acute VP application (VP-incubated, mean: 2.2 ± 0.4, n = 5; acute VP, mean: 2.4 ± 0.5, n = 5; p = 0.66, unpaired t test, two-tailed, t(8) = 0.46). D, Acute VP application increased isolated NMDA currents (mean: 136.8 ± 12.2%, n = 11 cells, p = 0.01 vs baseline, paired t test, two-tailed, t(10) = 3.2). Inset, traces show the NMDA current in the same cell before and after VP application. E, Acute VP application had no effect on the AMPA/NMDA ratio in cells loaded with 1 mm GDPβS (baseline, mean: 2.9 ± 0.4; VP, mean: 2.7 ± 0.3, n = 5 cells; p = 0.51, paired t test, two-tailed, t(4) = 0.72). Inset, AMPA and NMDA currents before and after VP application in a cell loaded with GDPβS. Scale bars (A, B, D, E) represent 5 ms and 20 pA. Red dotted lines (A, B, E) represent the AMPA current measurement. Gray dotted lines (A, B, E) represent the NMDA current measurement. *p < 0.05, **p < 0.01. Error bars represent ±SEM.


