

Abstract
Humans can rapidly encode information from faces to support social judgments and facilitate interactions with others. We can also recall complex knowledge about those individuals, such as their social relationships with others, but the time course of this process has not been examined in detail. This study addressed the temporal dynamics of emerging visual and social relationship information using EEG and representational similarity analysis. Participants (female = 23, male = 10) became familiar with a 10-person social network, and were then shown faces of that network's members while EEG was recorded. To examine the temporal dynamics of the cognitive processes related to face perception, we compared the similarity structure of neural pattern responses to models of visual processing, face shape similarity, person identity, and social relationships. We found that all types of information are associated with neural patterns after a face is seen. Visual models became significant early after image onset, and identity across a change in facial expression was uniquely associated with neural patterns at several points throughout the time course. Additionally, a model reflecting perceived frequency of social interaction was present beginning at ∼110 ms, even in the absence of an explicit task to think about the relationships among the network members. This study highlights the speed and salience of social information relating to group dynamics that are present in the brain during person perception.
SIGNIFICANCE STATEMENT We live our lives in social groups where complex relationships form among and around us. It is likely that some of the information about social relationships that we observe is integral during person perception, to better help us interact in differing situations with a variety of people. However, when exactly this information becomes relevant has been unclear. In this study, we present evidence that information reflecting observed relationships among a social network is spontaneously represented in whole-brain patterns shortly following presentation of a face. These results are consistent with neuroimaging studies showing spontaneous spatial representation of social network characteristics, and contribute novel insights into the timing of these neural processes.
Introduction
In a socially interconnected world, the ability to perceive and understand complex information about other people is critical. Humans rely heavily on faces to provide social information, and we can make rapid judgments about the age, sex, trustworthiness, and identity of another within a few hundred milliseconds of viewing a face (Todorov et al., 2009; Young and Burton, 2018; Dobs et al., 2019). Recently, it has been shown that information about the social connections and network positions of those we know is represented in a distributed set of brain regions, including inferior parietal, superior temporal, and medial prefrontal cortices (Parkinson et al., 2017; Morelli et al., 2018; Thornton et al., 2019). However, this work has so far not revealed how such representations unfold over time. Rapid encoding of information about the social connections of others could be critical during social interactions, as it can help us know who to trust, who might have access to resources we need, or who might be a good source of social support (Sutcliffe et al., 2012; Zerubavel et al., 2015; Feldman-Hall, 2017).
Cognitive (Bruce and Young, 1986; Barry et al., 1998), computational (Burton et al., 1990), and neuroanatomical (Gobbini and Haxby, 2007) models of person identification propose a sequential process, whereby the visual properties of faces are first analyzed to support recognition, followed by access to biographical details, such as social relationships, to aid identification. Models differ in the way that knowledge of the social relationships of an individual are stored and accessed. According to one proposal, social relationships are stored as general semantic memory, and accessed by the activation of a person-identity node (Burton et al., 1990). In contrast, others have suggested that information about the associations between people are directly linked to the representation of each individual (Barry et al., 1998; Wiese and Schweinberger, 2011). Priming presentations of social connections by viewing the face of an associate immediately before viewing a face modulates the N400 ERP, indicating that knowledge of social associations can be accessed at least within 300-400 ms (Wiese and Schweinberger, 2008, 2011). These priming effects are distinct from priming because of semantic categorization (e.g., having the same occupation), and suggest a representation of connections between people we know that is accessible in the first few hundred milliseconds of observing them. Determining how these social connections are represented, how the neural basis of the process unfolds over time, and how it interacts with the processing of individual identity, is an important step in furthering our knowledge of the neural underpinnings of person identification and social cognition. If we expect that knowledge of social relationships is stored as general semantic memory, we should see patterns of neural activity associated with these connections at ∼400 ms that are dissociated from earlier patterns of neural activity associated with identity. If, however, these social associations are more closely tied to an individual's identity, we should expect to see these patterns covary with patterns of identity earlier than 400 ms, around the time that identity itself is processed.
To examine the temporal dynamics of neural activity associated with representing social relationships, we used EEG and temporal representational similarity analysis (RSA) as participants viewed the faces of individuals from a social network. Participants first become familiar with the individuals and learned relationships between them in a naturalistic setting by viewing episodes of a television show in which the members interacted. We hypothesized that patterns of neural activity, evoked by viewing the faces of members of the network, would represent the connections between each member. Our data also allowed us to reveal how the representations of social connections evolve over time, and their relationship to the visual and nonvisual identity processing of each face.
Materials and Methods
Participants
Thirty-three right-handed adults with normal or corrected vision (10 males; age range 18-29 years; average age = 21 years; ethnicity = 47% Asian, 5% Black/African American, 16% Hispanic/Latino/a, 26% White/white, 5% Other) participated in this study. Thirty participants were sought, consistent with (or beyond) the number of participants in prior studies of temporal dynamics of face processing (Dering et al., 2011; Negrini et al., 2017; Ambrus et al., 2019; Dobs et al., 2019), and three more were collected because of overscheduling to ensure enough participants with high-quality data. They were recruited from the George Mason University psychology research participation pool, flyers posted on campus, emails, and social media posts. Participants signed a consent form in accordance with the Declaration of Helsinki and the Human Subjects Review Board at George Mason University and were compensated for their time through money or course credit.
Task design
Behavioral task
Participants watched three episodes of NBC's “Parks and Recreation” (63 min total; 21 min each) through the video streaming service Netflix. All subjects reported that they were naive viewers of the episodes on a prescreening survey before participation. Through viewing, they became familiar with a social network consisting of 10 characters. The characters in the network are friends and coworkers with varying levels of social closeness, as shown through the quantity and quality of social interaction throughout the episodes.
This method of social network exposure was chosen to be realistic to how social relationships are observed in the real world in a variety of situations. Previous studies in the authors' laboratory used a paired association learning task to familiarize participants with social networks, with frequency of face image pairing indicating closer relationships (Dziura and Thompson, 2019). Frequency of association (i.e., proximity) is highly related to social closeness but is not necessarily the same thing (Marsden and Campbell, 1984; Tarr et al., 2016), so this more naturalistic observational method was chosen to incorporate interaction quality as well as quantity.
After watching the show, participants filled out a survey where they reported several relationship characteristics among the network. These included the following: (1) how frequently each character interacted, (2) how much they like each other, (3) how similar their personalities are, and (4) based on all other factors, how close they are to each other. These four questions were used to create models of perceived social relationships to include in the analysis. We expected that the final question would yield the strongest and most relevant cue, as a measure of “closeness” is thought to be a strong indicator of relationship strength, encompassing qualities that are more complex than frequency of contact (Marsden and Campbell, 1984). All four of these models were specific to each individual subject, rather than a group average or objective measure, and therefore encompassed any individual variability associated with different perceptions of relationship strength. The questions were asked on a scale of 0 to 6 (except for the liking question, which ranged from −6 to 6) where higher numbers indicate higher/greater relationship characteristic. True interaction time for each character pair was also collected by a researcher going through the episodes and hand-coding the time (in seconds) that each character was in a scene with the other character. This included group interactions, not only the time characters directly spoke to each other one-on-one (e.g., some scenes had one character talking to several others, or a number of people all talking in sequence). This interaction time measure reflects an objective measure of relationship strength that is not created from subject-specific perceptions, and the resulting dissimilarity model tested was therefore the same for every subject. The true interaction times of character pairs ranged from 0 (they were never actually seen to interact through the three episodes) to 450 s (see Figs. 2, 3A).
EEG task
After the behavioral tasks, participants completed an EEG session where they viewed images of each of the 10 characters. Stimuli consisted of two color images of every character, each presented a total of 96 times across the entire session. The two images of each character differed in facial expression from happy or smiling with mouth open, to neutral or mouth closed. (An exception was made for one character because no recognizable high-quality images of him smiling with teeth were available. His happy image was therefore smiling with mouth closed.) All images were collected from an Internet image search, rather than by taking screenshots of the episodes, and were cropped to an oval (370 × 492 px) ranging from the top of the character's head to the chin, and including ears if they were visible. Some hair was included for some subjects, if it also fell within this oval surrounding the face. The screen background was gray (RGB = 127) with a constant white fixation dot. Each image was presented for 800 ms with a variable interstimulus interval ranging from 1000 to 1400 ms. Participants completed a 1-back task, where they pressed a button after an immediate repeat of an image (Fig. 1). This was to ensure visual attention, and neural data from the repeated images were not included in further analysis; 8000 ms rest periods were presented after every 21 images, and a self-paced break period was presented after 2 blocks to ensure that participants did not get overly fatigued and had time to rest their eyes.
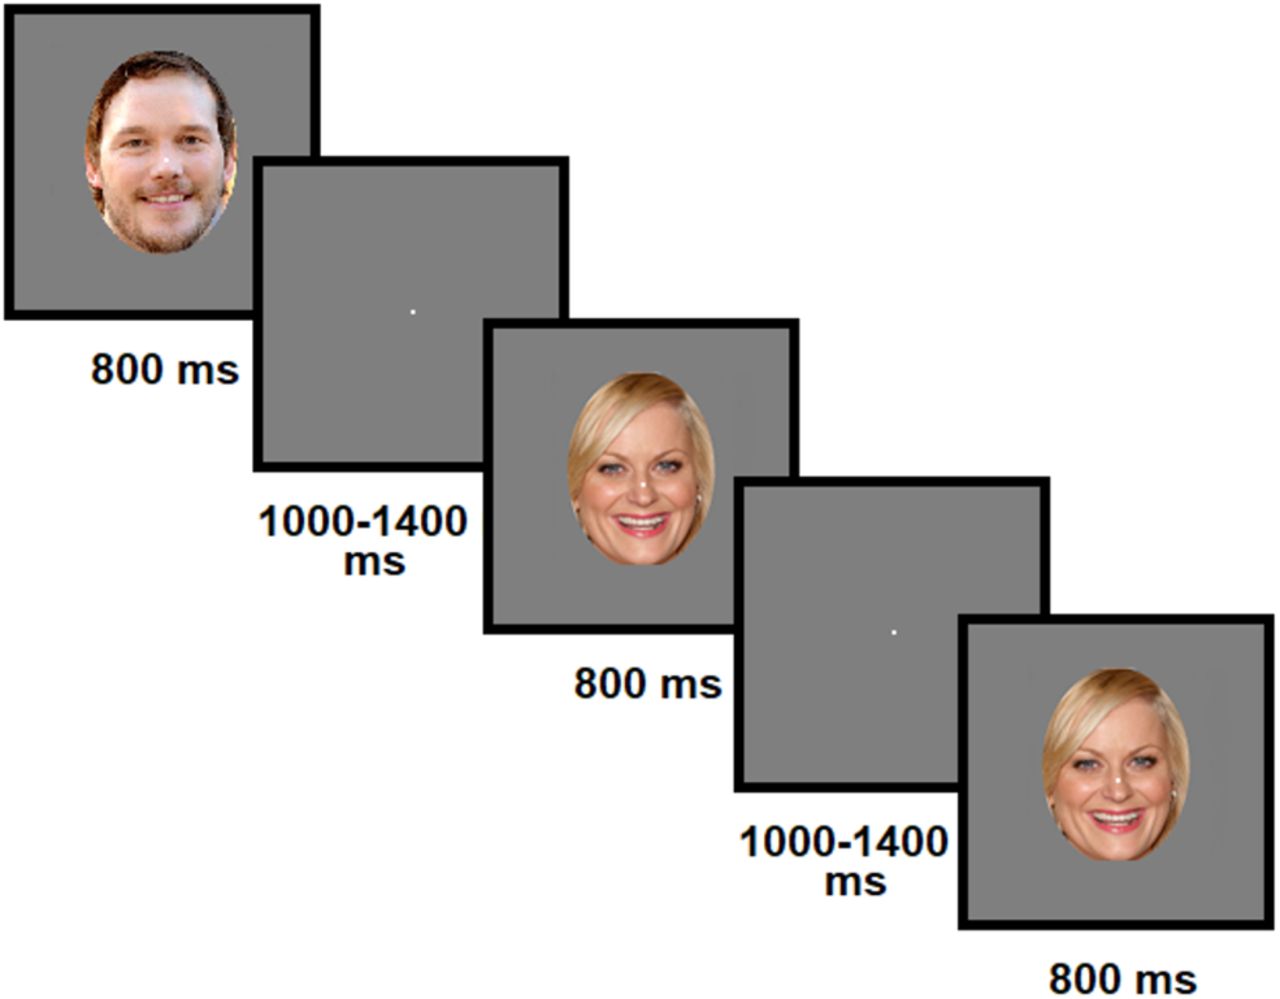
Experimental design. Faces were presented centrally one at a time while participants engaged in a 1-back task.
Data acquisition and analysis
EEG acquisition
EEG signal was recorded with 64 active Ag/AgCl electrodes (Brain Products actiCHamp system; http://www.brainproducts.com/) placed on the head according to the modified 10–20 system (American Electroencephalographic Society, 1994). Four extra channels were placed around the eyes (two near the outer canthi of each eye and two above and below the left eye) to monitor horizontal saccades and vertical eyeblinks. A final electrode was placed on the nose to use as a reference. All EEG electrode impedances were reduced to <50 kΩ before beginning the experiment, and the signals were low- and high-pass filtered online between 0.1 Hz and 249 Hz and digitized at 500 Hz.
Data preprocessing
All EEG preprocessing was completed in MATLAB R2017a (The MathWorks; https://www.mathworks.com/). Initial steps were conducted using the EEGLAB and ERPLAB toolboxes (Delorme and Makeig, 2004; Lopez-Calderon and Luck, 2014). Signals from electrodes with a high amount of noise were removed and replaced with interpolated data from surrounding electrodes. Data were bandpass filtered between 0.5 and 30 Hz using a noncausal Butterworth impulse response function to remove very low and very high frequency noise. A combination of artifact correction (using independent components analysis) and artifact rejection was conducted. Components that were (1) indicative of noise and (2) correlated with EOG channels (indicative of blinks) were selected for rejection using SASICA (Chaumon et al., 2015) and subsequently subtracted from the data. Following this, any trials remaining with EEG signal ±100 µV in any channel were removed from the data (Sawaki et al., 2015).
Data were separated into epochs ranging from −200 ms before stimulus onset to 600 ms after stimulus onset and averaged within conditions (each individual face image as conditions of interest, and a separate 1-back repeat condition that was subsequently discarded). This yielded a single datapoint for every electrode for every time point (2 ms apart) from −200 to 600 ms for each condition. Prestimulus onset data were checked to ensure that there were no significantly >0 correlations.
RSA
RSA is used to compare between-stimulus similarity across modalities that may be very different on the surface (Kriegeskorte et al., 2008). In this case, averaged ERPs from 64 scalp sites are correlated with proposed models of different types of information suspected to be involved in face perception. Dissimilarity matrix models representing three types of information were used to this end: visual properties, character identity, and social relationships (Fig. 2).

Dissimilarity matrices. All matrices represent distances across a change in facial expression for each character, where the diagonal represents the same character, rather than the same image. The first five models are identical inputs for all subjects, while the final four show subject-specific models that were converted to distances (inverted as 7 – true response) from their survey responses. The matrices in the figure are example models from a single subject. First row, Distance from the early and late layer outputs of the VGG model of visual and extrastriate cortex responses; distance between principal components in representational face space (Face Shape). Second row, Identity of the characters, with 0 on the diagonal indicating different images of the same characters and all other pairings as equally dissimilar; true interaction time (inverted as 700 – time) in seconds between each character; perceived interaction frequency between characters Third row, Perceived personality similarity among characters; perceived liking among characters; perceived closeness among characters.
Models were compared with neural distance over a sliding window of 30 ms across two different facial expressions within each character identity. The models of visual properties included distance between the first convolutional layer (“VGG-early”) and the last convolutional layer before the fully connected layers (“VGG-late”) of a convolutional artificial neural network trained on thousands of faces (VGG-Face) (Parkhi et al., 2015) and the distance of faces in face shape principal components analysis (PCA) space (“Face Shape”) (Kramer et al., 2016). We considered VGG-early as a model of early visual feature processing, while VGG-late was considered a model of mid-to-high level visual processing. The Face Shape model was created using Interface (Kramer et al., 2016) by placing 82 fiducial landmarks on each face. PCA was then performed on the set of faces, and the distance between each face in PCA space was calculated. This model reflects low dimensional representation of face shape, and has been used successfully as a model of face perception (Hancock et al., 1996; Leopold et al., 2001) and the neural processing of faces in human (Gao and Wilson, 2013) and monkey (Chang and Tsao, 2017) face-selective cortex. The early and late dissimilarity matrices created from the VGG model were correlated across layers but not identical (Pearson's r = 0.44, p < 0.001), while the Face Shape dissimilarity matrix was correlated with both the VGG-early model (r = 0.28, p < 0.05) and the VGG-late model (r = 0.37, p < 0.05). Character identity was modeled as either the same (0) or different (1) across the two images of each character (Vida et al., 2016). The social relationship between each character was quantified using the four within-subject responses to a questionnaire administered after the video viewing portion (interaction frequency, personality similarity, liking, and closeness). Finally, an objective social relationship model based on the true interaction time between each character was created. Unlike the social network survey models (which were created from subject-specific responses), this was identical across all subjects because they all watched the same episodes.
To compare the contribution of each model to EEG pattern similarity during face perception, we performed partial Spearman's correlations, in which we correlated the rank-ordered distance in EEG patterns within each 30 ms sliding window from each face to the rank-ordered distance in each model response to the same faces, partialing out the contribution of other, related models, for each participant separately. To supplement these analyses, we performed variance partitioning using custom MATLAB scripts to illustrate the unique and shared variance across the various models (Kerlinger and Pedhazur, 1973; Peres-Neto et al., 2006; Groen et al., 2018). Multiple rank-ordered regression analysis was performed at each 30 ms window for each participant separately, with rank-ordered distance between EEG patterns to each face first regressed onto all eight models (three visual, one identity, and four social) to obtain a full model-adjusted R2 time series, adjusted for bias using the formula of Zar (1999). Subsequent regressions comprised of different combinations of models (e.g., visual models and the identity model vs identity alone) were performed, with the adjusted R2 from these models used to estimate unique and shared variance, using the partitioning procedures described by Legendre (2019).
Statistical analysis
The CoSMoMVPA toolbox was used for group-level statistical analysis of RSA model comparison analyses. Individual subject-level partial correlation model results were entered into a group-level Monte Carlo random effects estimation (10,000 iterations), and multiple comparisons were corrected for using threshold-free cluster enhancement (TFCE) with a temporal neighborhood (Smith and Nichols, 2009). p values were computed by dividing (r + 1)/(niter + 1), where r denotes the number of times that the original data were less than the null (North et al., 2002). Models were considered significantly associated with neural patterns overall if the test returned a corrected p value < 0.05, and individual time windows were considered significant at a corrected value of z > 1.65.
Results
Survey results
The social network survey yielded pairwise measures of perceived interaction frequency, liking, personality similarity, and closeness. All measures were significantly correlated with each other (Table 1). Through these measures, weighted networks were created for each subject with varying degrees of relationship strength among members. Every character was connected to every other character, as they are all presumed to know each other. However, within the three episodes, some characters interact much more often than others (Fig. 3A), and relationships are therefore shown to develop more strongly among some members compared with others. The time in seconds that each character spent interacting across the three episodes ranged from 0 to 450 and yielded a network (Fig. 3C) with density of 63.2 and eigenvector centralization index of 79%. Participants were highly accurate at perceiving these interactions, as the network gathered from the individual survey responses of interaction frequency was highly correlated with the true interaction time (r = 0.87, p < 0.001; Fig. 3B). This network ranged on average from 0.6–5.6 (scale of 0–6), with a density of 2.2 and eigenvector centralization index of 32%.
Social network survey measuresa

Social network character interaction information. A, Histogram represents the distribution of times the characters spent interacting. B, Correlation between the true time characters spent interacting and the group average perceived frequency of interaction. C, Network map using true interaction time as connection weight. D, Network map using the group average perceived interaction frequency rating as connection weight.
ERPs
As all EEG data were collected in response to face stimuli, we did not conduct any significance tests relative to a nonface control. However, the N170 face effect has been well documented (Bentin et al., 1996; Rossion, 2014), and we therefore expected to see large negative deflections at ∼150-200 ms for our stimuli. We were also particularly interested in the time at ∼100 ms, important for visual perception and potentially sensitive to faces (Liu et al., 2002; Dering et al., 2011; Colombatto and McCarthy, 2017) and 250 ms, another time period linked to differences in face perception (Huang et al., 2017). Figure 4 shows example ERP data averaged across the entire group. At a temporoparietal electrode where we might expect to see face-relevant activity, there are characteristic positive and negative deflections at ∼100 and 170 ms, respectively (Fig. 4B). These images also show minor differences in the three waveforms for each chosen face stimulus, which suggests that there are potential meaningful differences in the data related to each individual face. The subject-specific waveforms from these data were subsequently used in RSA models to examine the representational relationships among the faces.

ERP data output. Example ERP data from an image of three different characters in the network, averaged across all subjects. A, The 64-channel scalp maps at three times thought to be relevant to face processing (100, 170, and 250 ms). B, Waveform images from a right temporoparietal electrode.
RSA model comparison
As there were multiple models representing different aspects of visual processing, we first conducted a correlation analysis to determine whether any or all of the visual models contributed unique information to EEG patterns. Partial correlation analyses with EEG pattern similarity were conducted for each of the VGG-early layer, VGG-late layer, and the Face Shape model, controlling for each of the other visual models. As there were also multiple models representing different aspects of social connection, we conducted similar analyses to determine whether any or all of the social models contributed unique information to the EEG patterns. For this, partial correlation analyses with EEG pattern similarity were conducted for each of the models resulting from the four social network survey questions. The first of these analyses only controlled for the three visual models, and the second controlled for the three visual models and each of the other social survey models. We hypothesized that the closeness model would be significant above and beyond the other three models, as this is thought to be a strong indicator of relationship strength, encompassing a number of underlying qualities, such as frequency of contact, liking, and similarity (Marsden and Campbell, 1984; Tarr et al., 2016).
All three visual models made unique contributions to the similarity of patterns of EEG responses to the different faces (Fig. 5A). Dissimilarity in the output of each of the visual models to each face was significantly correlated with EEG pattern similarity to each face. The VGG-early model showed the earliest significant correlation with EEG pattern similarity (64-162, 198-220 ms), consistent with this model representing early visual processing. In contrast, the VGG-late model, a model of mid-to-high level vision, showed significant correlation for much of the first 500 ms of EEG responses (80-122, 128-178, 230-238, 276-348, 364-410, 492-502 ms). The Face Shape model showed unique correlation with EEG pattern similarity at ∼100 ms after face onset (112-130 ms). The significance of all three models suggests that each reflects slightly different properties of visual face perception.

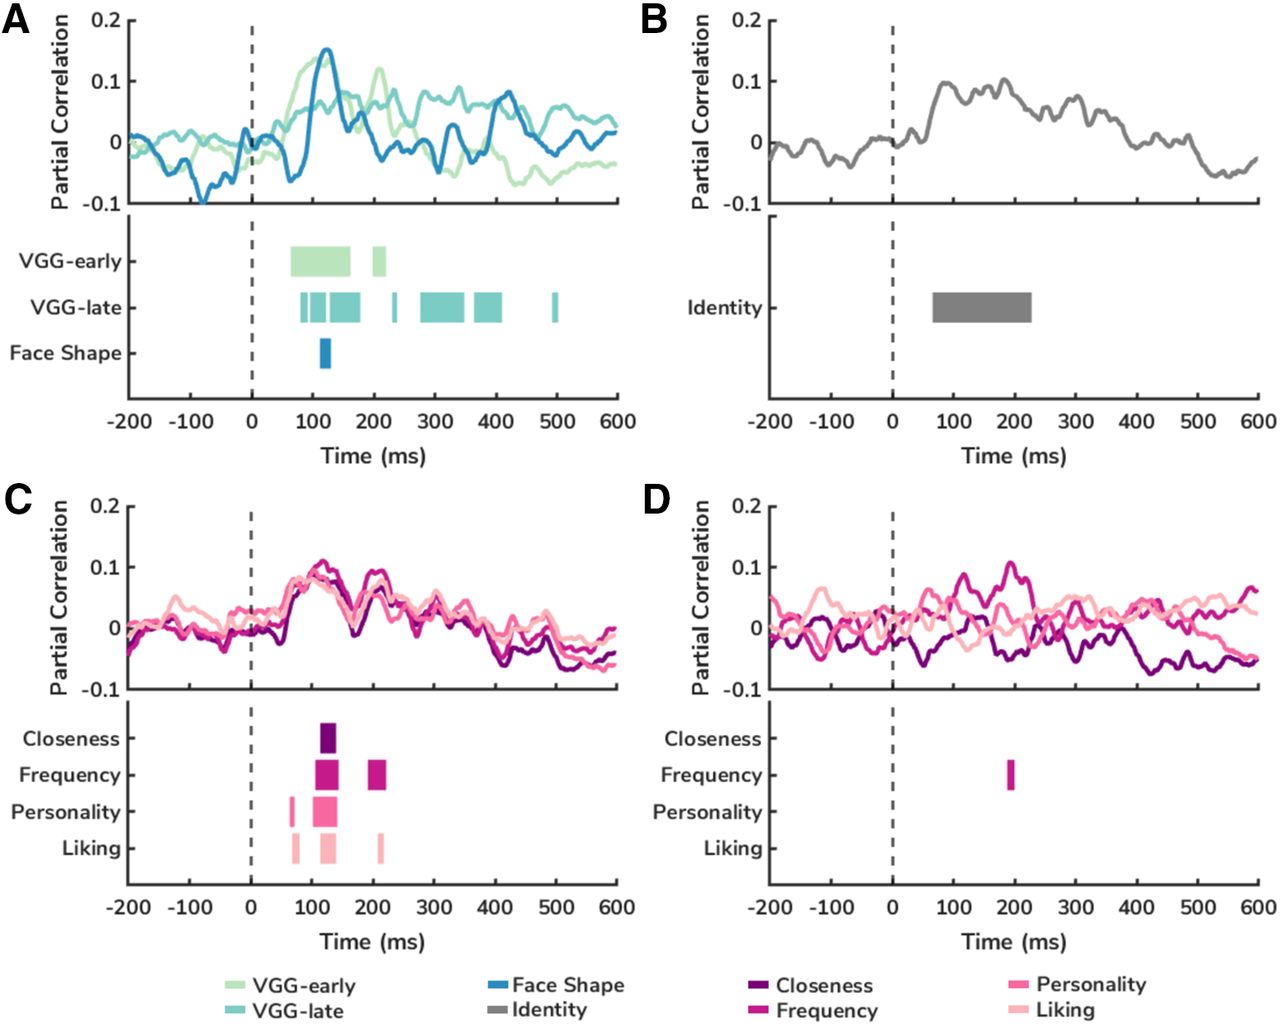
Model comparisons. Time course of model correlations with EEG pattern similarity to faces from −200 to 600 ms after stimulus onset, controlling for other models. Top, Mean partial correlation, averaged across participants. Bottom, Time course of each significant cluster (TFCE-corrected p < 0.05). A, Mean partial correlations with EEG pattern similarity for VGG-early, VGG-late, and Face Shape models, controlling for the other visual models. B, Mean partial correlation with EEG pattern similarity for the identity model, controlling for the three visual models. C, Mean partial correlation with EEG pattern similarity for each of the four social connection models, controlling for the three visual models. D, Mean partial correlations with EEG pattern similarity for each of the four social connection models, controlling for visual models and the three other social models.
We observed that cross-expression EEG pattern similarity to the faces was significantly correlated with the identity model after controlling for the three visual models. This model showed a sustained association from before 100 ms until after 200 ms (66–228 ms) following face onset (Fig. 5B). We also observed significant correlations between each of the four social connection models and EEG pattern similarity in the first 100–200 ms (Closeness: 114–140 ms; Frequency: 106–220 ms; Personality: 64–72, 102–142 ms; Liking: 68–80, 114–218 ms) following face onset, after controlling for the three visual models (Fig. 5C). All four social connection models showed very similar time courses of association with EEG pattern similarity, consistent with the high correlation between each of the social models. When we examined the unique contribution of each of the social connection models, controlling each of the three other social models as well as visual information, we observed that only the model representing the perceived frequency of interaction contributed unique variance in the pattern of EEG responses to the faces (188–200 ms) (Fig. 5D). This was contrary to our hypothesis that the social closeness model would be the strongest, and indicates that observed quantity time spent together is a particularly important social signal. We also ran partial correlations to determine whether this model was significantly different from the true interaction time model, and it was not, suggesting that individual perception of social interactions is actually quite accurate (true interaction time controlling for perceived interaction frequency p = 0.064/perceived interaction frequency controlling for true interaction time p = 0.13).
To illustrate the relative contribution and overlap of different models to the variance in EEG pattern similarity, we performed a variance partitioning analysis. A full model (consisting of all three visual models, the identity model, and the four social connection models) on average explained a bias-adjusted maximum of ∼11%–12% of the variance in EEG pattern similarity (Fig. 6A–C), peaking from 100 to 200 ms following face onset. Much of the explained variance in the similarity of EEG patterns in this peak came from the visual models (Fig. 6A). Overlap between the visual models and the identity model was also observed in the first 100-200 ms (Fig. 6A), with a small degree of overlap between the visual models and the social connection models also observed in the same period (Fig. 6B). Consistent with what was found with the partial correlation analyses of the social connection models, we observed that all four models showed overlapping contributions to explained variance in EEG pattern similarity at ∼100 ms after face onset, with a small peak in the unique contribution of the perceived frequency of interaction model at ∼200 ms (Fig. 6C).

Model variance partitioning. Time course of variance (adjusted R2) of EEG pattern similarity explained by all models (Full Model), and the shared and unique variance of reduced models. A, Time course of variance of EEG pattern similarity explained by visual models, identity model, and the intersection of visual and identity models. B, Time course of variance of EEG pattern similarity explained by visual models, social models, and the intersection of visual and social models. C, Time course of variance of EEG pattern similarity explained by the four different social models, and the sum of all intersections of the four social models.
The above analyses show that both identity and social connection representations contribute to the similarity of patterns of EEG responses to faces in the first 200 ms following face onset, above and beyond the contribution of visual information. To further disentangle the relationship between identity and social connection representations, we performed additional partial correlation analyses that examined the unique contribution of each model to EEG pattern similarity. Significant correlation between the identity model and EEG responses, controlling for visual models and perceived interaction frequency, was observed (156-188 ms) following face onset (Fig. 7A). Additionally, perceived interaction frequency was significantly correlated with EEG responses, after controlling for visual and identity models, for a brief period (116–126 ms). Variance partitioning analysis revealed shared variance between identity and perceived interaction frequency immediately before this time (∼100 ms) when shared variance with visual models was not controlled for (Fig. 7B). When variance explained by visual models was included in the analysis, the shared variance between identity and perceived interaction frequency was diminished, indicating the importance of visual information during this time period (Fig. 7C).

Identity and frequency model correlations and variance partitioning. A, Time course of mean partial correlation with EEG pattern similarity (top) and significant (TFCE-corrected p < 0.05) clusters (bottom) for the identity model, controlling for visual and perceived interaction frequency models, and the perceived interaction frequency model, controlling for visual and identity models. B, Variance of EEG pattern similarity explained by the identity model, perceived interaction model, and their intersection. C, Variance of EEG pattern similarity explained by the models in B plus the variance shared between these and the visual models.
Discussion
This study examined the neural timing of the representation of familiar faces who were part of the same social network. Consistent with previous EEG/MEG research (Vida et al., 2016; Ambrus et al., 2019; Dobs et al., 2019), visual and identity information was present in neural patterns across the whole brain after image presentation. We also found that information reflecting social connections is uniquely present in these whole-brain patterns of EEG responses. Our data indicate that social information content is actually reflected in neural patterns very early after a face is seen, around the same time as patterns of visual information. Unique representations of identity are also present in the patterns of EEG responses, at this early time point and after the early representations of social information. A more direct comparison of these two types of information suggest that the representations of social connections that a person has are closely tied to that person's identity, particularly in neural responses at ∼100–200 ms after face onset.
Priming of a face by known associates of an individual has been previously been reported to modulate the N400 ERP (Wiese and Schweinberger, 2008, 2011). Our data suggest that neural representations of associations between individuals who belong to the same social network are encoded as early as ∼100 ms after first viewing the face. The speed at which this process happens has implications for a number of potential behaviors. The more quickly we understand the purpose of another's actions, the better able we are to react immediately in uncertain or dangerous situations. A recent study indicated that individual characteristics of a face, such as gender and age information, is encoded early in the neural response to faces, and that familiarity of faces boosts these representations even before 100 ms, indicating that prior conceptual knowledge about a person can affect initial visual processing of that person (Dobs et al., 2019). It has also been shown that information acquired from faces can give near-instantaneous cues toward conspecific threats (Öhman, 1986). Negative emotions present in faces have been linked to increased early visual attention at ∼120 ms, similar in timing to neural responses to images of snakes, which are thought to be evolutionarily relevant (Langeslag and Van Strien, 2018). Social information, such as trustworthiness, is also automatically tracked when a face is seen, even in the absence of an explicit judgment task, and these traits may be fully processed by 100 ms (Willis and Todorov, 2006; Engell et al., 2007; Todorov et al., 2009). Our results show not only that the social information gathered from faces includes representations of connections between people, but that this process happens in concert with visual perception, and nearly at the same time as unique representations of identity. Because of how rapidly these patterns occur, it could suggest that this type of social information contributes to the process of face recognition and person identity processing. Similar to knowledge (or perceptions) about trustworthiness, knowledge about social associations may be able to aid in rapid judgment processes. For example, if we understand the connections between people in social groups, we can more easily trust or rely on critical information that has been passed among certain group members compared with others.
Furthermore, these data suggest that social connections are not stored only as general semantic memory that is accessed following the initial activation of a person-identity node representation, but instead might contribute directly to the representation of that individual identity. If these connections were explicitly recalled from memory after the activation of a person-identity node, we would have expected to see associated patterns of neural activity later in the EEG time course, following patterns of identity (Wiese and Schweinberger, 2008, 2011). Instead, we find evidence of early neural representation of information about the social connections of a face, even as representations of identity are unfolding in neural activity. These data, as well as that from studies, such as Dobs et al. (2019), suggest that, during an initial sweep of neural activity, a range of social information associated with an individual face is activated. A recent fMRI study showing that different face patches encode distinct identity traits, and that the fusiform face area encodes a number of social traits, also support these EEG/MEG results (Tsantini et al., 2020). This information appears to then converge into an integrated representation of identity. Importantly, the neural patterns we observed that were related to information about the social networks of different faces were elicited without explicit directions to think about the identities or social connections among the characters. This strengthens evidence from previous studies that show spontaneous neural coding of network characteristics within participants' own social networks (Parkinson et al., 2017). The social functional theory of face processing posits that attention is naturally allocated to the most relevant cues, which in the case of the human perceptual system, includes social information (Adams et al., 2017). This would suggest that these cues about social connections among people are indeed highly relevant to encode.
The divergence between the interaction frequency models and other measures of social relationships could reflect a difference between quantity (time spent interacting among people) and quality (how the people actually feel about those interactions). Our data indicate that perceived interaction frequency is uniquely present both when compared with the other measures of social relationships and when compared with other nonsocial models of face information. This might be a more stable and therefore reliable cue of observed relationships, as opposed to other measures, which could vary in definition among subjects. It may be difficult to accurately observe “closeness” among relationships where a person is not actually a partner and cannot directly ask either of the partners. However, the social network learning task was brief compared with observations of social interactions that people might generally have among groups in the real world. Social network research suggests that there is likely a difference between personally relevant social connection information (e.g., the relationships among kin or close friends) and nonpersonal social connection information (e.g., these relationships among acquaintances or even friends of friends) above and beyond mere stimulus familiarity (Gobbini et al., 2004; Krienen et al., 2010; Keyes and Zalicks, 2016; Wlodarski and Dunbar, 2016; Thornton and Mitchell, 2017; Wiese et al., 2019). With either more observation time, or more personal relevance to the groups observed, the other social relationship measures may prove to be as strong or stronger than mere observed interaction frequency. This may also boost the representations of identity, as previous studies have found longer significant identity associations, even after controlling for other types of information (Ambrus et al., 2019; Dobs et al., 2019; Wiese et al., 2019). Further research is needed to examine the differences between neural representations of quantity time observed (familiarity) and potentially more meaningful qualities of a relationship in the context of larger interconnected social groups.
Different types of visual information are represented by the first 100 ms after face images are presented. The differences between the VGG and Face Shape models might reflect the more local processing of visual features, whereas the PCA space model reflects the contribution of shape features, including global shape. The early neural representation of the visual similarity of faces is consistent with prior literature showing MEG and EEG responses to face stimuli at this time (Seeck et al., 1997; Schendan et al., 1998; Liu et al., 2002). Other recent work has highlighted the role of surface texture on the neural representation of face identity (Nemrodov et al., 2018, 2019). Surface features and invariant shape properties might be expected to contribute to (dis)similarity in low-level models and/or face space (Johnston et al., 1997), although clearly these models do not capture the entirety of early representations of face identity.
A significant part of a person's identity relates to social connections we form among others in groups. People often self-select into different groups or use group categorizations to form their own identities (Amiot and Aubin, 2013), and our identity is in turn often shaped by the people with whom we surround ourselves (Van Veelen et al., 2013; Vivona, 2013; Guo and Li, 2016). How these in-group connections interact with each other and relate to the individual identities that make up the group, as well as how they are learned and represented by those outside the group, is important to understand for people living in a social world.
Footnotes
We thank Craig McDonald and Martin Wiener for providing critical input when designing this project; and Leo Chase, Colleen Flanagan, Clara Glagola, Michael Norton, and Claudia Torresi for data collection assistance.
The authors declare no competing financial interests.
- Correspondence should be addressed to Sarah L. Dziura at sdziura{at}umd.edu


