

Abstract
P2X7 receptors (P2X7Rs) are associated with numerous pathophysiological mechanisms, and this promotes them as therapeutic targets for certain neurodegenerative conditions. However, the identity of P2X7R-expressing cells in the nervous system remains contentious. Here, we examined P2X7R functionality in auditory nerve cells from rodents of either sex, and determined their functional and anatomic expression pattern. In whole-cell recordings from rat spiral ganglion cultures, the purinergic agonist 2',3'-O-(4-benzoylbenzoyl)-ATP (BzATP) activated desensitizing currents in spiral ganglion neurons (SGNs) but non-desensitizing currents in glia that were blocked by P2X7R-specific antagonists. In imaging experiments, BzATP gated sustained Ca2+ entry into glial cells. BzATP-gated uptake of the fluorescent dye YO-PRO-1 was reduced and slowed by P2X7R-specific antagonists. In rats, P2X7Rs were immuno-localized predominantly within satellite glial cells (SGCs) and Schwann cells (SCs). P2X7R expression was not detected in the portion of the auditory nerve within the central nervous system. Mouse models allowed further exploration of the distribution of cochlear P2X7Rs. In GENSAT reporter mice, EGFP expression driven via the P2rx7 promoter was evident in SGCs and SCs but was undetectable in SGNs. A second transgenic model showed a comparable cellular distribution of EGFP-tagged P2X7Rs. In wild-type mice the discrete glial expression was confirmed using a P2X7-specific nanobody construct. Our study shows that P2X7Rs are expressed by peripheral glial cells, rather than by afferent neurons. Description of functional signatures and cellular distributions of these enigmatic proteins in the peripheral nervous system (PNS) will help our understanding of ATP-dependent effects contributing to hearing loss and other sensory neuropathies.
SIGNIFICANCE STATEMENT P2X7 receptors (P2X7Rs) have been the subject of much scrutiny in recent years. They have been promoted as therapeutic targets in a number of diseases of the nervous system, yet the specific cellular location of these receptors remains the subject of intense debate. In the auditory nerve, connecting the inner ear to the brainstem, we show these multimodal ATP-gated channels localize exclusively to peripheral glial cells rather than the sensory neurons, and are not evident in central glia. Physiologic responses in the peripheral glia display classical hallmarks of P2X7R activation, including the formation of ion-permeable and also macromolecule-permeable pores. These qualities suggest these proteins could contribute to glial-mediated inflammatory processes in the auditory periphery under pathologic disease states.
Introduction
The specific localization of ATP-gated P2X7 receptors (P2X7Rs) has been the subject of considerable debate within the context of neuro-glial signaling, with contradictory evidence supporting their presence in either neurons or glia (Illes et al., 2017; Miras-Portugal et al., 2017). Uncertainty has risen, in part, because of the limited specificity of existing pharmacological agents, antibodies, and availability of animal models (Bartlett et al., 2014). The development of alternative mouse models that define the cellular localization and functionality of P2X7Rs is demystifying this area of research (Kanellopoulos and Delarasse, 2019). New mouse lines have, for example, added evidence supporting P2X7R expression in central neurons (Engel et al., 2012; Jimenez-Pacheco et al., 2013; Metzger et al., 2017). However, a recent study generated transgenic mice in which functional EGFP-tagged P2X7 protein could be visualized in vivo, and concluded that neurons do not express detectable P2X7Rs (Kaczmarek-Hajek et al., 2018). In that study, quantitative molecular approaches determined that detectable amounts of P2X7Rs localize exclusively to glial cells in both the central nervous system (CNS) and peripheral nervous system (PNS).
The auditory nerve transmits acoustic information from mechano-sensory hair cells to the brainstem. Individual auditory nerve fibers thus cross the division between the PNS and CNS, and in doing so they afford us an opportunity to examine region-specific specializations in neuro-glial interactions within a single sensory modality. A specific “glial transition zone” between the PNS and CNS occurs within the cochlear modiolus (Knipper et al., 1998), where the Schwann cells (SCs) hand over homeostatic duties to oligodendrocytes (OGDs). Whether the auditory glial cells in the PNS and CNS have distinct physiological properties is currently unknown. Such insights could increase the accuracy and validity of models of auditory nerve function in health and disease, resulting in (1) improved interpretations of auditory neuropathies, (2) the identification of therapeutic targets, and (3) design refinements for implantable devices.
Primary afferent coding of auditory stimuli may be the subject of modulation via various metabotropic and ionotropic receptors (Dulon et al., 2006). During both auditory development and mature function there is extensive evidence for purinergic neuromodulation involving metabotropic P2YRs and ionotropic P2XRs (Tritsch et al., 2007; Housley et al., 2009; Ito and Dulon, 2010). Studies have detected mRNA and/or protein for P2Y1, P2Y2, P2Y4, P2X2, P2X3, and P2X7 subunits within cells of the spiral ganglion (Brändle et al., 1999; Housley et al., 1999; Nikolic et al., 2003; Huang et al., 2005, 2010; Greenwood et al., 2007). Specific roles for P2YRs within auditory nerve physiology remain undetermined. In spiral ganglion neurons (SGNs), the primary afferent units of the auditory nerve, P2X2 and P2X3 subunits form hetero-multimeric assemblies during the prehearing period in rats, resulting in receptors with specific physiological characteristics and pharmacology (Salih et al., 2002). These receptors may contribute to the regulation of neurite outgrowth and branching in SGNs (Greenwood et al., 2007). P2X2 subunits localize to the postsynaptic boutons of SGNs in the mature cochlea of the guinea pig (Housley et al., 1999), and P2rx2-null mice display increased vulnerability to noise and hearing loss attributed in part to the degeneration of the afferent boutons (Housley et al., 2013).
The contribution of P2X7Rs to cochlear function remains less clear. In recent years, this enigmatic receptor has been the focus of increasing attention in other tissues, particularly given its supposed roles in pathologic cell-death pathways, tissue inflammation and neurodegenerative conditions (Sperlágh and Illes, 2014; Jimenez-Mateos et al., 2019; Kanellopoulos and Delarasse, 2019). In this study, we examined the auditory nerve of mice and rats, including the peripheral portion extending from the inner hair cell (IHC) afferent synapse to the glial transition zone, and the central portion that extends toward the brainstem. Our data, accumulated from a variety of experimental approaches, point to functional expression of P2X7Rs exclusively by glia in the peripheral portion of the auditory nerve.
Materials and Methods
Rats and wild-type mice
Animal handling and experimental procedures were approved by the University College London Animal Welfare and Ethical Review Body (14 798), and conformed to United Kingdom legislation outlined in the Animals (Scientific Procedures) Act 1986. Sprague Dawley rats and C57BL/6 mice obtained from Charles River were bred within in-house facilities. Animals were fed standard chow and housed under a 12/12 h light/dark cycle, with room temperature maintained at 19–23°C and humidity at 55 ± 10%. Cages were lined with sawdust and cleaned at least once a week. Cages were enriched with a wooden chew block, a cardboard nesting house and cotton pad nestlet. Animals of either sex were killed by cervical dislocation followed by decapitation, or by CO2 inhalation and decapitation.
Transgenic mice
Animal handling, experimental procedures and generation of transgenic mouse lines were performed in accordance with German and European Union guidelines and were approved by the States of Lower Saxony (33.9-42502-04-12/0863) and Upper Bavaria (55.2-1-54-2532-59-2016). The Tg(P2rx7-EGFP)FY174Gsat mouse reporter line, which expresses soluble EGFP driven from the P2rx7 promoter, was obtained from the Gene Expression Nervous System Atlas (GENSAT; www.gensat.org) database of engineered mouse strains (Schmidt et al., 2013). The generation of the transgenic mouse line BL/6N-Tg(RP24-114E20P2X7451P-StrepHis-EGFP) 17, which overexpresses P2X7 subunits C-terminally fused to EGFP (“P2X7-EGFP”) in vivo, was described previously (Kaczmarek-Hajek et al., 2018). Mice of either sex were killed by isoflurane inhalation followed by decapitation.
Cell culture
Cochlear modioli were dissected from rats and digested enzymatically with 0.25% trypsin for 30 min at 37°C. The tissue was triturated in growth medium [DMEM supplemented with 10% fetal calf serum (FCS), 10 mm HEPES, N2 (1:100 dilution), 15 mm glucose, and 1% penicillin/streptomycin], pelleted by centrifugation at 200 RCF for 3 min, and re-suspended in growth medium. Cells were plated onto coverslips (precoated with poly-L-lysine, 50 μg/ml) before being left for 1 h to adhere in a humidified incubator at 37°C with 5% CO2, then growth medium supplemented with 8 ng/ml brain-derived neurotrophic factor (BDNF), 8 ng/ml NT3, and 50 ng/ml LIF (Sigma-Aldrich) was added to each well. Cell cultures were maintained at 37°C with 5% CO2 for up to 3 d in vitro (DIV).
Experimental solutions and drugs
Electrophysiology and imaging experiments to assess P2X7R activation in cultured cells were conducted in normal artificial perilymph (AP; containing the following: 145 mm NaCl, 4 mm KCl, 1.3 mm CaCl2, 1 mm MgCl2, 10 mm HEPES, and 5 mm glucose, pH 7.3), low-divalent AP (LDAP; containing the following: 145 mm NaCl, 4 mm KCl, 0.3 mm CaCl2, 10 mm HEPES, and 5 mm glucose, pH 7.3), or zero-divalent AP (ZDAP; containing the following: 145 mm NaCl, 4 mm KCl, 10 mm HEPES, and 5 mm glucose, pH 7.3). The purinergic agonist 2',3'-O-(4-benzoylbenzoyl)-ATP (BzATP; Tocris Biosciences) was stored at −20°C as a 5 mm stock solution in water and diluted to working concentration on the day of use. The P2X7R-specific antagonists A-740003 (Sigma-Aldrich) and JNJ47965567 (Tocris Biosciences) were prepared as 10 mm stocks (in DMSO), and diluted in AP to working concentration on the day of use (0.01% DMSO).
Electrophysiological recordings
Whole-cell patch-clamp recordings were performed at room temperature from glia maintained 1–3 DIV. Cells grown on coverslips were visualized during recordings using a BX51WI microscope (Olympus). A MultiClamp 700B amplifier (Molecular Devices) was used in combination with pClamp software (version 8, Molecular Devices). The recording chamber was super-fused with AP or LDAP using a peristaltic pump. LDAP contained low Mg2+ and Ca2+ concentrations to minimize inhibition of purinergic currents (Surprenant et al., 1996; Yan et al., 2011). A vertical puller (PC-10, Narishige) was employed to produce patch pipettes from capillary glass (GC120TF, Harvard Apparatus). Patch pipettes were filled with an intracellular solution (containing the following: 140 mm KCl, 2 mm MgCl2, 5 mm EGTA, and 5 mm HEPES, pH 7.3), and had resistance of 2.4–3.6 MΩ when measured in the bath. Data were not corrected for the estimated liquid junction potential of −4 mV. Drugs were applied locally via picospritzer directed at the patched cell at a distance of 50–100 μm (BzATP), or by whole-bath perfusion (antagonists). Data were analyzed offline using Clampfit software (version 10.6, Molecular Devices) and OriginPro 2016 software (OriginLab).
Calcium imaging
Changes in intracellular Ca2+ concentration ([Ca2+]i) were measured using fura-2 imaging (Grynkiewicz et al., 1985). Spiral ganglion primary cultures from postnatal day (P)5 to P11 rats were loaded with the AM ester of fura-2 (5 μm, with 0.01% pluronic and 0.01% DMSO, each w/v) in DMEM/F-12 for 25 min at 37°C and 5% CO2. Following loading, cultures were washed three times over a period of 5 min in AP or LDAP and left to equilibrate for a further 20 min to allow for the complete cleavage of the AM ester. Fluorescence images were acquired as described previously (Lahne and Gale, 2008), using an inverted microscope (Axiovert S100 TV, Carl Zeiss) equipped with a 20× Fluar objective (NA 0.75) and a 12-bit cooled CCD camera (PCO Sensicam, Pulse Photonics) under the control of Andor iQ 1.5 software (Oxford Instruments). Differential interference contrast (DIC) images were acquired before the fluorescence measurements, with a frame size of 1280 × 1024 pixels (full frame, 1 × 1 binning) and 12-bit depth. Fura-2 AM fluorescence was excited alternatively at 340 nm (Ca2+-bound) and 380 nm (Ca2+-free) by means of a fast-switching monochromator (Kinetic imaging). Fluorescence was collected using a 500 nm dichroic mirror and a 510 nm long-pass filter. The standard protocol consisted of 600 image frames of 320 × 256 pixels (4 × 4 binning), and 12-bit depth. Agonists were applied manually into the bath. Data were analyzed in ImageJ, and DIC images were used as a reference to classify cell types. Regions of interest (ROIs) were only drawn on cells with glial-like morphology, and that remained within the imaging frame for the duration of the experiment. The fura-2 emission ratio (F340/380) was calculated and plotted using OriginPro 2016.
YO-PRO-1 uptake
The formation of large membrane pores was assessed by the cellular uptake of the 376 Da cell-impermeant propidium dye YO-PRO-1 (Virginio et al., 1999). Experiments were conducted with 1 μm YO-PRO-1 in LDAP, and agonists/antagonists were applied manually into the bath. ROIs were only drawn on cells with glial-like morphology, and that remained within the imaging frame for the duration of the experiment. YO-PRO-1 fluorescence (F, arbitrary units) was collected using the LSM510 laser scanning confocal microscope (488-nm laser, 500-nm long pass emission, Carl Zeiss), and analyzed as a function of experimental time using OriginPro 2016.
Antibodies
The rabbit polyclonal anti-P2X7 antibody (Alomone APR-004) used in this study targets a peptide (KIRKEFPKTQGQYSGFKYPY) corresponding to amino acid residues 576–595 of the rat P2X7 subunit. This antibody was knock-out-validated using Western blottings of mouse neutrophils (Karmakar et al., 2016) and immunofluorescence of mouse microglia (Fischer et al., 2014). Here, the specificity of the antibody was confirmed in control experiments by its preabsorption with an antigen peptide provided by the manufacturer. Peptide block resulted in a total loss of immunofluorescence from cochlear tissues. The generation of the P2X7-specific nanobody based antibody construct (7E2-rbIgG) from the llama-derived 7E2 nanobody (Danquah et al., 2016), and its validation using immunocytochemistry in wild-type and P2rx7 knock-out mouse brain are both described elsewhere (Kaczmarek-Hajek et al., 2018). Other primary antibodies used in this study: mouse monoclonal (IgG2A) anti-βIII-tubulin, Covance MMS-435P, 1:500; rabbit polyclonal anti-S100, Dako Z0311, 1:500; goat polyclonal anti-Sox10, Santa Cruz Biotechnology sc-17342, 1:50; mouse monoclonal (IgG2A) anti-ankyrin-G, NeuroMab N106/36, 1:100; mouse monoclonal (IgG1) anti-Caspr, NeuroMab K65/35, 1:100; chicken polyclonal anti-GFP, ThermoFisher A10262, 1:400; rabbit polyclonal anti-GFP, Abcam AB556, 1:2000; mouse monoclonal (IgG2A) anti-peripherin, Santa Cruz Biotechnology sc-377093, 1:100; mouse monoclonal (IgG1) anti-synaptophysin, Santa Cruz Biotechnology sc-11750, 1:100. Alexa Fluor-tagged secondary antibodies targeting particular species/isotypes were diluted at 1:400 (ThermoFisher). In control experiments, primary antibodies were omitted to ensure the secondary antibodies alone did not label tissues.
Confocal and airyscan fluorescence microscopy
To examine EGFP expression and for immunofluorescence, whole cochleae or adherent cultured cells on coverslips were fixed using 4% paraformaldehyde (PFA) in PBS for 1 h at room temperature. In whole cochleae, a small hole was pierced in the apical region of the otic capsule to facilitate perfusion of PFA into the tissues. Fixed cochleae or cells were washed in PBS and stored at 4°C. Cochleae were mounted in 4% agarose and sectioned at 200-μm intervals using a vibratome (1000 plus system, Intracel). For the antibody incubations, sections or coverslips with adherent cultured cells were permeabilized and blocked in 10% goat serum with 0.2% Triton X-100 in PBS at room temperature for 1 h. Primary antibodies were diluted in a solution containing 0.1 m L-lysine and 0.2% Triton X-100 in PBS, and samples were incubated for 3 h at room temperature. Following three 10-min washes in PBS, sections or coverslips were incubated for 1 h at room temperature in secondary antibodies diluted in the lysine/Triton X-100 solution. Following three 10-min washes in PBS tissues or coverslips were mounted using Vectashield containing DAPI (Vector Laboratories). Confocal images were acquired using either LSM510 or LSM880 laser scanning confocal microscopes (Carl Zeiss). Z-stacks of multiple focal planes and channels were acquired using sequential scanning, a frame average of 2 and an interval of 2.0–2.3 μm (20× air immersion objective, NA 0.8) or 1.4–1.8 μm (63× oil immersion objective, NA 1.4). Airyscan images were acquired with an LSM880 microscope equipped with the 63× oil immersion objective and using a z-interval of 0.17 µm. Data were analyzed using Zen (Carl Zeiss) or ImageJ (NIH Image) software. Pearson's correlation coefficients (PCCs) were calculated for immunofluorescence co-localization analysis using the Coloc2 plugin for ImageJ. The PCC assesses whether the variability in pixel intensities in different channels can be explained with a simple linear relationship (Dunn et al., 2011). PCCs range from +1 to −1, where +1 indicates fluorescence intensities in two channels are linearly related (positive correlation), −1 indicates two images' fluorescence intensities are inversely related one to another (negative correlation), and 0 indicates no correlation.
Experimental design and statistical analysis
All n values represent biological replicates of individual cells, and quantitative data were analyzed from at least three animals (N) per experiment. Quantitative data were analyzed and plotted using OriginPro 2016 software. Data were tested for normality using a Shapiro–Wilk test, and for homogeneity of variances using Levene's test. For normally distributed data, significance was determined using a t test or ANOVA with post hoc Bonferroni correction, as stated in the figure legends. For non-normally distributed data, significance of differences between multiple groups was determined using a Kruskal–Wallis test (for homogenous variances), or the Welch ANOVA (where data violated the assumption of homogeneous variances). Significance (p value) was defined as follows: *p < 0.05, **p < 0.01, ***p < 0.001, ****p < 0.0001. Data presented as mean ± SEM unless otherwise stated.
Results
SGNs and glial cells display distinct protein expression profiles and morphologies
Afferent neurons and their glia can be distinguished from one another within cochlear tissues and in spiral ganglion cultures, based on their protein expression profiles and morphologies (Fig. 1). An antibody targeting the neuronal protein βIII-tubulin labeled the neurites and cell bodies of SGNs in cochlear sections (Fig. 1A–D). S100 immunofluorescence was detected in satellite glial cells (SGCs) encircling the cell bodies of the SGNs (Fig. 1B,D), and in SCs wrapping the SGN neurites (Fig. 1C). βIII-tubulin continued to be expressed by SGNs in culture (Fig. 1E,F). S100 was evident in a separate population of cells in these cultures (Fig. 1E–G), and these had morphologies that were distinct from those of the neurons. Whereas the SGNs expressing βIII-tubulin had spherical cell bodies and fine eccentric neurites, S100-positive cells had a flatter appearance and a variety of cytoplasmic shapes. These ranged from extended spindles with small cell bodies, to more complex triangular or multipolar morphologies. Consistent with data from cultured mouse cochlear glia (Smith et al., 2020), the cells identified by S100 immunofluorescence were also labeled by an antibody targeting the transcription factor Sox10 (Fig. 1G). These distinct morphologies enabled us to identify neurons and glia in subsequent cell physiology experiments using these spiral ganglion cultures.

Neuronal and glial cell markers in cochlear tissues and spiral ganglion cultures. A, DIC image of the mid-turn region of the P14 rat cochlea, with overlaid immunofluorescence for the neuronal marker βIII-tubulin (βIII-tub; magenta). Cell nuclei are labeled using DAPI (blue). SGN cell bodies are located within the spiral ganglion (sg), and their labeled neurites extend from the organ of Corti (oC) to the ganglion, and from the ganglion toward the brain (arrow). B, Higher magnification of the spiral ganglion. SGN cell bodies are surrounded by single SGCs, identified by S100 immunofluorescence (green). C, Detail of SGN neurites exiting the ganglion (denoted by arrow in A) surrounded by S100-labeled SCs. D, Detail of a single SGN-SGC pair. Inset between C and D represents the schematic relationship between SGNs and their attendant glial cells. E, F, Rat spiral ganglion cultures (P12 + 2 DIV), with cells immunolabelled for βIII-tubulin (magenta) and S100 (green). Spindle-shaped and multipolar S100-positive glia are in close proximity to βIII-tubulin-positive SGN cell bodies or neurites. G, In a P5 + 4 DIV culture, S100-positive cells (green) are double-labeled for the glial nuclear marker Sox10 (magenta). Scale bars: 100 µm (A), 20 µm (B, E–G), 10 µm (C, D).
Purinergic responses in cochlear glia are consistent with the activation of P2X7R-dependent ion channels and large membrane pores
P2X7Rs are activated by the ATP analog BzATP, resulting in non-selective cation currents that increase in magnitude in response to brief repetitive applications of the agonist (Surprenant et al., 1996). P2X7Rs display species-dependent variations in their sensitivity to known agonists (Young et al., 2007; Donnelly-Roberts et al., 2009; Metzger et al., 2017). The reported pEC50 for the widely used agonist BzATP is 5.3 for recombinant human P2X7Rs, but is 4.0 for mouse P2X7Rs (Donnelly-Roberts et al., 2009). Some commonly used strains of laboratory mice (including C57BL/6) carry the allelic polymorphism P451L in the cytoplasmic domain of P2X7R, which is not found in rats or humans, and that reduces ATP sensitivity and impairs the formation of large membrane pores (Adriouch et al., 2002). The pEC50 for BzATP at recombinant rat P2X7Rs is 5.0, closer to that of the human receptor. Accordingly, rats may represent a more physiologically relevant model for investigating the properties of P2X7Rs in native cells.
To assess the functionality of the P2X7Rs expressed in the peripheral portion of the rat auditory nerve, we prepared P6 spiral ganglion cultures and conducted whole-cell patch-clamp recordings from dissociated SGNs and glia after 1–3 DIV (Fig. 2). Before recordings SGNs were identified based on morphologic criteria highlighted in Figure 1. These included their large circular cell bodies (10–20 µm in diameter) and fine neurite extensions, and the neuronal identity was confirmed in the whole-cell configuration by characteristic voltage-gated outward K+ currents (Smith et al., 2015) and voltage-gated transient inward Na+ currents (Browne et al., 2017). Brief, local pico-spritzer application of BzATP (10 μm in LDAP; 1 s, every 10 s) to SGNs resulted in rapidly activating transient inward currents that decreased in peak amplitude on repetitive exposure to the agonist (Fig. 2A,C). The rapid desensitization of this current response resembled that activated by ATP analogues in rat SGNs in cochlear slice preparations (Salih et al., 2002; Greenwood et al., 2007). In contrast, in glial cells identified based on criteria highlighted in Figure 1 (spindle-shaped, or flat cell body 5–10 µm in diameter with short cytoplasmic extensions), there was a lack of transient Na+ currents. The same BzATP application regimen resulted in a more sustained inward current, the amplitude of which increased with repeated applications of the agonist (Fig. 2B,D). This current growth behavior persisted in glia cultured from rats after the onset of hearing (P14; Fig. 2D). The responses of SGNs and glia to BzATP were thus quite different, suggesting distinct assemblies of P2X receptor subunits were activated in these cell types.

BzATP activates distinct current responses in cultured rat cochlear neurons and glia. A, Whole-cell patch-clamp recording from a P6 SGN following 2 DIV (P6 + 2 DIV); 10 μm BzATP in LDAP (0.3 mm Ca2+, 0 mm Mg2+) delivered via a 1-s application (denoted by arrow) from a pico-spritzer pipette located ∼50 µm from the cell elicits a fast-activating transient inward current at the holding potential (Vh = −60 mV). Subsequent spritzes 60 s apart result in currents of decreasing amplitude. B, The same paradigm applied to a glial cell in whole-cell mode results in sustained currents of increasing amplitude. C, Group data for P6 SGNs (n = 9, mean ± SEM). Current amplitude normalized to the peak inward current for each neuron. D, Group data for P6 (n = 10) and P14 (n = 31) glia. The progressive current growth is apparent in glia cultured from animals before and after hearing onset.
Given the similarity of the SGN responses to those seen previously in response to other purinergic agonists, and attributed to the activation of P2X2/P2X3-containing heteromers (Greenwood et al., 2007), our subsequent electrophysiology experiments focused on the glial responses to BzATP (Fig. 3). When the BzATP application was lengthened from 2 to 20 s, the current response showed a continual growth throughout the longer application (Fig. 3A). The voltage dependence of the activated current was examined using a voltage ramp protocol (Fig. 3B), with command ramps applied repeatedly to the glial cells before and during BzATP application. The slope of the ramp current response increased during BzATP application, and the digitally subtracted BzATP-gated ramp current was observed to reverse close to 0 mV, suggestive of a non-selective cation current under the imposed ionic conditions. Maximal glial current responses to 10 μm BzATP (achieved by several priming 1-s spritzes repeated every 60 s) were blocked >80% by the P2X7R-specific antagonists A-740003 (100 nm; Fig. 3C,D) and JNJ-47965567 (100 nm; Fig. 3E,F). The effects of A-740003 were reversible on washout, consistent with observations elsewhere (Brône et al., 2007), and the lack of reversibility of the block by JNJ-47965567 was reminiscent to that seen previously (Bhattacharya et al., 2013). These patch-clamp experiments suggested that these glia expressed functional P2X7R subunits that formed functional cation-permeable channels on agonist binding.

BzATP activates P2X7R-mediated currents in cultured cochlear glia. A, In a cultured cochlear glial cell (P6 + 2 DIV) in whole-cell mode, a 2-s application of 10 μm BzATP activates an inward current (Vh = −60 mV). On recovery to baseline, a 20-s application of BzATP activates an inward current that grows in amplitude during the agonist application. The current returns to baseline on withdrawal of the agonist. B, Repeated voltage ramps (−140 to +60 mV during 1 s) applied to a glial cell (P6 + 2 DIV) activate inward and outward whole-cell currents (control). During a 20-s application of 10 μm BzATP, the inward and outward currents increase in amplitude, and there is a rightward shift of the ramp current reversal potential. Digital subtraction derives the BzATP-activated current (gray), which reverses close to 0 mV. C–F, The current response to BzATP in cultured glial cells (P14 + 2 DIV) is blocked by P2X7R-specific antagonists. C, Following four to five priming BzATP spritzes (data not shown; 10 μm BzATP, 1-s spritz repeated every 60 s) to activate the maximal current (left), the current response to BzATP is reduced following a 5-min bath application of 100 nm A-740003 (center). The current amplitude recovers following a 20-min washout of the antagonist (right). D, Group data showing the progressive block by A-740003 (n = 3; mean ± SEM). The antagonist is introduced to the bath immediately after the application of BzATP that achieves maximal amplitude (denoted spritz #1). Current amplitude is normalized between the maximum and minimum response for each cell. E, Maximal BzATP-activated current (left) is reduced following a 5-min bath application of 100 nm JNJ-47965567 (center). There is no recovery of current amplitude on washout of this antagonist (right). F, Group data showing the progressive action of JNJ-47965567 (n = 4).
Activation of recombinant P2X7Rs results in a sustained increase of intracellular Ca2+ concentration (Bianchi et al., 1999; Donnelly-Roberts et al., 2009). To assess the ability of P2X7Rs in peripheral cochlear glia to mediate such a response, cultured glia were loaded with the membrane permeable ratiometric Ca2+ indicator fura-2 AM ester (5 μm; Fig. 4). Glia were identified based on the morphologic criteria identified in Figure 1; 10 μm BzATP in LDAP (i.e., 0.3 mm extracellular Ca2+) activated a sustained increase of intracellular Ca2+ concentration (Fig. 4A), but in ZDAP (i.e., no added Ca2+) the response to BzATP was more transient in nature (Fig. 4B). The proportion of responsive glial cells was significantly higher in the presence of extracellular Ca2+ (66.8 ± 6.6%, i.e., 289/390 cells) than in its absence (10.9 ± 2.9%, 46/435 cells; p < 0.0001, unpaired t test). These observations suggested that BzATP activated a Ca2+ influx in the majority of cells, but in a small minority of cells BzATP was also capable of mobilizing intracellular Ca2+ stores. These observations suggest that BzATP may activate ionotropic and metabotropic receptors simultaneously in some cells. Consistent with this idea, BzATP is a known agonist of rat P2Y2Rs (Wildman et al., 2003). In separate experiments to test for the presence of candidate Gq/phospholipase C-coupled P2YRs, we applied UTP, a potent agonist at P2Y2Rs and P2Y4Rs, and to a lesser degree at P2Y6Rs (von Kügelgen and Hoffmann, 2016). UTP (50 μm) activated transient increases of intracellular Ca2+ concentration in the presence of extracellular Ca2+ (Fig. 4C). Cells also responded to 50 μm UTP in the absence of extracellular Ca2+ (Fig. 4D). The proportion of glial cells that responded to 50 μm UTP in the presence of extracellular Ca2+ (14.1 ± 2.7%, 98/654 cells) was not significantly different to that responding in the absence of extracellular Ca2+ (23.3 ± 16.9%, 84/374; p > 0.05, unpaired t test). These experiments suggest that Ca2+ homeostasis in these cells is complex in nature, possibly being mediated by multiple purinergic receptor types in some cells. In addition to ionotropic P2X7Rs (based on our electrophysiology results), the sensitivity to both BzATP and UTP in the absence of extracellular Ca2+ in a minority of cells are consistent with the possible activation of P2Y2Rs. Given these apparent complexities we did not pursue the calcium imaging approach further.

Calcium signaling demonstrates diverse purinergic responses in cultured cochlear glia. A, B, Intracellular Ca2+ responses (measured as F340/380) to 10 μm BzATP in individual cultured rat glial cells loaded with fura-2 AM. A, BzATP activates a sustained increase of intracellular Ca2+ when applied in medium containing 0.3 mm extracellular Ca2+ (LDAP, n = 289 cells, from three P8 + 2 DIV cultures). Colors represent cells cultured from three different animals. The dotted line shows the average response, which is detailed in the inset (A'). B, BzATP activates transient responses when no extracellular Ca2+ is added (ZDAP, n = 46 cells, from three P8 + 2 DIV cultures). C, Intracellular Ca2+ responses to 50 μm UTP in LDAP. UTP activates transient increases of intracellular Ca2+ when added to the bath (n = 98 cells, from three P5 + 2 DIV cultures). D, In separate experiments, 50 μm UTP activates transient responses when applied in ZDAP (n = 84 cells, from three P5 + 2 DIV cultures).
P2X7Rs contribute to the normal and pathophysiological functions of a number of tissues by their formation of macromolecule-permeable membrane pores (Virginio et al., 1999). This feature may be critical for the uptake or release of high molecular weight species. To test the ability of cultured cochlear glia to form these pores, they were exposed to the propidium dye YO-PRO-1 (1 μm in LDAP) in the absence (control) and presence of 10 μm BzATP during confocal live imaging (Fig. 5). After 15 min there was a significantly higher proportion of cells with measurable changes of fluorescence intensity when exposed to BzATP compared with control (p < 0.001; Fig. 5A). The addition of the P2X7R-specific antagonist A-740003 (1 μm) significantly decreased the proportion of BzATP-exposed cells accumulating YO-PRO-1 (p < 0.05; Fig. 5A). A measurable uptake of YO-PRO-1 in agonist-free conditions suggested contributions from P2X7R-dependent and (as yet unidentified) P2X7R-independent mechanisms in these experiments. The latter were not investigated here, and will require further careful examination to identify specific contributors. Analysis of cells in which there was a measurable increase of YO-PRO-1 fluorescence revealed that the rate of entry was significantly higher in those cells exposed to BzATP (p < 0.01; Fig. 5B). The addition of 1 μm A-740003 significantly decreased the rate of YO-PRO-1 uptake in BzATP-exposed cells (p < 0.05; Fig. 5B).

BzATP activates P2X7R-mediated YO-PRO-1 uptake in cultured cochlear glia. A, The proportion of glial cells taking up YO-PRO-1 during a 15-min period is significantly higher in the presence of 10 μm BzATP (91/125 in five independent experiments from three P14 + 2 DIV cultures) compared with control (no added BzATP, 60/135 cells in six independent experiments from three P14 + 2 DIV cultures; ***p < 0.001, Welch ANOVA). Inclusion of 1 μm A-740003 prevents the BzATP-mediated uptake of YO-PRO-1 (n = 46/103 cells in five independent experiments from three P14 + 2 DIV cultures; *p < 0.05). Horizontal black lines represent the median percentage of YO-PRO-1-positive cells in each group, and open triangles represent the mean. The box plots represent the 25–75th percentiles, and whiskers represent the 10–90th percentiles. There is no significant difference between the control and antagonist groups (p > 0.05). B, For cells displaying a detectable increase of fluorescence during the imaging period, the rate of YO-PRO-1 uptake is significantly faster with BzATP added compared with control (**p < 0.01, Kruskal–Wallis test). Preincubation in 1 μm A-740003 significantly slows the BzATP-mediated uptake of YO-PRO-1 (*p < 0.05). There is no significant difference between the control and antagonist groups (p > 0.05).
Together, these electrophysiology and imaging experiments demonstrated that glia cultured from the auditory nerve express functional P2X7Rs. During brief exposure to BzATP they exhibit ligand-gated ion channel behavior, but during extended activation they can mediate the entry of high molecular weight molecules. These actions are prevented by P2X7R-specific antagonists.
P2X7R expression in rat peripheral cochlear glial cells by hearing onset
Next, we employed immunofluorescence to identify which cell types within the rat auditory nerve express P2X7Rs (Fig. 6). The rabbit polyclonal antibody targeting the rat P2X7 C terminus (generated by Alomone Labs) has been employed previously in immunohistochemistry and immunofluorescence experiments on rat cochlea (Nikolic et al., 2003). Here, in rats soon after hearing onset P2X7 immunofluorescence was evident within the auditory nerve proximal to the glial border (Fig. 6A, arrow), but was not detectable beyond that in the central portion of the nerve extending toward the brainstem (Fig. 6A,B). Some large-diameter blood vessels (Fig. 6A) within the bony modiolus were labeled. P2X7 immunofluorescence was observed within the spiral ganglion (Fig. 6C), most notably in the discrete regions where SGC membranes were in close apposition with those of SGN cell bodies, and also within the neural tracts entering and leaving the spiral ganglion (Fig. 6D). Within these regions there were paired densities of P2X7 immunofluorescence located close to anti-Caspr-labeled paranodes, consistent with a localization of the purinergic receptors within the membrane subcompartments of SCs that wrap SGN neurites. The P2X7 immunofluorescence was also detected in glial membranes wrapping the cell bodies of peripherin-expressing Type II SGNs (Fig. 6E,F), the afferent neurons that specifically innervate outer hair cells (OHCs; Jagger and Housley, 2003). This suggests that the receptors are located in SGCs surrounding both afferent neuron types.
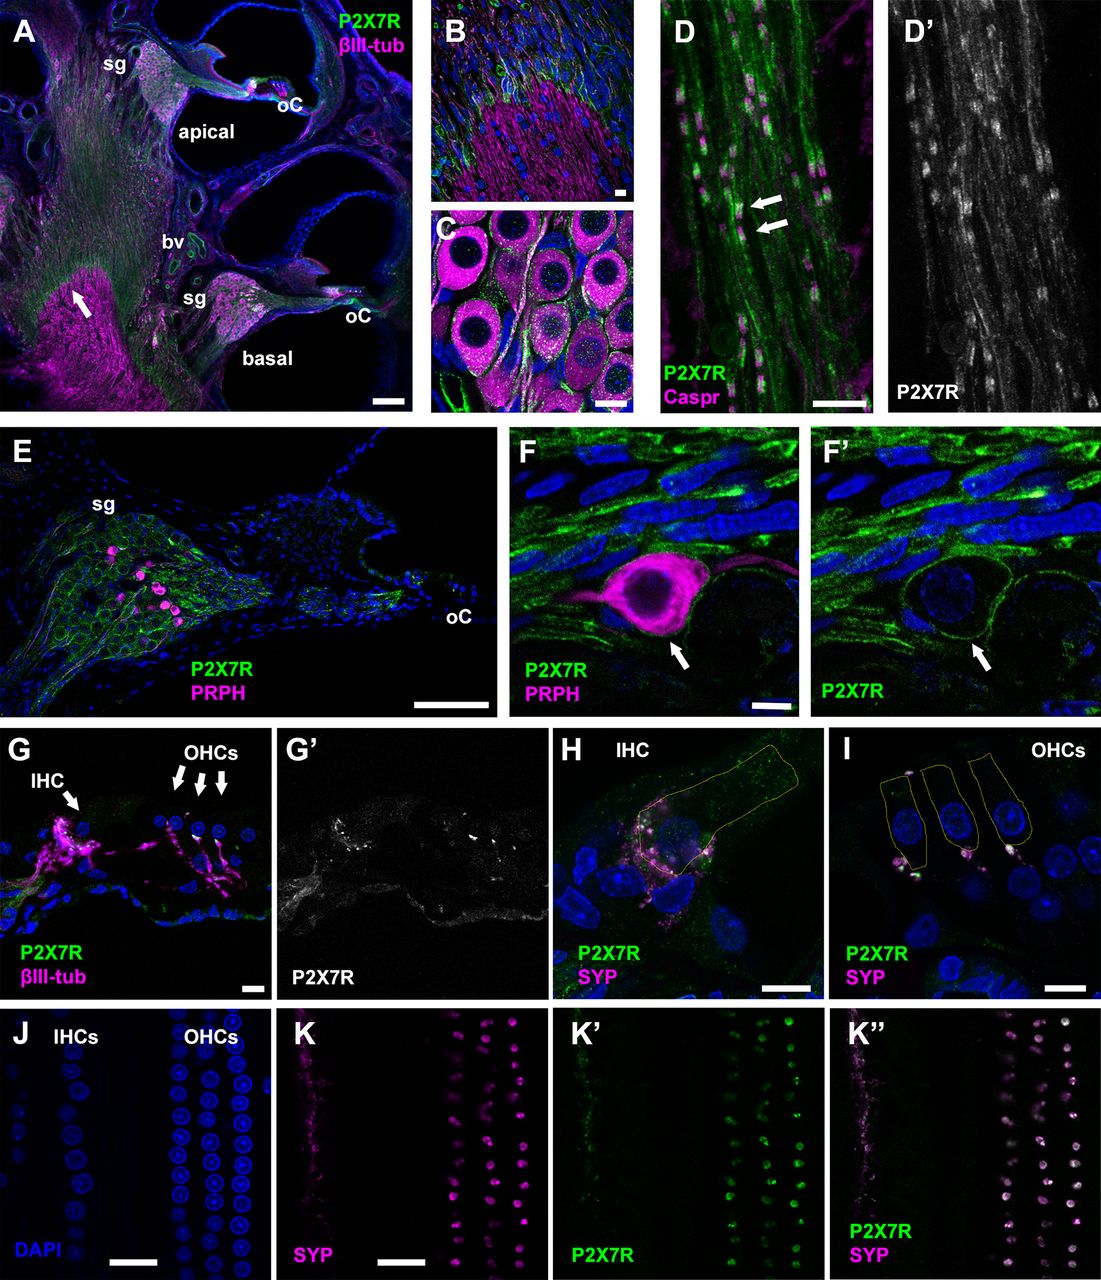
P2X7R localization in the juvenile rat cochlea. A, P2X7 immunofluorescence demonstrates P2X7R expression (P2X7R, green) in the basal and apical cochlear turns of a P13 rat. Hair cells are located in the organ of Corti (oC). Some immuno-positive blood vessels (bv) are evident. The anti-βIII-tubulin antibody (βIII-tub; magenta) labels neuronal cell bodies in the spiral ganglion (sg) and their neurites. Cell nuclei are labeled using DAPI (blue). B, Higher magnification of the glial transition zone where peripheral and central glial cells meet (denoted by arrow in A), which is demarcated by a distinct decrease of anti-P2X7 immunofluorescence in the central region. C, Detail of P2X7R labeling in the spiral ganglion, localized in the region of glial cell membranes wrapping SGN cell bodies and neurites. D–D', Postganglionic bundle of nerve fibers in a P14 rat labeled with anti-P2X7, and anti-Caspr antibody (magenta) to label paranodes. Anti-P2X7 signal (green) is present in SC internodal membranes that ensheath the neurites, and also in paired densities close to the paranodes (arrows). E, Basal turn of a P14 rat cochlea labeled with anti-P2X7, and anti-peripherin (PRPH, magenta) to identify Type II SGNs. Cell nuclei labeled using DAPI (blue). P2X7Rs appear to localize to all SGCs encircling SGN cell bodies. F–F', Anti-P2X7 immunofluorescence labeling an SGC associated with a peripherin-positive Type II SGN (arrow). G–G', Anti-P2X7-labeled densities below IHCs and OHCs in the organ of Corti. H, I, Double labeling for P2X7Rs (green) and anti-synaptophysin (SYP, magenta) identifies efferent terminals below the IHC (H) and OHCs (I). Yellow outlines show the approximate positions of the hair cells. J, K, Wholemount preparation of the organ of Corti mid-turn region of a P21 rat. J, Confocal image showing nuclei of OHCs and IHCs labeled using DAPI. K, Bouton-like structures double immunolabelled for SYP (magenta) and P2X7Rs (green), at a focal position ∼1 µm below the nuclei. Scale bars: 100 µm (A, E), 10 µm (B–D, F–I), 20 µm (J, K).
Although P2X7 immunofluorescence was not evident within hair cells or supporting cells in the organ of Corti, there were densely labeled puncta close to the base of hair cells (Fig. 6G). The identity of these structures was investigated in separate experiments examining the distribution of synaptophysin, a marker of efferent olivocochlear presynaptic terminals (Wedemeyer et al., 2013). In cochlear sections, dense puncta were co-labeled with P2X7 and synaptophysin antibodies, and were thus identified as lateral efferent boutons contacting the afferent fibers of IHCs, and medial efferent boutons directly contacting OHCs (Fig. 6H,I). PCC analysis assessed the degree of co-localization of the signals in wholemount preparations of the cochlear mid-turn region of P20–P21 rats (Fig. 6J,K). A rectangular ROI was drawn along the synaptic region for each row of OHCs (inner, middle, outer) to measure the fluorescence intensity of both signals. A Shapiro–Wilk test confirmed that the intensity values were normally distributed, and Levene's test confirmed homogeneity of variances. PCC values calculated for anti-P2X7 and anti-synaptophysin signals in all three rows were positive (inner, 0.78 ± 0.04; middle, 0.75 ± 0.04; outer, 0.74 ± 0.06; n = 8 rats). When the P2X7 fluorescence channel was rotated by 90° for negative control analysis (Dunn et al., 2011), the mean PCC value across all rows was reduced to approximately zero (control, 0.75 ± 0.01; rotated, 0.01 ± 0.00; p < 0.0001, n = 8, two sample t test). The PCC analysis indicated that immunofluorescence for P2X7 and synaptophysin were co-localizing in the hair cell synaptic region more often than just by chance, further suggesting that P2X7Rs are located on efferent synaptic boutons.
The same polyclonal antibody allowed us to determine the onset of expression of P2X7Rs during postnatal development of the auditory nerve (Fig. 7), using cochlear sections from rats between P0 (day of birth) and P12 (after hearing onset). At P0 there was diffuse P2X7 immunofluorescence in Kölliker's organ (Fig. 7A), which is formed of epithelial supporting cells medial to the IHCs (Gale and Jagger, 2010), but there was little signal evident within the spiral ganglion (Fig. 7A,B). There was an apparent increase in P2X7 expression in the ganglion and neural tracts between P4 (Fig. 7C,D) and P8 (Fig. 7E,F), and by P12 (Fig. 7G,H) the immunofluorescence resembled the distribution described in Figure 6. The paired densities of P2X7 immunofluorescence that we identified in SCs close to nodes of Ranvier (Fig. 6D) were evident at P12 (i.e., by hearing onset).

P2X7R expression during postnatal development of the rat cochlea. P2X7 immunofluorescence demonstrates P2X7R expression (P2X7R, green) in cochlear sections from rats between birth and hearing onset. The anti-βIII-tubulin antibody (magenta) labels neuronal cell bodies in the spiral ganglion (sg) and their neurites. Cell nuclei are labeled using DAPI (blue). A, Mid-basal turn at P0. There is diffuse P2X7 immunofluorescence in Kölliker's organ (Ko) and organ of Corti (oC). B, B', Detail of P2X7R signal in the spiral ganglion at P0. C, D, Apical turn at P4. E, F, Basal turn at P8. There is increased anti-P2X7 signal in spiral ganglion. G, H, Basal turn at P12. Anti-P2X7 labels SGC and SC membranes, and paired densities are evident (arrow in H). Scale bars: 100 µm (A, C, E, G) and 20 µm (B, D, F, H).
In agreement with Nikolic et al. (2003), these experiments identified that P2X7 protein expression in the rat auditory nerve increases around the end of the first postnatal week, and it assumes the mature pattern by the onset of hearing. However, in agreement with our physiology experiments, we identified that the prominent P2X7R expression is actually within peripheral glial cells, and there was no detectable P2X7 signal within SGN structures.
Exclusive expression of P2X7Rs by peripheral cochlear glia in mice
In order to confirm the cell types that express P2X7Rs, without the potential questions of antibody specificity or reactivity in decalcified cochlear tissues, we examined the Tg(P2rx7-EGFP)FY174Gsat reporter mouse (Fig. 8) from the Rockefeller University GENSAT library of engineered mice using BAC to drive the expression of soluble EGFP in genetically defined cell populations (Schmidt et al., 2013). Previous work with this line has reported EGFP expression in both neurons and glia in several regions of the brain (www.gensat.org). In cochlear vibratome sections from one-month-old mice, soluble EGFP expression driven from the P2rx7 promoter was restricted mainly to the auditory nerve structures that extended from close to the organ of Corti to within the bony modiolus (Fig. 8A). Closer examination revealed EGFP was restricted to the neural structures limited within the bony spiral lamina and the spiral ganglion, and extending toward the modiolus (Fig. 8B). There was no EGFP fluorescence detectable in equivalent structures in wild-type controls (Fig. 8C). Within the cochlear modiolus, the EGFP signal ended abruptly at the peripheral limit of the glial border, such that EGFP fluorescence was not detectable within the central portion of the auditory nerve (Fig. 8D). Similarly, EGFP was concentrated within the neural tract between the organ of Corti and the spiral ganglion, but there was no EGFP signal detectable within supporting cells or hair cells (Fig. 8B,E). These clear boundaries suggested P2X7R expression only by specific cell types.

P2rx7-driven soluble EGFP within glial cells in the peripheral portion of the auditory nerve. A, EGFP expression (green) in the basal, mid and apical cochlear turns and the vestibular ganglion (vg) of a P31 transgenic (tg) Tg(P2rx7-EGFP)FY174Gsat reporter mouse. The anti-βIII-tubulin antibody (magenta) labels neuronal cell bodies in the spiral ganglion (sg) and their neurites. Cell nuclei are labeled using DAPI (blue). The glial transition zone is marked by an arrow. B, EGFP in the central and peripheral neurites region and within the basal turn spiral ganglion. C, Green fluorescence is not detectable in the basal cochlear region of a wild-type (wt) mouse. D, The glial transition zone in a reporter mouse where peripheral and central glial cells meet is demarcated by a distinct decrease of anti-EGFP immunofluorescence in the central region (arrow in A). E, Detail of the organ of Corti (oC) region revealing EGFP signal in the nerve tract (arrow), but it is absent from supporting cells and hair cells. F, The spatial distributions of EGFP and βIII-tubulin immunofluorescence intensities in the spiral ganglion. G, A 16-µm line drawn across SGN/SGC pairs in F (shown in yellow) measures relative EGFP and βIII-tubulin immunofluorescence pixel intensities (normalized signal averaged across 10 SGN/SGC pairs). The EGFP signal appears as twin peaks at either side of the SGN cell body. H, Image showing the spatial distributions of EGFP and βIII-tubulin intensities in the neurite region leaving the basal turn ganglion. I, A 2.6-µm (yellow) line drawn perpendicularly across SC/neurite pairs in H measures relative EGFP and βIII-tubulin pixel intensities (signal averaged across 10 neurites). The EGFP signal appears as twin peaks at either side of the neurites. J, EGFP and ankyrin-G immunofluorescence (AnkG; blue) at a node of Ranvier of a neurite exiting the distal region of the ganglion. The EGFP signal completely surrounds the nodal region. K, A 3.4-µm line drawn perpendicularly across individual nodes measures relative EGFP and AnkG pixel intensities (averaged signal across 10 nodes). EGFP expression profile appears as two peaks outside each node. L, EGFP and Caspr immunofluorescence in the region shown in J. M, EGFP and Caspr fluorescence intensities averaged perpendicularly across 10 paranodes, demonstrating a distinct spatial separation of the signals at the outer edges. Scale bars: 50 µm (A, E), 20 µm (F, H), 2 µm (J, L).
Within the spiral ganglion, the EGFP signal was restricted to SGCs surrounding SGN cell bodies (Fig. 8F). Peak EGFP fluorescence intensity was spatially distinct to that of fluorescence associated with the neuronal marker βIII-tubulin (as demonstrated by line plots of pixel intensity drawn through neuron-glial pairs; Fig. 8G). Similarly, EGFP within nerve fiber bundles extending from the spiral ganglion centrally toward the modiolus appeared associated with the SCs wrapping βIII-tubulin-labeled neurites, and peak EGFP fluorescence was spatially distinct from that of βIII-tubulin (Fig. 8H,I). Close examination of individual SCs in this region identified paired regions of EGFP fluorescence that flanked axonal nodes of Ranvier (labeled with anti-ankyrin-G; Fig. 8J,K), and these densities appeared to wrap around Caspr-positive axonal paranodes (Fig. 8L,M). The EGFP signal appeared to span the nodal gap, and so was possibly derived from within the SC microvilli contacting the node (D'Este et al., 2017). Together, these observations demonstrate that P2rx7-driven soluble EGFP was most likely in the cytoplasm of glial cells within the peripheral portion of the auditory nerve, but was undetectable within the cell bodies or neurites of the SGN themselves.
The soluble EGFP detected in the GENSAT reporter mouse identified cell types expressing P2X7Rs, but of course it does not provide insight into the subcellular localization of the receptor protein. To this end, we next examined the BAC transgenic mouse line BL/6N-Tg(RP24-114E20P2X7451P-StrepHis-EGFP), which allows visualization of functional P2X7Rs with EGFP tagged to the C terminus of the full-length P2X7 protein (Kaczmarek-Hajek et al., 2018). P2X7-EGFP was evident throughout the membranes of SGCs in the spiral ganglion (Fig. 9A,B), and in discrete regions of the nerve fiber tracts entering and leaving the ganglion. There was no P2X7-EGFP detected in the membranes of cochlear hair cells or supporting cells (Fig. 9A). The EGFP signal within SGCs was spatially distinct to that of the neuronal marker βIII-tubulin (Fig. 9C). Closer examination of the neurite tracts using standard confocal (Fig. 9D) and Airyscan imaging (Fig. 9E,G) revealed P2X7-EGFP concentrated within paired structures close to nodes of Ranvier. The EGFP fluorescence there was spatially separate from axonal ankyrin-G labeling at the nodes (Fig. 9E,F) and the axonal Caspr labeling at the paranodes (Fig. 9G,H). The P2X7-EGFP signal surrounded the nodal gap, a positioning consistent with the SC membrane, and possibly within their microvilli that contact the node (D'Este et al., 2017). Thus, the two reporter mouse models displayed consistent labeling patterns within cochlear glial cells, but there was no detectable EGFP signals in either model within SGNs or the organ of Corti.

Localization of transgenic P2X7-EGFP fusion protein within the peripheral portion of the auditory nerve. A, Confocal imaging of P2X7-EGFP fluorescence (EGFP, green) expressed in the basal cochlear turn of a P38 BL/6N-Tg(RP24-114E20P2X7451P-StrepHis-EGFP) transgenic (tg) mouse. The anti-βIII-tubulin antibody (magenta) labels neuronal cell bodies within spiral ganglion (sg) and their neurites. Cell nuclei are labeled using DAPI (blue). No P2X7-EGFP signal is evident in the organ of Corti (oC). B, Airyscan image showing P2X7-EGFP fluorescence and βIII-tubulin immunofluorescence distributions in the spiral ganglion. C, A 16-µm line drawn across SGN/SGC pairs in B (shown in yellow) measures P2X7-EGFP fluorescence and βIII-tubulin immunofluorescence pixel intensities. P2X7-EGFP expression profile appears as narrow twin peaks at either side of the SGN cell body (signal average across 10 SGN/SGC pairs). D, The P2X7-EGFP signal is located within discrete focal densities (arrow) within the nerve tracts exiting the distal region of the ganglion. E, Airyscan imaging of P2X7-EGFP fluorescence and ankyrin-G (AnkG) immunofluorescence at an individual node of Ranvier in region denoted by arrow in D. F, A 2-µm line drawn perpendicularly across individual nodes in E (shown in yellow) measures relative P2X7-EGFP and AnkG signal pixel intensities (averaged signal across 10 nodes). The P2X7-EGFP signal appears as twin peaks at either side of the node. G Airyscan imaging of P2X7-EGFP fluorescence and anti-Caspr immunofluorescence at the same region shown in E. H, P2X7-EGFP and Caspr intensity profiles averaged perpendicularly across 10 paranodes (yellow line in G), demonstrating a distinct spatial separation of the signals at the outer edges. Scale bars: 20 µm (A, B, D) and 2 µm (E, G).
Finally, we used a P2X7-specific nanobody construct (Kaczmarek-Hajek et al., 2018) on cochlear sections from young adult wild-type mice. The labeling within the auditory nerve was non-neuronal, and consistent with P2X7R expression exclusively within SGCs and SCs (Fig. 10A,B). The 7E2-rbIgG construct detected a localization of P2X7Rs close to nodes of Ranvier, comparable to that suggested by the polyclonal antibody labeling in rats (Figs. 6, 7), and EGFP fluorescence in the BL/6N-Tg(RP24-114E20P2X7451P-StrepHis-EGFP) reporter mice (Fig. 9). Nanobody-associated fluorescence was not detected in the hair cell region or in supporting cells (Fig. 10C).

Nanobody labeling of endogenous P2X7Rs in the mouse auditory nerve. A, A P2X7-specific nanobody-rbIgG fusion construct (7E2-rbIgG; green) detects endogenous P2X7Rs in the mid cochlear turn of a P38 wild-type (wt) mouse. Cell nuclei are labeled using DAPI (blue). B, In the spiral ganglion, the nanobody construct labels SGC membranes and internodal membranes of SCs. Discrete paired densities of nanobody-associated fluorescence are apparent within the nerve tracts exiting the ganglion (arrows). C, P2X7-specific nanobody labeling of SCs located within the afferent nerve tract, but there is no labeling of hair cells or supporting cells within the organ of Corti (oC). Scale bars: 20 µm (A–C).
Discussion
In this study, we used various approaches to examine P2X7Rs within the auditory nerve of rodents. Our electrophysiology and imaging experiments determined that cultured cochlear glia are readily activated by an agonist of P2X7Rs. Our data suggest that while P2X7Rs are expressed ubiquitously by glial cells within the peripheral portion of the auditory nerve, they are unlikely to contribute to the function of SGNs or hair cells. The data suggest that the receptors occur where the glial cell membrane is in close apposition to that of SGNs, (1) at the neuronal cell body and (2) close to nodes of Ranvier. The abrupt interruption of P2X7R expression at the glial border between the PNS and the CNS suggests their function is restricted to the auditory periphery, and that they make no contribution in the central portion of the auditory nerve. This suggests only peripheral glia would sense elevated ATP levels within the cochlea, a recognized consequence of noise exposure or hypoxia (Thorne et al., 2002). Whether the glia consequently enact P2X7R-dependent neuroprotection, or suffer cytotoxic effects themselves remains to be determined.
Glial versus neuronal P2X7R expression, an ongoing debate
The sites of P2X7R expression in the brain remains a topic of debate (Bartlett et al., 2014; Illes et al., 2017; Miras-Portugal et al., 2017), one that requires careful consideration given the current focus on this receptor class within a number of neurologic conditions (Jimenez-Mateos et al., 2019). P2X7R-mediated responses in various brain areas, particularly the hippocampus, and their localization using commonly used antibodies and in situ hybridization initially suggested that these receptors contribute to neuronal function (Illes et al., 2017). However, it was subsequently determined that immuno-reactivity using the same antibodies was unaltered in widely used knock-out mouse models (Sim et al., 2004). The same study failed to find P2X7Rs in the hippocampus. Further controversy arose following the recognition that the P2rx7 gene had escaped complete inactivation in these knock-outs (Nicke et al., 2009; Masin et al., 2012).
In recent years, the development of new mouse models has intensified the debate. Using the GENSAT reporter mouse, Engel and colleagues reported soluble EGFP expression in cortical glia and neurons, and an upregulation in hippocampal neurons following kainic acid-induced status epilepticus (Engel et al., 2012). The same group then demonstrated P2X7R induction in both neurons and microglia of the neocortex during the chronic phase of epilepsy (Jimenez-Pacheco et al., 2013). A mouse model with human P2RX7 cDNA knocked in, and with all known murine P2rx7 splice variants knocked out (“humanized P2rx7hP2RX7/hP2RX7 mice”), provided evidence of P2X7R expression in the CA3 area of the hippocampus using in situ hybridization (Metzger et al., 2017). hP2RX7 mRNA was detectable in neuronal or astrocytic cultures derived from these mice.
The BL/6N-Tg(RP24-114E20P2X7451P-StrepHis-EGFP) BAC transgenic mouse model used in the present study has previously allowed visualization and analysis of P2X7R function within CNS and PNS tissues (Kaczmarek-Hajek et al., 2018). Using commercially-available antibodies and the P2X7-specific nanobody used here (Danquah et al., 2016), the authors demonstrated a glial-specific expression pattern for transgenic P2X7-EGFP that matched that of endogenous receptors in several brain areas, dorsal root ganglion and sciatic nerve. Both the auditory nerve, shown here, and the sciatic nerve (Kaczmarek-Hajek et al., 2018), exhibit P2X7R expression close to nodes of Ranvier. Confocal imaging has previously revealed BzATP-activated Ca2+ entry in SCs adjacent to nodes in intact sciatic nerve preparations (Grafe et al., 1999). This specific localization points to a role for glial P2X7Rs in action potential propagation in the cochlea, and in the wider PNS.
P2X7R detection in cochlear tissues suggests inter-species variations
Qualitative RT-PCR detected P2rx7 mRNA in rat spiral ganglion tissue between P1 and P16 (Brändle et al., 1999). The same study detected P2rx7 mRNA within the organ of Corti from birth, which then underwent downregulation by P16. A study by Nikolic and colleagues employed immunohistochemistry and confocal immunofluorescence to examine P2X7R subunit expression in the rat cochlea (Nikolic et al., 2003). They first detected P2X7Rs in the spiral ganglion around embryonic day (E)18, and then continuously into adulthood, though the identity of the stained cells was not determined. In adult organ of Corti, P2X7 labeling was absent from hair cells themselves, and the remaining signal was restricted to the synaptic region under both hair cell types. Our experiments identified efferent terminals as the source of this signal. An important reservation, though, is the apparent absence of similar labeled synaptic structures in mouse tissues, regardless of our experimental approach. We did not detect P2X7-EGFP fluorescence anywhere within the organ of Corti of the BL/6N-Tg(RP24-114E20P2X7451P-StrepHis-EGFP) transgenic mouse, or when using the 7E2-rblgG nanobody in wild-type mouse cochlea. Our data may indicate inter-species differences between rats and mice. P2X7R expression in retinal Müller cells is species dependent (Reichenbach and Bringmann, 2016). P2X7Rs have been immunolocalized to guinea pig OHCs (Szücs et al., 2004; Zhao et al., 2005), but we suggest P2X7Rs have no direct role to play in OHC function in either mice or rats.
Purinergic responses in cochlear glia display functional signatures of P2X7Rs
BzATP-activated currents with distinct kinetic properties in cultured rat SGNs and glia. Hetero-multimeric receptors composed of P2X2 and P2X3 subunits are proposed to mediate the desensitizing purinergic responses in SGNs (Salih et al., 2002; Greenwood et al., 2007). Similar receptors have been observed in the ventral cochlear nucleus (Jovanovic et al., 2017). In the present study, BzATP-activated currents with comparable kinetic behavior were observed in SGNs, and the BzATP concentration used here is known to maximally activate recombinant P2X2/P2X3 heteromers (Bianchi et al., 1999). Greenwood and colleagues reported that P2rx7 mRNA was detectable in individual rat SGNs between P0 and P14 (Greenwood et al., 2007). However, SGNs expressed P2rx2 and P2rx3 transcripts at much higher copy numbers, suggesting P2X7Rs would make only a small net contribution to any neuronal response.
In our glial experiments, 10 μm BzATP activated non-desensitizing currents that grew in amplitude on repetitive application, a known characteristic of rodent P2X7Rs. A lack of subtype-selective agonists is a challenge to the characterization of ionotropic purinergic responses. We used BzATP at a concentration that activates P2X1Rs, P2X2Rs, P2X3Rs, P2X2/3Rs, and P2X4Rs (Bianchi et al., 1999; Donnelly-Roberts et al., 2009). However, selective antagonists can confirm the contributing subtypes unequivocally. A-740003 or JNJ-47965567 blocked the majority of glial BzATP-activated currents here. A-740003 is a competitive antagonist at recombinant P2X7Rs (pIC50 values, 7.4 for human and 7.7 for rat), and at the concentrations used here (0.1–1 μm) it has little or no inhibitory effect at other P2 receptors, including P2X2Rs, P2X4Rs, P2Y1Rs, and P2Y2Rs (Honore et al., 2006). JNJ-47965567 is centrally permeable in vivo, and it too shows little speciation in its antagonism of P2X7Rs in vitro (Bhattacharya et al., 2013). At the submaximal concentration used in our patch-clamp experiments (100 nm) it blocks ∼75% of recombinant P2X7R activity, but is much less effective at P2X2Rs (6%), P2X2/3Rs (10%), and P2X4Rs (14%). The significant effects of both of these antagonists on our cultured cochlear glia (∼90% block) confirm that P2X7Rs mediated the bulk of the BzATP-mediated currents.
Prolonged BzATP application to cultured glia gated a non-desensitizing current, sustained Ca2+ influx and the formation of pores permeable to YO-PRO-1, all signatures of P2X7R activation (North, 2002; Bartlett et al., 2014). In a large majority of glia, the BzATP-mediated rises in intracellular [Ca2+] were largely reliant on external Ca2+, consistent with the activation of ionotropic receptors. We cannot be certain the effects of BzATP on Ca2 signaling are entirely P2X7R-specific. In addition to its promiscuity between P2XR subtypes, BzATP activates rat P2Y2Rs (Wildman et al., 2003). UTP, an agonist for various P2YRs (von Kügelgen and Hoffmann, 2016), but not P2X7Rs (Donnelly-Roberts et al., 2009), activated transient increases of intracellular [Ca2+] in our cultured glia, an effect independent of extracellular Ca2+. Our data suggest that P2X7Rs and P2YRs co-exist in cochlear glia, as seen elsewhere in the PNS (Grafe et al., 1999). The increased current amplitude and the uptake of YO-PRO-1 during prolonged agonist exposure suggest that P2X7Rs in cochlear glia may mediate uptake or release of large molecules in vivo. Pore activation in other cell types is implicated in a number of disease-associated mechanisms (Illes et al., 2017; Miras-Portugal et al., 2017; Jimenez-Mateos et al., 2019; Kanellopoulos and Delarasse, 2019).
In summary, using a variety of experimental approaches we show that multimodal P2X7Rs are functionally expressed in peripheral cochlear glial cells, but also that they are unlikely to contribute to hair cell or afferent neuronal function. It remains to be determined whether cochlear P2X7Rs are activated under physiological conditions, or whether they only contribute to ATP-dependent pathophysiological mechanisms downstream of damaging stimuli in vivo. Given the apparent similarity in P2X7R expression across several PNS systems, particularly adjacent to nodes of Ranvier, defining a specific role for them in nerve homeostasis is a priority. An improved understanding of their actions under a variety of conditions would help confirm their candidacy as therapeutic targets in a number of peripheral neuropathies.
Footnotes
S.P. held a Studentship from Action on Hearing Loss (RNID, S42). This work was supported by United Kingdom Biotechnology and Biological Sciences Research Council Grants BB/M019322/1 (to D.J.J.) and BB/R000549/1 (to D.J.J. and J.E.G.), the Science Foundation Ireland Grant 17/CDA/4708 (to T.E.), and the Deutsche Forschungsgemeinschaft Grant 335447717-SFB 1328, A15 (to A.N.).
The authors declare no competing financial interests.
- Correspondence should be addressed to Daniel J. Jagger at d.jagger{at}ucl.ac.uk


