

Abstract
Hyperglycemia is a key determinant for development of diabetic retinopathy (DR). Inadequate glycemic control exacerbates retinopathy, while normalization of glucose levels delays its progression. In hyperglycemia, hexokinase is saturated and excess glucose is metabolized to sorbitol by aldose reductase via the polyol pathway. Therapies to reduce retinal polyol accumulation for the prevention of DR have been elusive because of low sorbitol dehydrogenase levels in the retina and inadequate inhibition of aldose reductase. Using systemic and conditional genetic inactivation, we targeted the primary facilitative glucose transporter in the retina, Glut1, as a preventative therapeutic in diabetic male and female mice. Unlike WT diabetics, diabetic Glut1+/− mice did not display elevated Glut1 levels in the retina. Furthermore, diabetic Glut1+/− mice exhibited ameliorated ERG defects, inflammation, and oxidative stress, which was correlated with a significant reduction in retinal sorbitol accumulation. Retinal pigment epithelium-specific reduction of Glut1 did not prevent an increase in retinal sorbitol content or early hallmarks of DR. However, like diabetic Glut1+/− mice, reduction of Glut1 specifically in the retina mitigated polyol accumulation and diminished retinal dysfunction and the elevation of markers for oxidative stress and inflammation associated with diabetes. These results suggest that modulation of retinal polyol accumulation via Glut1 in photoreceptors can circumvent the difficulties in regulating systemic glucose metabolism and be exploited to prevent DR.
SIGNIFICANCE STATEMENT Diabetic retinopathy affects one-third of diabetic patients and is the primary cause of vision loss in adults 20-74 years of age. While anti-VEGF and photocoagulation treatments for the late-stage vision threatening complications can prevent vision loss, a significant proportion of patients do not respond to anti-VEGF therapies, and mechanisms to stop progression of early-stage symptoms remain elusive. Glut1 is the primary facilitative glucose transporter for the retina. We determined that a moderate reduction in Glut1 levels, specifically in the retina, but not the retinal pigment epithelium, was sufficient to prevent retinal polyol accumulation and the earliest functional defects to be identified in the diabetic retina. Our study defines modulation of Glut1 in retinal neurons as a targetable molecule for prevention of diabetic retinopathy.
Introduction
Hyperglycemia is a primary risk factor for the development of diabetic retinopathy (DR) (R. Lee et al., 2015; Lima et al., 2016; Sabanayagam et al., 2016). Increased glucose metabolism and retinal polyol accumulation are key pathologic features of DR (Gabbay, 1973; Asnaghi et al., 2003; Dagher et al., 2004) and directly contribute to DR via the generation of reactive oxygen species and advanced glycation end products, a reduction in pools of reduced glutathione, and increased retinal osmolarity (Lorenzi, 2007). However, successful therapies targeting glucose and polyol breakdown have been elusive. Inhibition of the two key metabolic enzymes in the polyol pathway, aldose reductase and sorbitol dehydrogenase, has not been possible because of an inability to find a balance between efficacy and tolerance with currently available therapeutics. Since altered retinal function (Aung et al., 2013; Samuels et al., 2015), increased oxidative stress and inflammation (Y. Du et al., 2003; Al-Kharashi, 2018), and neurodegeneration (van Dijk et al., 2012; Sohn et al., 2016) are each found at early time points of hyperglycemia (Robinson et al., 2012) and are refractive to reductions in retinal glucose and polyols (Obrosova et al., 2003; Sun et al., 2006), we sought to identify an alternative mechanism to inhibit polyol accumulation and prevent DR.
Glut1 (encoded by Slc2a1) is the primary facilitative glucose transporter for the retina/retinal pigment epithelium (RPE) (Rizzolo, 1997). It is localized to both the apical and basal membranes of the RPE, and throughout the retina, including rod and cone photoreceptors, retinal ganglion cells, and Müller glia (Kumagai et al., 1994). Previous studies demonstrate that reduction of Slc2a1 levels in the retina with siRNA (Lu et al., 2013; You et al., 2017) or pharmacological inhibition of Glut1 (You et al., 2018) decreased retinal pathophysiology in the streptozotocin (STZ) mouse model of diabetes. However, these studies did not identify the key molecular components involved in mediating this effect.
We previously correlated the time course and extent of ERG defects in STZ-induced diabetic mice with hyperglycemia (Samuels et al., 2015). Reduced ERG amplitudes and increased ERG latencies occur before structural changes to the retina and are predictive of microaneurysm development and DR severity (Ng et al., 2008; Ratra et al., 2020). Molecular targets that prevent ERG defects could be used for preventative or interventional therapies. Herein, we first investigated whether Slc2a1 expression and/or Glut1 protein levels in the retina and RPE were significantly different at early DR stages that exhibit ERG defects. We report that DR is associated with elevated retinal Glut1 levels, without changes in expression of Slc2a1 or other glucose transporters. We next used a genetic approach to reduce Glut1 and found that systemic Glut1 haploinsufficiency in Glut1+/− mice protected against DR phenotypes, including altered ERG, polyol accumulation, and increased retinal oxidative stress and inflammation. The protection was retina-specific, as reduction of Glut1 in retinal neurons and Müller glia cells conferred a similar protection against DR while reduction of Glut1 in the RPE did not. These data demonstrate that, although the RPE serves to supply the retina with glucose for proper retinal homeostasis, manipulation of Glut1 levels in the retina, but not the RPE, is a valuable target for therapies to prevent and treat DR. Moreover, reduction of retinal sorbitol and prevention of DR can be achieved by modulation of Glut1 rather than manipulation of key enzymes in glucose metabolism.
Materials and Methods
Ethical approval
Treatment of animals followed the ARVO Resolution on Treatment of Animals in Research, and all animal procedures were approved by the Institutional Animal Care and Use Committee of the Louis Stokes Cleveland VA Medical Center.
Mice
Glut1+/− mice were kindly provided by D.C.D.V. (Columbia University), VMD2Cre/+ mice by Joshua Dunaief (University of Pennsylvania), CrxCre/+ mice by Sujata Rao (Cleveland Clinic; currently available from Riken, BRC #RBRC05426), and Glut1flox mice by E. Dale Abel (University of Iowa; currently available from The Jackson Laboratory, #031871). C57Bl/6J were purchased from The Jackson Laboratory (#000664). At 6-8 weeks of age, in both male and female mice, diabetes was induced by three sequential daily intraperitoneal injections of a freshly prepared solution of STZ in 0.1 m citrate buffer, pH 4.4, at 30 mg/kg body weight. In the STZ group, insulin (0-0.2 units of neutral protamine Hagedorn, Humulin N, Eli Lilly) was given by intraperitoneal injection every other day, as needed after hyperglycemia, to prevent ketosis without preventing hyperglycemia and glucosuria. Nondiabetic control (CNTL) mice received citrate buffer only and did not receive insulin.
Experimental design and statistical analysis
For all analyses, data were compiled as mean ± SEM or SD as indicated in the figure legends, and statistics were performed on GraphPad Prism 6 using non–repeated-measures, one-way or two-way ANOVA with Tukey post hoc analysis (GraphPad). Statistical significance was determined by achieving a p value for both the ANOVA and multiple comparisons test <0.05. Full details for each experiment, including group numbers, statistical tests, and test values, are included in Table 1.
Full details for each experiment
Genotyping
The Slc2a1 allele was identified by genotyping with the following primers: SF3, 5′-CCA TAA AGT CAG AAA TGG AGG GAG GTG GTG GT-3′; E1R, 5′-GCG AGA CGG AGA ACG GAC GCG CTG TAA CTA-3′; and NR, 5′-CTA CCG GTG GAT GTG GAA TGT GTG CGA GGC-3′. The floxed Slc2a1 allele was identified by genotyping with the following primers: FRT forward, 5′-CTC CAT TCT CCA AAC TAG GAA C-3′; FRT reverse, 5′-GAA GGC ACA TAT GAA ACA ATG-3′; 2.85F,5′-CTG TGA GTT CCT GAG ACC CTG-3′; and 2.9 reverse, 5′-CCC AGG CAA GGA AGT AGT TC-3′. The presence of Cre recombinase was identified by genotyping with the following primers: Cre forward, 5′-TGC CAC GAC CAA GTG ACA GCA ATG-3′; Cre reverse, 5′-ACC AGA GAC GGA AAT CCA TCG CTC-3′.
Electroretinography
After overnight dark adaptation, mice were anesthetized with 65 mg/kg sodium pentobarbitol. Eye drops were used to anesthetize the cornea (1% proparacaine HCl) and to dilate the pupil (2.5% phenylephrine HCl, 1% tropicamide, and 1% cyclopentolate HCl). Mice were placed on a temperature-regulated heating pad throughout the recording session, which was performed as previously described (Samuels et al., 2015). Amplitude of the a-wave was measured at 8.3 ms following the stimulus. Amplitude of the b-wave was calculated by summing the amplitude of the a-wave at 8.3 ms with the peak of the waveform after (≥40 ms) the high-frequency oscillatory potentials (OPs). Light-adapted response amplitudes were calculated by summing the peak of the waveform with the amplitude at 8.3 ms. OP amplitude of each wavelet was measured from the preceding trough to the peak of each potential. Amplitude of the c-wave was determined by subtracting the average baseline amplitude from the maximal response following the b-wave.
Histology and light microscopy
Enucleated eyes were fixed in 0.1 m sodium cacodylate buffer, pH 7.4, containing 2% formaldehyde and 2.5% glutaraldehyde. The tissues were then osmicated, dehydrated though a graded ethanol series, plasticized in acetonitrile, and embedded in epoxy resin (Embed-812/DER73 Epon kit; Electron Microscope Services). Semi-thin sections (0.8 µm) were cut along the horizontal meridian through the optic nerve and stained with 1% toluidine blue O for evaluation. Photomicrographs were taken of sections traversing the optic nerve. The distance from the outer limiting membrane to the inner limiting membrane was measured in three sections per animal and averaged for a minimum of 3 animals per group using ImageJ software. Additional photomicrographs were taken 250 µm from the optic nerve, and the length of the outer segment, inner segment, and outer nuclear layer was measured in three equidistant areas per section per animal. Thickness of RPE was also measured at 3100× magnification from three sections of each mouse.
Immunohistochemistry
After mice were killed and enucleated, eyes were fixed in 0.1 m sodium PB, pH 7.4, containing 4% PFA. After removal of the cornea and lens, the posterior pole was immersed through a graded series of sucrose solutions as follows: 10% for 1 h, 20% for 1 h, and 30% overnight. Eyes were embedded in OCT freezing medium, flash frozen on powderized dry ice, and immediately transferred to −80°C. Tissue was sectioned at 10 µm thickness at −30°C, mounted on superfrost slides, and stored at −80°C until processed. Sections were blocked in 0.1% Triton X-100, 1% BSA, and 5% normal goat serum in PBS for 1 h at room temperature and then washed 3 times with PBS for 5 min each time. The sections were incubated overnight at 4°C with the primary antibody. Sections were rinsed with PBS 3 times for 10 min each time and incubated with secondary antibody (Alexa-488 or Alexa-594, 1:500; Invitrogen) for 1 h at room temperature. After rinsing sections 3 times for 10 min each time with PBS, sections were mounted with DAPI (1:10,000 in 50% glycerol:PBS). Primary antibodies used were rabbit anti-Glut1 (Millipore, #07-1401, 1:500), or mouse anti-Glut1 (Abcam #ab40084, 1:100). Imaging was performed using a laser scanning confocal microscope (TCSSP2, Leica Microsystems).
Western blotting
Retinas were lysed on ice for 10 min in lysis buffer (20 mm HEPES, 150 mm NaCl, 1.5 mm NgCl2, 2 mm EGTA with 0.5% Triton X-100) containing protease inhibitors (Roche, #5892970001) and phosphatase inhibitors (10 mm NaF, 1 mm PMSF, 1 mm Na3(VO3)4, 12.5 mm β-glycerophosphate, and 2 mm DTT) followed by sonication. Protein concentration was determined by 660 nm BCA Assay (Thermo Fisher Scientific, #22660), and equivalent amounts of reduced protein (6× Laemelli sample buffer with 5% beta-mercaptoethanol) were separated by SDS-PAGE on 4%-15% acrylamide gels. Proteins were transferred to PVDF membranes, which were blocked with Intercept blocking buffer and imaged using IRDye 800CW goat anti-rabbit and 680 goat anti-mouse secondary antibodies (Li-Cor Biosciences, 1:10,000). Primary antibodies used included the following: Rb anti-Glut1 (Millipore, #07-1401, 1:2000) and Mo anti-actin (Cell Signaling Technology, #3700S, 1:1000). PVDF membranes were scanned with an Odyssey infrared scanner, and densitometry was performed using LiCor Image Studio Software.
Oxidative stress
Reactive oxygen species were measured in retinal cryosections by dihydroethidium (DHE) staining. Eyes were dissected on ice-cold PBS and frozen in OCT embedding buffer within 15 min of enucleation. Fresh frozen retinal cryosections spanning the optic nerve were incubated with DHE (Thermo Fisher Scientific, 1:5000) for 20 min followed by counterstaining with DAPI (1:10,000). Quantification of reactive oxygen species was calculated using National Institutes of Health ImageJ software.
qPCR
Gene expression of glucose transporters, aldose reductase, inflammatory cytokines, and oxidative stress mediators was measured by qPCR on dissected retinal tissue. RNA was extracted using the RNAeasy Mini Kit (QIAGEN, #74104), and RT-PCR was performed using the Verso cDNA synthesis kit (Thermo Fisher Scientific, #AB1453A). Radiant Green 2× qPCR Lo-ROX enzyme was used for all qPCR. Relative fold changes in gene expression were determined using the comparative Ct method (2ΔΔCt method). For all analyses, β-actin was used as the reference gene. HIF-1α (#QT01039542) and VEGF (#QT00160769) were analyzed using primers from QIAGEN. Primers for all other genes investigated are listed in Table 2.
Primers
Gas chromatography-mass spectrometry
As previously described (Singh et al., 2020), for each mouse, both retinas were dissected on ice-cold HBSS and flash frozen. To each tube, 500 µl of −20°C 80% methanol was added with 20 µl of 0.05 mg/ml of [13C5] ribitol as internal standard. Metabolites were extracted by sonication. Samples were then centrifuged at 15,000 × g for 5 min at 4°C. After centrifugation, 300 µl of supernatant was transferred to fresh tube. Samples were dried overnight in a −4°C vacuum evaporator. Dried samples were first derivatized by adding 25 µl of 40 mg/ml methoxyamine in pyridine and then incubating on a thermomixer at 45°C for 30 min with 1000 rpm shaking speed. Samples were then additionally derivatized by adding 75ul of MSTFA + 1% TMCS and incubating on thermomixer as in the first step. One microliter of each sample was injected into the 7890B GC connected to 5977 MSD Agilent GC/MS system. Injections were made in splitless or split 15 mode. GC column used was DB-5 ms 30 m × 0.25 mm × 0.25 µm with DuraGuard 10 m. Front inlet was set at 250°C with septum purge flow of 3 ml/min of helium. Samples were analyzed in a constant flow mode with helium set to 1.1 ml/min. GC method was 1 min at 60°C, followed by 10°C/min increments until 325°C and finally held at 325°C for 10 min. Metabolites were measured in full scan mode using electron ionization with a scan window from 50 to 800 m/z. Solvent delay of 6.6 min was applied. Sorbitol was distinguished from mannitol using retention time. The extracted ion chromatogram m/z 319 of mannitol and sorbitol authentic standards revealed a baseline separation of these compounds on the GC column.
Results
Hyperglycemia-induced elevations in retinal Glut1 are not found in diabetic Glut1+/− mice
It is widely accepted that functional defects in the light-evoked responses of the retina occur in rodent models of diabetes (Aung et al., 2013; Samuels et al., 2015) and in diabetic patients (Greenstein et al., 1993; Tyrberg et al., 2011; Bearse and Ozawa, 2014; Ratra et al., 2020), both of which also demonstrate a correlation with hyperglycemia and increased polyol accumulation (Gabbay, 1973; Dagher et al., 2004; Lorenzi, 2007). Because of the association between onset of ERG defects and hyperglycemia, we first investigated whether Glut1 levels differed between diabetic and nondiabetic mice at early time points. Confocal imaging demonstrated that, in STZ-induced diabetic mice, Glut1 levels were increased throughout the retina, and notably in the inner segments and outer nuclear layer compared with the nondiabetic CNTL mice (Fig. 1A). Quantitative proteomics confirmed a significant increase in retinal Glut1 levels in both male and female diabetic C57Bl/6J mice at 3 weeks of diabetes [females: average linear ratio = 2.519; average Ln ratio = 0.924; moderated p = 6.1 × 10⁻³; moderated adjusted p = 6.1 × 10⁻³; 4 of 4 mice; males: average linear ratio = 2.020; average natural log ratio (Ln ratio) = 0.703; moderated p = 1.3 × 10⁻²; moderated adjusted p = 3.3 × 10⁻²; 4 of 4 mice (elevations ≥ 2 SD; B. Anand-Apte, personal communication)]. Based on reports that acute reduction of Glut1 in the retina (Slc2a1) via siRNA injection or pharmaceutical inhibition (forskolin) reduced hallmarks of DR (Lu et al., 2013; You et al., 2017; You et al., 2018), we hypothesized that a similar benefit would be seen in diabetic Glut1+/− mice, which exhibit a systemic 50% reduction in Glut1 by virtue of expressing a single Slc2a1 allele. Nondiabetic Glut1+/+ and Glut1+/− CNTL mice display indistinguishable morphology (Fig. 2), similar body weights (Fig. 3A), and identical light-evoked responses of the retina (ERG; Fig. 3, C–F). Glut1+/+ and Glut1+/− mice also exhibit comparable STZ-induced increases in blood glucose levels (Fig. 3B). Confocal microscopy of retinal cryosections from Glut1+/+ and Glut1+/− mice stained with an anti-Glut1 antibody (green) confirmed that 4 week diabetic (STZ) Glut1+/+ mice exhibited elevated Glut1 in the retina and RPE compared with nondiabetic (CNTL) Glut1+/+ mice (Fig. 1B). As expected, CNTL Glut1+/− retinas displayed significantly lower Glut1 levels in the retina and RPE than the Glut1+/+ mice (Fig. 1C). Additionally, while Glut1 was upregulated in Glut1+/+ STZ mice, a similar increase was not observed in Glut1+/− STZ retinas. Quantification of retinal Glut1 levels in each group by Western blot analysis confirmed a 2.15-fold increase of retinal Glut1 in WT diabetics (Fig. 1C,D). However, no significant difference was found in retinal Glut1 levels between diabetic and nondiabetic Glut1+/− mice, and diabetic Glut1+/− mice had 0.4-fold lower Glut1 levels compared with diabetic Glut1+/+ mice (Fig. 1D; F(3,8) = 11.67, p = 0.0027).

Retinal Glut1 protein levels are not elevated in diabetic Glut1+/− mice. A, Glut1 immunoreactivity (red) in confocal images taken from WT control and STZ-injected mice following 4 weeks of diabetes. Scale bar, 50 µm. RPE, Retinal pigmented epithelium; OS, outer segments; IS, inner segments; ONL, outer nuclear layer; OPL, outer plexiform layer; INL, inner nuclear layer; IPL, inner plexiform layer; RGC, retinal ganglion cell layer. B, Confocal images of Glut1 immunoreactivity in cryosections following 4 weeks of diabetes. Scale bar, 50 µm. C, Protein levels of Glut1 from dissected retinas following 4 weeks of diabetes. Retinas were dissected, and total Glut1 levels were normalized to β-actin for quantitative analysis. Data are mean ± SEM. n ≥ 3 in each group. *p ≤ 0.05. **p ≤ 0.001.

Glut1+/− mice exhibit normal retinal morphology. A, Representative light photomicrographs of semithin plastic sections stained with Toluidine blue O from nondiabetic (CNTL) and diabetic (STZ) mice after 4 weeks of diabetes. Scale bar, 50 µm. OS, Outer segments; IS, inner segments; ONL, outer nuclear layer; INL, inner nuclear layer; RGC, retinal ganglion cell layer. B-F, Cell layers were measured from three locations in each image. At least three images per mouse were analyzed.

Glut1+/− mice display normal ERG and responses to diabetes. A, Body weight of nondiabetic and diabetic Glut1+/− and littermate control mice was measured after 4 weeks of diabetes. No differences in weight were identified. B, Mice were fasted for ≥7 h, and blood glucose levels were measured with a OneTouch Ultra glucometer. No difference in magnitude of hyperglycemia was observed. C-F, Strobe flash ERG was performed on nondiabetic Glut1+/+ and Glut1+/− mice at 8 weeks of age, before induction of diabetes. C, Representative strobe flash ERG waveform traces evoked in response to a 1.4 log cd.s/m2 light stimulus. D, Luminance-response functions for the a-wave and b-wave. E, Representative light-adapted ERG waveform traces evoked by a 1.4 log cd.s/m2 light stimulus superimposed over the adapting field. F, Luminance-response function for the light-adapted response. No differences in retinal function were found between genotypes.
Analysis of mRNA expression of Glut1 in the retina of each cohort of mice (normalized to β-actin) verified a significant reduction in Slc2a1 expression in Glut1+/− mice compared with Glut1+/+ littermates (Table 3; F(3,10) = 8.898, p = 0.0035), while no significant differences in Slc2a1 were found between control and diabetic Glut1+/− mice. And, as previously reported (Fernandes et al., 2004), no significant change in Slc2a1 mRNA expression was found as a result of diabetes (Table 3; Glut1+/+ CNTL vs STZ and Glut1+/− CNTL vs STZ). Analysis of other retinal glucose transporters demonstrated that there was also no significant change in expression of Glut3/Slc2a3, Glut4/Slc2a4, Glut8/Slc2a8, or Glut12/Slc2a12 in the retina of each cohort of mice after 4 weeks of diabetes (Table 3). These data illustrate that diabetes does not affect mRNA expression of glucose transporters in the retina, and that reduction of Slc2a1 levels was not compensated for by an increase in expression of other glucose transporters.
Diabetes does not alter expression of glucose transporters in the retinaa
Reduction of Glut1 normalizes polyol accumulation, retinal dysfunction, and increased inflammation/oxidative stress
Since diabetic Glut1+/− mice exhibited similar levels of retinal Glut1 as nondiabetic Glut1+/+ mice, we sought to determine whether glucose transport and metabolism in the retina were modulated in the Glut1 heterozygotes. Concentration of retinal glucose and glucose metabolites was measured by GC/MS in mice fasted for ≥7 h. Although overt systemic hyperglycemia was observed by analysis of blood glucose levels (Fig. 3B; F(3,20) = 56, p < 0.0001), no difference in retinal glucose levels between genotypes or treatment was identified (Fig. 4B; F(3,20) = 1.2, p = 0.3486). A significant increase in retinal sorbitol was identified in diabetic Glut1+/+ mice, which was significantly mitigated in diabetic Glut1+/− mice (Fig. 4C; F(3,20) = 98, p < 0.0001). Sorbitol and mannitol are isomers and have very similar EI mass spectra. Using our GC/MS method, we were able to discern the identity of the polyol peaks by chromatographic separation to verify the increase in sorbitol. Interestingly, while there was no change in retinal fructose levels (Fig. 4D; F(3,20) = 1.7, p = 0.2031), the lactate:pyruvate ratio was slightly higher in the Glut1+/+ diabetic mice compared with Glut1+/− diabetics, but not any other group (Fig. 4E; F(3,20) = 5.0, p = 0.0097). These results demonstrate that the polyol branch of glucose metabolism had normal metabolite levels in Glut1+/− retinas and that reduction of Glut1 diminished retinal polyol accumulation.
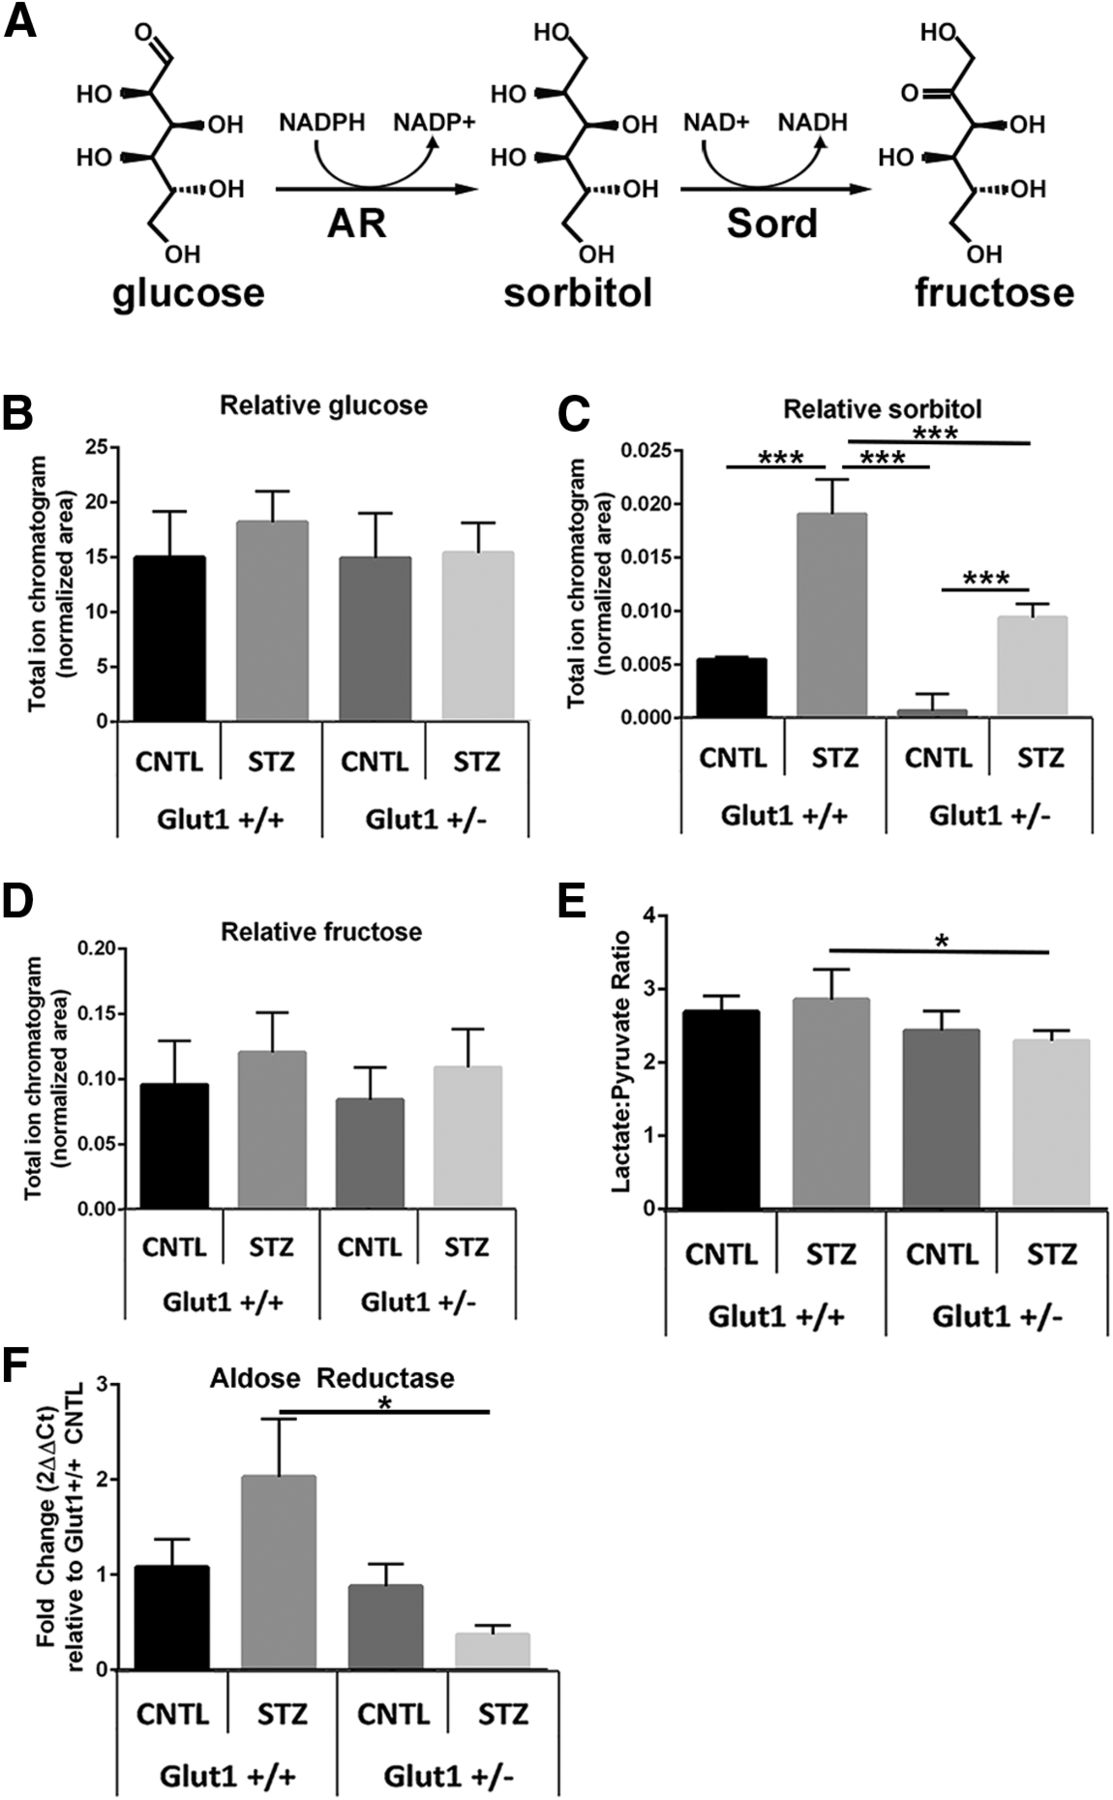
Systemic reduction of Glut1 in diabetic mice reduces retinal polyol accumulation. A, Glucose is metabolized to sorbitol by aldose reductase (AR), which is abundantly expressed in the retina. Sorbitol catabolism to fructose occurs via sorbitol dehydrogenase (Sord), which is present in extremely low levels in the retina. B-D, GC/MS was used to perform metabolomics on retinas from fasted mice at 4 weeks of diabetes. Relative quantities of glucose (B), sorbitol (C), and fructose (D) were normalized to 13C5-ribitol for comparison between genotypes. E, The lactate:pyruvate ratio was calculated as a surrogate for measurement of cytosolic NADH/NAD+. Data are mean ± SD. n = 6 for each group. *p ≤ 0.05. ***p ≤ 0.0001. F, Expression of aldose reductase was measured by qPCR. Relative fold change in Akr1b3 expression was determined using the comparative Ct method (2ΔΔCt method), normalized to expression of β-actin and compared with expression in the Glut1+/+ CNTL retina.
Because less sorbitol was also observed in the Glut1+/− CNTL retina compared with the Glut1+/+ CNTL, we evaluated aldose reductase expression. Interestingly, we found a trend for increased Akr1b3/Aldose reductase in the Glut1+/+ STZ retina, but it was only significantly increased compared with the Glut1+/− STZ retina. This suggests that the elevation in Glut1 found in the WT diabetic mouse increased the requirement for conversion of glucose to sorbitol, but the effect was not present in the Glut1+/− diabetic retina.
We used ERGs to determine whether the normalization of retinal sorbitol content correlated with physiology. ERG defects are frequently observed before cell loss or the development of structural changes in the retina so we focused on early time points (2 and 4 weeks of diabetes). Glut1+/− mice displayed normal ERG waveforms at baseline (6-8 weeks of age, before STZ injections; Fig. 3C-F), and no differences were observed between nondiabetic Glut1+/+ and Glut1+/− mice at 2 or 4 weeks after saline injections (Fig. 5). Vision is also clinically spared in patients with Glut1 deficiency syndrome. In line with our previous findings (Samuels et al., 2015), significant reductions in both a- and b-wave amplitudes were present across all stimulus levels in diabetic Glut1+/+ mice (Fig. 5A-F; 2 week a-wave: F(3,210) = 20.76, p < 0.0001; 4 week a-wave: F(3,195)= 40.04, p < 0.0001; 2 week b-wave: F(3,420)= 59.65, p < 0.0001; 4 week b-wave: F(3,390) = 112.5, p < 0.0001). Representative strobe flash waveforms generated by a 1.4 log cd.s/m2 stimulus are shown in Figure 5A, D. Luminance response functions of the a- and b-wave are presented in Figure 5B, C and Figure 5E, F. While the ERGs of Glut1+/+ mice were severely affected by diabetes, no significant defects in the a- or b-wave were found in response to any light stimulus in diabetic Glut1+/− mice at either time point (for full two-way ANOVA and Tukey post hoc analysis, see Table 1).

Systemic reduction of Glut1 ameliorates diabetes-induced reductions in ERG component amplitudes. A-C, Representative strobe flash ERG waveform traces evoked in response to a 1.4 log cd.s/m2 light stimulus and luminance-response functions for the a-wave and b-wave after 2 weeks of diabetes. D-F, Representative strobe flash ERG waveform traces evoked in response to a 1.4 log cd.s/m2 light stimulus and luminance-response functions for the a-wave and b-wave after 4 weeks of diabetes. Amplitude of the a-wave was measured at 8.3 ms following the flash stimulus. Amplitude of the b-wave was measured by summing the amplitude of the a-wave with the peak of the response following the OPs (≥40 ms). G, Representative traces of filtered OPs from strobe flash ERGs evoked by a 1.4 log cd.s/m2 flash stimulus at 2 and 4 weeks of diabetes. H, I, Average amplitude of OP1-3 at 2 and 4 weeks of diabetes. Amplitude was measured from the minimum of the preceding trough to the peak of the potential. J, Representative light-adapted waveform traces generated by a 1.4 log cd.s/m2 flash stimulus. Light-adapted response amplitudes were calculated by summing the peak of the waveform with the amplitude at 8.3 ms. K, L, Average amplitude of the light-adapted response at 2 and 4 weeks of diabetes. M, Representative waveforms induced by a 5 cd/m2 white stimulus for 10 s. N, O, Average amplitude of the c-wave at 2 and 4 weeks of diabetes. Amplitude of the c-wave was determined by subtracting the average baseline amplitude from the maximal response following the b-wave. Data are mean amplitude ± SEM for each flash stimulus, except for the c-wave, which indicates mean ± SD. n ≥ 3 in each group. *p ≤ 0.05. **p ≤ 0.001. ***p ≤ 0.0001.
OPs were filtered from the 1.4 log cd.s/m2 waveform traces at each time point for analysis of this characteristic defect commonly found in diabetic rodents and patients even after only short durations of diabetes (Bresnick et al., 1984; Bresnick and Palta, 1987; Pardue et al., 2014). While no differences in OP latencies based on genotype or diabetes status were found (Table 4), we identified a significant reduction in OP amplitudes in diabetic Glut1+/+ mice, which was not present in diabetic Glut1+/− mice (Fig. 5G-I; 2 week OP1: F(3,28) = 7.353, p = 0.0009; 2 week OP2: F(3,28) = 2.691, p = 0.0653; 2 week OP3: F(3,28) = 2.990, p = 0.0478; 4 week OP1: F(3,31) = 6.530, p = 0.0015; 4 week OP3: F(3,31) = 5.322, p = 0.0045). Therefore, in addition to preventing reductions in the a- and b-wave amplitude, systemic lowering of Glut1 also prevented OP amplitude defects. The light-adapted ERG response was also measured and revealed that diabetic Glut1+/− mice did not exhibit the significant defects in this parameter seen in Glut1+/+ mice (Fig. 5J-L; 2 week: F(3,252) = 13.76, p < 0.0001; 4 week: F(3,234) = 29.16, p < 0.0001). Finally, the RPE-dependent c-wave amplitude was measured in each cohort of mice at both time points. RPE-dependent responses are measured in patients using the electro-oculogram. The electro-oculogram waveform component is sensitive to glucose and altered in diabetic patients with and without retinopathy (Schneck et al., 2008). Representative c-wave tracings from mice at 2 and 4 weeks of diabetes are shown in Figure 5M. Diabetes significantly reduced the c-wave of Glut1+/+ mice, whereas diabetic Glut1+/− mice exhibited a less profound defect (Fig. 5N,O; 2 week: F(3,60) = 15.67, p < 0.0001; 4 week: F(3,53) = 8.232, p = 0.0001).
Diabetes does not alter OP latency regardless of Glut1 genotype at early time points
Retinal inflammation and oxidative stress are characteristic pathologic features associated with early states of diabetes, reflecting the overproduction of superoxide and reactive oxygen species (Baynes, 1991; Y. Du et al., 2003; Al-Kharashi, 2018). As such, we investigated whether systemic reduction of Glut1 and mitigated retinal polyol accumulation were also associated with lower levels of these markers in DR. Superoxide production was determined by staining fresh frozen retinal sections with DHE (Fig. 6A). When oxidized, DHE intercalates with DNA and produces a red fluorescence in the nucleus. Most of the superoxide (red fluorescence) was localized to the outer nuclear layer and the RPE (asterisks). However, because of the unfixed frozen tissue, small amounts of red fluorescence were sometimes also found outside of the nucleus (arrows). Quantification of total corrected cell fluorescence identified a twofold increase in retinal superoxide in Glut1+/+ mice, whereas there was no significant increase in DHE in Glut1+/− mice (Fig. 6B; F(3,12) = 30.73, p < 0.0001). Furthermore, qPCR of oxidative stress mediators, Nos2 (Fig. 6C; F(3,12) = 13.95, p = 0.0003) and Cox2 (Fig. 6D; F(3,8) = 5.924, p = 0.0198); the inflammatory cytokines, IL1-β (Fig. 6E; F(3,8) = 34.22, p < 0.0001) and TNF-α (Fig. 6F; F(3,8) = 52.93, p < 0.0001); and angiogenic mediators, VEGF (Fig. 6G; F(3,8) = 19.00, p = 0.0005) and HIF1α (Fig. 6H; F(3,8) = 13.57, p = 0.0017) from CNTL and STZ retinas of each cohort of mice revealed that systemic reduction of Glut1 was sufficient to prevent the diabetes-induced increase in each of these molecules.

Systemic reduction of Glut1 prevents early elevations in retinal oxidative stress and inflammation. A, Photomicrographs of fresh frozen retinal cryosections from mice at 4 weeks of diabetes probed with DHE (red). Scale bar, 50 µm. B, Quantification of corrected total cell fluorescence. Three separate images from at least 4 animals of each group were analyzed. Data are mean ± SD. C-H, Quantification of oxidative stress mediators and inflammatory cytokines at 4 weeks of diabetes. Relative fold changes in gene expression were determined using the 2ΔΔCt method. All genes were normalized to expression of β-actin and compared with levels in the Glut1+/+ CNTL retina. Data are mean ± SEM. n ≥ 3 for each group. *p ≤ 0.05. **p ≤ 0.001. ***p ≤ 0.0001. Arrows indicate extranuclear DHE staining. Asterisks indicate DHE localization in the RPE.
Attenuation of DR hallmarks persists after 3 months of diabetes in Glut1+/− mice
To evaluate whether reduction of Glut1 mitigated hallmarks of DR following more protracted periods of hyperglycemia, an additional cohort of mice with systemic reduction of Glut1 was maintained for 12 weeks of diabetes. Despite sustained overt hyperglycemia (Fig. 7B) in the STZ groups, there was no significant reduction in body weight of mice in any group (Fig. 7A). Strobe flash ERGs revealed that, compared with Glut1++ STZ mice, diabetic Glut1+/− mice still exhibited normalized a-wave and b-wave amplitudes after 3 months of diabetes (Fig. 7C-E; a-wave: F(3,65) = 43.09, p < 0.0001; b-wave: F(3,130) = 87.66, p < 0.0001). The reduced c-wave amplitude found in Glut1+/+ STZ mice was similarly mitigated in diabetic Glut1+/− mice at the later time point (Fig. 7F,G; F(3,13) = 11.47, p = 0.0006). Analysis of retinal gene expression from these mice after 12 weeks of diabetes revealed that markers of oxidative stress and inflammation, which remained elevated in Glut1+/+ STZ mice, were still at or near control levels in Glut1+/− STZ mice (Fig. 8A-D; IL-1β F(3,8) = 6.38, p = 0.0162, TNFα, F(3,7) = 10.94, p = 0.0049, Cox2, F(3,7) = 21.51, p = 0.0007, Nos2, F(3,8) = 22.48, p = 0.0003). Notably, even after the 12 weeks of diabetes, no other glucose transporter was upregulated to compensate for the reduced Glut1 in Glut1+/− retinas (Table 3). Expression of Slc2a1 (Glut1) in Glut1+/+ STZ retinas was not significantly different from that of the WT CNTL retina, and expression of Glut1+/− CNTL and STZ retinas was 69% and 64% lower, respectively, than the level of Slc2a1 observed in Glut1+/+ CNTL retinas (Table 3; 12 weeks Slc2a1/Glut1; F(3,8) = 6.08, p = 0.0185). These findings suggest that even long-term diabetes does not induce upregulation of Slc2a1/Glut1 mRNA levels in the retina.

ERG defects remain mitigated in Glut1+/− mice after 12 weeks of diabetes. A, Body weight of nondiabetic and diabetic Glut1+/− and littermate control mice was measured after 12 weeks of diabetes. No differences in weight were identified. B, Blood glucose levels were measured with a OneTouch Ultra glucometer at 12 weeks. No difference in magnitude of hyperglycemia in diabetic was observed. C-G, Strobe flash ERG and c-wave recordings were performed on nondiabetic Glut1+/+ and Glut1+/− mice at 12 weeks of diabetes. C, Representative strobe flash ERG waveform traces evoked in response to a 1.4 log cd.s/m2 light stimulus. D, E, Luminance-response functions for the a-wave and b-wave. Component amplitudes were measured as described in Figure 5. F, Representative waveforms induced by a 5 cd/m2 white stimulus for 10 s. G, Average amplitude of the c-wave at 12 weeks of diabetes. Data are mean amplitude ± SEM. n ≥ 3 in each group. *p ≤ 0.05. **p ≤ 0.001. ***p ≤ 0.0001.

Markers of oxidative stress and inflammation are not elevated in Glut1+/− mice even after 12 weeks of diabetes. A-D, Quantification of inflammatory cytokines (A, IL-1β; B, TNF-α) and oxidative stress mediators (C, Cox2; D, Nos2) at 12 weeks of diabetes. Relative fold changes in gene expression were determined using the comparative Ct method (2ΔΔCt method). All genes were normalized to expression of β-actin and compared with expression in the Glut1+/+ CNTL. Data are mean ± SEM. n ≥ 3 for each group. *p ≤ 0.05. **p ≤ 0.001.
Reduction of Glut1 in the RPE does not protect against early markers of DR
Our results indicate that systemic reduction of Glut1 protects against multiple pathologic features of DR. To better understand this protection, we next asked whether reduction of Glut1 in specific cell types would confer a similar protection. We first examined the RPE, where Glut1 is expressed on both the apical and basal membranes (Kumagai et al., 1994) (Fig. 1). RPE-specific Glut1 conditional knockdown (CKD) mice were generated by crossing the VMD2Cre/+ strain with the Glut1flox strain (VMD2 Glut1-CKD). Because of recombination with only one Glut1flox allele, VMD2Cre/+Glut1flox/+ mice effectively recapitulate the Glut1+/− phenotype, except that Glut1 is reduced by 50% only within the RPE. Figure 9A demonstrates VMD2Cre/+-mediated recombination with tdTomato. Nearly all RPE cells exhibited tdTomato expression (red). High-magnification photomicrographs of the boxed areas display the uniform distribution of recombination throughout the epithelium. Compared with Glut1flox/floxVMD2Cre/+ (Glut1m) mice (Swarup et al., 2019), which had moderate levels of patchy Cre expression and induced the complete loss of Glut1 in only ∼50% of RPE cells, the VMD2 Glut1-CKD model had high levels of Cre expression throughout the RPE so that Glut1 was reduced by 50% in most cells because of the deletion of a single Glut1flox allele. Figure 9B, C illustrates the 50% reduction of Glut1 in the RPE by Western blot analysis (F(3,11) = 26.33, p < 0.0001). Like the diabetic Glut1+/− retinas, diabetic VMD2 Glut1-CKD mice exhibited overt systemic hyperglycemia (Fig. 10A; F(3,12) = 24, p < 0.0001), and a trend toward higher retinal glucose levels in the diabetic mice, but no significant differences were found between any groups (Fig. 10B; F(3,15) = 3.5, p = 0.0515). However, high levels of retinal sorbitol (Fig. 10C; F(3,12) = 30, p < 0.0001) remained in both diabetic groups. Although multiple comparison differences did not reach significance, elevated levels of fructose were also observed (Fig. 10D; F(3,12) = 4.2, p = 0.0302). Cytosolic NADH/NAD ratio, as identified by lactate:pyruvate ratios, was also unchanged between groups (Fig. 10E; F(3,12) = 0.83, p = 0.5036). To determine whether reduction of Glut1 in the RPE normalized retinal function despite the presence of polyol accumulation, ERGs were performed on diabetic and nondiabetic VMD2 Glut1-CKD and littermate control mice. In line with a role for glucose and glucose metabolites affecting retinal function, both genotypes exhibited reduced ERG waveform components at 4 weeks of diabetes. Figure 11A depicts representative waveform traces evoked by a 1.4 log cd.s/m2 stimulus flash from each group of mice. The luminance-response functions for the a- and b-wave are shown in Figure 11B, C. Neither waveform component was rescued by the reduction of Glut1 only in the RPE (a-wave: F(3,120) = 12.75, p < 0.0001; b-wave: F(3,200) = 27.25, p < 0.0001). The amplitudes of the OPs (Fig. 11D,E) and the c-wave (Fig. 11F,G; F(3,17) = 8.042, p = 0.0015) were reduced by equivalent amounts in diabetic WT and VMD2 Glut1-CKD mice. These data indicate that reduction of Glut1 in the RPE is not sufficient to mitigate retinal polyol accumulation or retinal dysfunction, which were both abrogated in diabetic Glut1+/− mice.

VMD2 CKD mice exhibit 50% reduction of Glut1 specifically in the RPE. A, Representative images demonstrating the VMD2Cre/+ recombinase-mediated activity in the RPE by recombination with tdTomato (Ai14). Cre expression is found uniformly throughout the RPE but not in the retina. Scale bars: Aa, 100 µm; Ab, 50 µm. B, Protein levels of Glut1 from RPE tissue isolated from retinas following 4 weeks of diabetes. Retinas were removed from the back of the eye, and RPE was isolated in lysis buffer. Glut1 levels were normalized to β-actin. C, Quantitative analysis of Glut1 levels in the RPE. Data are mean ± SEM. n ≥ 4 in each group. *p ≤ 0.05. **p ≤ 0.001. ***p ≤ 0.0001.

Reduction of Glut1 in the RPE does not mitigate elevations in retinal sorbitol. A, At 4 weeks of diabetes, mice were fasted for ≥7 h before analysis of blood glucose levels with a OneTouch Ultra glucometer. B-E, Retinas from fasted VMD2 Glut1-CKD mice were dissected and analyzed by GC/MS after 4 weeks of diabetes. Relative quantities of glucose (B), sorbitol (C), and fructose (D) were normalized to 13C5-ribitol for comparison between genotypes. E, Comparison of lactate:pyruvate ratios between genotypes. Data are mean ± SD. n = 4 for each group. ***p ≤ 0.0001.

Diabetic mice with reduction of Glut1 in the RPE exhibit similar ERG defects as diabetic controls. A, Representative strobe flash ERG waveform traces from diabetic (STZ) and nondiabetic (CNTL) VMD2 Glut1-CKD mice and littermate controls evoked in response to a 1.4 log cd.s/m2 light stimulus. B, Luminance-response function for the a-wave after 4 weeks of diabetes. Amplitude of the a-wave was measured at 8.3 ms following the flash stimulus. C, Luminance-response function for the b-wave after 4 weeks of diabetes. Amplitude of the b-wave was measured by summing the amplitude of the a-wave with the peak of the response following the OPs (≥40 ms). D, Representative traces of filtered OPs from strobe flash ERGs evoked by a 1.4 log cd.s/m2 flash stimulus at 4 weeks of diabetes. E, Mean amplitude of OP1-3 and the summed OP amplitudes for 4 weeks of diabetes. Amplitude of each OP was measured from the minimum of the preceding trough to the peak of the potential. F, Representative waveforms induced by a 5 cd/m2 white stimulus for 10 s. Amplitude of the c-wave was determined by subtracting the average baseline amplitude from the maximal response following the b-wave. G, Average amplitude of the c-wave at 4 weeks of diabetes. Data are mean amplitude ± SEM for each flash stimulus. n ≥ 4 in each group. *p ≤ 0.05.
Reduction of Glut1 in retinal neurons reduces polyol accumulation and prevents retinal dysfunction and markers of inflammation/oxidative stress
We next used the CrxCre/+ transgenic strain to drive Cre expression in retinal neurons. As with the VMD2 strain, Glut1flox/+ mice were bred with CrxCre/+ mice to create the retina specific Crx Glut1-CKD mouse that expresses a single Slc2a1 allele in all the cells of the Crx lineage. Crx is expressed in photoreceptor progenitors beginning at E12.5, and Crx-mediated recombination occurs in rod and cone photoreceptors, bipolar cells, Müller glia, and amacrine cells (T. Furukawa et al., 1997; A. Furukawa et al., 2002; Hennig et al., 2008). Figure 12A illustrates the pattern of CrxCre mediated recombination within the retina, but not the RPE. Decreased levels of Slc2a1 mRNA and Glut1 protein in retinas of Crx Glut1-CKD mice were confirmed by qPCR (Fig. 12B; F(3,18) = 9.573, p = 0.0005) and Western blotting (Fig. 12C; F(3,15) = 25.29, p < 0.0001), respectively. Like Glut1+/− mice, nondiabetic Crx Glut1-CKD mice also exhibited normal retinal morphology (Fig. 12D) and ERG responses (see Fig. 14).

Crx Glut1-CKD mice exhibit 50% reduction of Glut1 specifically in the retina and normal retinal morphology. A, Representative confocal images depicting CrxCre/+ recombinase activity in the retina of adult mice by expression of tdTomato. B, qPCR demonstrating 50% reduction in Glut1 expression in the retina of Glut1flox/+Crxcre/+mice. Relative fold change in Glut1 gene expression was determined using the 2ΔΔCt method. Slc2a1 levels were normalized to expression of β-actin and compared with Glut1+/+ CNTL. C, Protein levels of Glut1 from retinas dissected from Glut1flox/+CreCre/+ mice following 4 weeks of diabetes. Left panels, Representative Western blots imaged. Right graph, Relative Glut1:β-actin levels normalized to the Glut1flox/+CrxCre/- control. D, Representative images of retinal cryosections stained with DAPI demonstrating normal retinal morphology. Scale bar, 50 µm. RPE, Retinal pigmented epithelium; OS, outer segments; ONL, outer nuclear layer; INL, inner nuclear layer; IPL, inner plexiform layer; RGC, retinal ganglion cell layer. Data are mean ± SEM. n ≥ 3 in each group. *p ≤ 0.05. **p ≤ 0.001. ***p ≤ 0.0001.
Analysis of blood and retinal glucose levels revealed that reduction of Glut1 only in the retina did not affect systemic glucose levels (Fig. 13A; F(3,16) = 31, p < 0.0001), but slightly reduced retinal glucose content, which was only significant compared with the WT diabetic retina (Fig. 13B; F(3,16) = 4.4, p = 0.0196). There were no differences in systemic or retinal glucose levels between diabetic mice based on genotype, however. Importantly, diabetic Crx Glut1-CKD mice displayed a significant reduction in retinal sorbitol levels compared with WT diabetics (Fig. 13C; F(3,15) = 34, p < 0.0001). Similar to the glucose content, fructose levels in the nondiabetic CNTL Crx Glut1-CKD mouse were slightly lower, but only compared with the WT diabetic (Fig. 13D; F(3,16) = 4.6, p = 0.0160). No differences were found in lactate:pyruvate ratios. These findings reveal that reduction of Glut1 only within retinal neurons can recapitulate the mitigation of retinal polyol accumulation found in diabetic Glut1+/− mice. Importantly, although reduction of Glut1 only in retinal neurons did not lead to a complete normalization of retinal sorbitol levels, the change was correlated with a full normalization of retinal function (Fig. 14). ERGs were recorded following 4 weeks of diabetes in Crx Glut1-CKD and littermate controls. Notably, diabetic Crx Glut1-CKD mice displayed normal a- and b-wave amplitudes at all light intensities (Fig. 14A-C; a-wave: F(3,142) = 24.74, p < 0.0001; b-wave: F(3,233) = 42.71, p < 0.0001). Figure 14A illustrates waveform traces from a 1.9 log cd.s/m2 flash stimulus; and in Figure 14B, C, luminance-response functions for these mice clearly depict the significant differences between diabetic WT and Crx Glut1-CKD mice. The amplitude of the OPs (Fig. 14D,E) and the c-wave (Fig. 14F,G; F(3,25) = 23.38, p < 0.0001) was also normalized in the diabetic Crx Glut1-CKD mouse. To determine whether the rescue of the diabetic phenotype extended beyond retinal function, we analyzed expression of oxidative stress mediators and inflammatory cytokines in retinas from each cohort of animals (Fig. 15). While diabetes induced elevations in WT mice, no differences in expression of Nos2 (Fig. 15A; F(3,13) = 6.710, p = 0.0056), TNF-α (Fig. 15B; F(3,16) = 23.34, p < 0.0001), Cox2 (Fig. 15C; F(3,13) = 9.133, p = 0.0016), or IL-1β (Fig. 15D; F(3,14) = 10.23, p = 0.0008) were observed between nondiabetic WT and diabetic Crx Glut1-CKD cohorts. These findings demonstrate that a small modulation of Glut1 levels only within retinal neurons has significant effects on the development of early characteristic hallmarks of DR.

Reduction of Glut1 in the retina ameliorates retinal polyol accumulation associated with diabetes. A, At 4 weeks of diabetes, mice were fasted for ≥7 h before analysis of blood glucose levels with a OneTouch Ultra glucometer. B-D, Retinas from fasted Crx Glut1-CKD mice were dissected and analyzed by GC/MS. Relative quantities of glucose (B), sorbitol (C), and fructose (D) were normalized to 13C5-ribitol for comparison between genotypes. E, Comparison of lactate:pyruvate ratios between genotypes. Data are mean ± SD. n = 5 for each group. *p ≤ 0.05. ***p ≤ 0.0001.

Diabetic mice with reduction of Glut1 in the retina exhibit no ERG defects. A, Representative strobe flash ERG waveform traces from diabetic and nondiabetic Crx Glut1-CKD mice and littermate controls evoked in response to a 1.4 log cd.s/m2 light stimulus. B, Luminance-response function for the a-wave after 4 weeks of diabetes. Amplitude of the a-wave was measured at 8.3 ms following the flash stimulus. C, Luminance-response function for the b-wave after 4 weeks of diabetes. Amplitude of the b-wave was measured by summing the amplitude of the a-wave with the peak of the response following the OPs (≥40 ms). D, Representative traces of filtered OPs from strobe flash ERGs evoked by a 1.4 log cd.s/m2 flash stimulus at 4 weeks of diabetes. E, Average amplitude of OP1-3 and the summed OP amplitudes for 4 weeks of diabetes. Amplitude of each OP was measured from the minimum of the preceding trough to the peak of the potential. F, Representative waveforms induced by a 5 cd/m2 white stimulus for 10 s. Amplitude of the c-wave was determined by subtracting the average baseline amplitude from the maximal response following the b-wave. G, Average amplitude of the c-wave at 4 weeks of diabetes. Data are mean amplitude ± SEM for each flash stimulus. n ≥ 3 in each group. *p ≤ 0.05.

Diabetic mice with reduction of Glut1 in retinal neurons exhibit reduced levels of oxidative stress and inflammatory markers. Expression of Nos2 (A), TNF-α (B), Cox2 (C), and IL-1β (D) in retinas from 4 week diabetic mice were measured by qPCR. Relative fold changes in gene expression were determined using the 2ΔΔCt method. All genes were normalized to expression of β-actin and compared with the Glut1+/+ CNTL. Data are mean ± SD. n ≥ 3 for each group. *p ≤ 0.05. **p ≤ 0.001. ***p ≤ 0.0001.
Discussion
Proposed almost 20 years ago, the unifying theory for the etiology of DR postulated that hyperglycemia-induced production of free oxygen radicals was the basis for glucose damage in the retina (Nishikawa et al., 2000; Brownlee, 2001, 2005). Glucose toxicity and oxidative stress lead to retinal vascular damage through multiple downstream mechanisms, including activation of protein kinase C, aldose reductase activation, and advanced glycation end product formation (X. L. Du et al., 2000). Despite numerous attempts to intervene in the molecular and biochemical pathways stemming from oxidative stress and hyperglycemia, the goal of preventing DR has not yet been met. Therefore, investigations into the mechanisms of glucose entry into the retina, glucose metabolism, and the production of oxidative damage have remained important areas of research. We report here that (1) Glut1 is elevated at early stages of DR; (2) systemic reduction of Glut1 is a successful mechanism for the prevention of polyol accumulation, functional defects, and inflammation/oxidative stress within the diabetic retina; and (3) reduction of Glut1 suppressed these early hallmarks of DR when it was targeted to the neural retina, but not the RPE.
Glut1 is the primary facilitative transporter for the retina and is expressed almost ubiquitously in ocular tissues. It is located in the apical and basal RPE membranes and on the luminal and abluminal membranes of retinal endothelial cells. It is also expressed on retinal ganglion cells and is thought to be the only glucose transporter expressed by photoreceptors (Mantych et al., 1993; Gospe et al., 2010). We found that retinal Glut1 is elevated in early DR, and document this by immunohistochemistry, Western blotting, and quantitative proteomics. However, the literature is inconsistent in this respect, with conflicting reports demonstrating no change (Kumagai et al., 1994; Antonetti et al., 1998), reduced (Badr et al., 2000; Fernandes et al., 2004) and increased (Kumagai et al., 1996; Lu et al., 2013) Glut1 levels in the diabetic retina. Resolution of this divergence is complicated by variability in methodology of animal maintenance (insulin treatment/frequency/concentration), timing of analysis, and the tissue target for analysis. While the basis for the differences is not entirely clear, and unlikely to be resolved, our findings unequivocally show that Glut1 was elevated in the diabetic retina at early time points, which correlated with initial indices of DR.
Because Glut1 protein, but not mRNA, was affected by hyperglycemia, it is likely that Glut1 is regulated by post-translational modification and turnover in the diabetic retina. In skeletal muscle, Glut1 can be SUMOylated by the E2 SUMO-ligase, Ubc9, which when overexpressed, leads to a decrease in Glut1 (Giorgino et al., 2000). As Ubc9 mutations are a major risk factor for Type 1 diabetes (Li et al., 2005), reduced levels of Ubc9 in the diabetic retina may be associated with elevated Glut1. Similarly, Glut1 can be mono-ubiquitinylated and targeted for degradation (Fernandes et al., 2004). The E3 ubiquitin ligase, Nedd4-2, is inhibited in hyperglycemia and oxidative stress (I. H. Lee et al., 2007; Chandran et al., 2011). Therefore, Glut1 may be elevated in the diabetic retina by a decrease in ubiquitinylation/degradation. It will be important to determine the mechanisms of Glut1 regulation in the diabetic retina, and specifically, in the cell type responsible for reducing DR phenotypes.
The profound protection against ERG defects and early markers of oxidative stress/inflammation found in Glut1+/− mice agrees with previous studies demonstrating a role for Glut1 in development of DR (Lu et al., 2013; You et al., 2017, 2018). Our work is novel in that we systemically reduced Glut1 by a genetic approach, correlated it with normalization of polyol accumulation, and determined that reduction of Glut1 in the RPE is not protective. It is important to note that, although glucose is required for function and survival of photoreceptors, and these cells undergo degeneration in mice with ≥50% reduction of Glut1 in the RPE (Swarup et al., 2019), the retina is resilient to ≤50% reduction of Glut1. Our ERG and histologic analyses indicate that no changes in retinal function or structure are found in Glut1+/− mice, a model of Slc2a1 haploinsufficiency and Glut1 deficiency syndrome (Wang et al., 2006). Although neuroinflammation and microvascular changes occur in the brain of Glut1+/− mice (Tang et al., 2017, 2019), Glut1+/− retinas are normal. Likewise, inactivation of one Slc2a1 allele in the retina (Crx Glut1-CKD) or the RPE (VMD2 Glut1-CKD) also maintained normal retinal function and histology, with lower levels of Glut1 in these cell types but no compensation by other glucose transporters (qRT-PCR; other glucose transporters are undetected in the retina by Western blot or immunohistochemistry). Therefore, modulation of Glut1 by small amounts specifically in the retina is a feasible strategy for protection against early hallmarks of DR.
STZ induced a 2-3× increase in blood glucose levels compared with CNTL mice (3.1× for Glut1+/+, 3.2× for Glut1+/−; 2.6 for VMD2 controls, 2.8 for VMD2 Glut1-CKDs; 2.3 for Crx controls, 2.4 for Crx Glut1-CKDs). However, retinal glucose levels were not significantly different between diabetic and nondiabetic mice of any genotype. Instead, significant differences were found in levels of glucose metabolites of the polyol pathway. Importantly, mice were fasted for ≥7 h before retinal dissections, enabling a clear evaluation of retinal glucose levels and metabolite accumulation. While glucose can readily be transported out of the retina via Glut1 on retinal endothelial cells and the RPE, sorbitol cannot be exported from the retina (Jedziniak et al., 1981). Therefore, we propose that the primary effector in DR is not glucose itself, but sorbitol, which accumulates to induce increased osmolarity and oxidative stress.
Systemic or retina-specific reduction of Glut1 was correlated with lower sorbitol accumulation, and more importantly, with complete normalization of ERG defects and oxidative stress in diabetic mice. Sorbitol induces hyperosmolarity and oxidative stress because of the biochemical processes underlying its production and breakdown. When aldose reductase turns glucose into sorbitol, NADPH is converted to NADP+. In hyperglycemia, the requirement for breakdown of excess glucose via the polyol pathway depletes NADPH, which is critical for glutathione to scavenge free radicals and the de novo synthesis of fatty acids, nucleotides, steroids, and cholesterol. Net formation of fructose from glucose via sorbitol dehydrogenase also results in the breakdown of NADPH and formation of NADH. The NAD+/NADH ratio in the cell is ∼600:1, and even the smallest change in NADH can decrease this ratio drastically (Ido, 2007), inducing pseudohypoxia and contributing to DR (Williamson et al., 1993). Increased NADPH/NADP+ (Varma and Kinoshita, 1974) and decreased NAD+/NADH ratios (Obrosova et al., 2001) have been reported in diabetic rat lens. Although lactate:pyruvate ratios were largely unchanged in our mice, the prevention of polyol accumulation may have directly led to the prevention of oxidative stress.
Perhaps one of the most interesting findings from our work was that VMD2 Glut1-CKD mice did not exhibit altered sorbitol levels. Indeed, it was surprising that reduction of Glut1 in the RPE was not associated with lower retinal polyol accumulation or normalized ERGs. However, because glucose is rapidly converted to sorbitol, it was likely that the level of Glut1 remaining in the RPE was too high to sufficiently lower glucose flux into the retina and affect metabolism. Instead, a reduction in glucose entry into the neural retina was required for the successful normalization of DR pathologies. Thus, targeting sorbitol or identifying mechanisms to reduce Glut1 in neurons is likely to be key to preventing DR. Crx-mediated recombination occurs in retinal progenitors at E12.5 and results in recombination in photoreceptors, but also Müller glia, bipolar cells, and amacrine cells (Hennig et al., 2008). Although reduction of Glut1 in any of these cell types can underlie the protection observed in the Crx Glut1-CKD mouse, photoreceptors are the most highly metabolic cells in the body, and maintenance of the dark current is a considerable energy sink for the retina (Okawa et al., 2008). Therefore, we propose that reduced photoreceptor-mediated glucose metabolism accounts for the reduction in sorbitol accumulation and the oxidative stress. Consistent with this hypothesis, diabetic Gnat1−/− mice exhibit significantly reduced leukostasis and cytokine production (Liu et al., 2019). Hurley and colleagues (J. Du et al., 2016) demonstrated that phototransduction influences metabolic flux and Gnat1−/− mice no longer display light-evoked metabolic flux. Thus, the protective effects seen in the diabetic Gnat1−/− mouse could also be because of reduced sorbitol accumulation.
Beyond sorbitol, retinal endothelial cells significantly contribute to DR pathology downstream of inflammation (Fu et al., 2016; Sorrentino et al., 2018). Because systemic or retina-specific reduction of Glut1 abrogated cytokine expression, we postulate that leukocyte activation should not occur. Kern and colleagues suggested that photoreceptors communicate with leukocytes via cytokines to propagate inflammation in the retina and kill retinal endothelial cells (Liu et al., 2016; Tonade et al., 2016, 2017; Liu et al., 2019). Although we focused here on the early stages of DR, determining whether reduction of Glut1 in RECs prevents DR pathology will be informative in further discerning if limiting glucose entry to the retina, or reducing the rate of glucose metabolism by photoreceptors is the source of late-stage pathogenicity.
Footnotes
This work was supported by Veterans Administration Merit Award I01 BX002754-01A2 to I.S.S., National Institutes of Health R01 EY024972 to J.E.S., National Institutes of Health, National Eye Institute P30 Core Grant IP30EY025585, The Research to Prevent Blindness Unrestricted Grants, Cleveland Eye Bank Foundation awarded to the Cole Eye Institute, and Cleveland Clinic Foundation. We thank Drs. E. Dale Abel, Joshua Dunaief, and Sujata Rao for providing mice; and Dr. Neal Peachey for critical reading of the manuscript.
The authors declare no competing financial interests.
- Correspondence should be addressed to Ivy S. Samuels at Ivy.Samuels{at}va.gov or doctoreyevy{at}gmail.com


