

Article Figures & Data
Figures
- Figure 1.
Syp expression. A, Micrographs of WT cells, WT cells transfected with syp, syp KO cells, and syp KO cells transfected with syp. The rows present images of bright field (BF), immunofluorescence of syp (red), DAPI (blue), and syp+DAPI (Merge). Scale bars: 7.5 µm. B, Quantitative analysis of syp immunostaining against calibration standard corrected for background (see Materials and Methods). WT+syp fluorescence is 2.17-fold higher than in WT, while fluorescence in syp KO+syp is similar to that in WT. C, Distribution of syp immunostaining from B. Cell numbers: WT, N = 96; WT+syp, N = 82; syp KO, N = 86; syp KO+syp, N = 126; ***p < 0.01, by Mann–Whitney test.
- Figure 2.
Amperometry recordings of catecholamine release from chromaffin cells with tetraspanner manipulations. A, Representative recordings from WT cells, syp KO cells, syp KO cells transfected with WT syp (syp KO+syp), syp KO cells transfected with syp-dC (syp KO+dC), WT cells overexpressing full-length syp (WT+syp), and syp/syg DKO cells. The lines below each trace indicate the time of depolarization by high KCl application. B, The frequency of spikes (amplitudes >4 pA) from the first stimulation, presented as cell-mean. C, Pooled cumulative spike counts from the first stimulation of each cell, plotted to show fusion events versus time (normalized to cell number). As in B, the line below indicates the time of depolarization. D, The slope of the rise from 10% to 70% of the plateau from the cumulative plots in C. Cell numbers: WT, N = 77; syp KO, N = 75; syp KO+Syp, N = 53; syp KO+dC, N = 41; WT+syp, N = 29; DKO, N = 72 cells; *p < 0.05, **p < 0.01, ***p < 0.001, by one-way ANOVA with the Tukey's post hoc test.
- Figure 3.
Calcium current. A, Whole-cell recordings of Ca2+ current from individual chromaffin cells. WT (black), syp KO (red), syp KO+syp (blue), syp KO+dC (green), WT+syp (purple), and DKO (orange). Currents were evoked by pulses from −80 to 10 mV. B, Peak Ca2+ currents were averaged and the cell-means plotted. C. Ca2+ currents at the end of 100-ms pulse were averaged and the cell-means plotted. Number of cells = 5 (WT), 5 (syp KO), 6 (syp KO+Syp), 5 (syp KO+dC), 6 (WT+syp), and 5 (DKO). The means were statistically indistinguishable by one-way ANOVA with Student–Newman–Keuls post hoc test.
- Figure 4.
Two types of exocytotic events. A, Amperometry recordings displayed with an expanded current scale revealed small, slow kiss-and-run events, in addition to large, rapid spikes (the peaks of the larger spikes are clipped). Both types of event were seen in all conditions. B, The mean amplitudes of all events ≥2 pA were calculated, with error bars based on cell number (stated in legend of Fig. 2). The peak amplitude was significantly lower in DKO. C1, Cumulative distributions of amplitudes for the indicated conditions. C2, Cumulative distributions on an expanded scale to highlight the differences. All conditions (indicated by color) exhibited significant increases in the proportion of smaller events versus WT control cells (left shifted). All distributions were significantly different as judged by the Kolmogorov–Smirnov test, except syp KO versus syp KO+syp; **p < 0.01, by one-way ANOVA with the Tukey's post hoc test.
- Figure 5.
Classifying full-fusion and kiss-and-run events. A, Representative small-amplitude kiss-and-run events (left) and large-amplitude full-fusion spikes (right). t1 is the duration from event onset to the time where the signal passes below the average of the points within 50% of the preceding peak; t2 indicates total duration (Wang et al., 2006). The ratio t1/t2 is close to one for kiss-and-run events and smaller for spikes. B, The plot of t1/t2 versus peak amplitude from all WT cell events (200 events per bin). The dashed lines highlight a transition between two regions, with kiss-and-run events to the left and full-fusion to the right. C1, The cell-mean of fraction of kiss-and-run events (2- to 4-pA events/all events). Kiss-and-run fractions are significantly higher in syp KO, DKO, and syp KO+dC. C2, The durations of 2- to 4-pA kiss-and-run events, computed as cell-means with cell number as in Figure 2. D1, The cell-mean of fraction of kiss-and-run events (2- to 6-pA events/all events). Kiss-and-run fractions are significantly higher in the same conditions as C1. D2, The durations of 2- to 6-pA kiss-and-run events; **p < 0.01, ***p < 0.001. One-way ANOVA with Tukey's post hoc test.
- Figure 6.
Initial fusion pores. A, Amperometric spikes with PSF indicated by bars below each trace. B, Life-time distributions of PSF are well fitted with single exponential decays (solid lines). The time constants for mean PSF duration, τ, and R2 indicated for each fit. C, τ from the fits in B was slightly shorter in syp KO but much longer in DKO cells, and not significantly different in other conditions. D, PSF amplitudes (cell-mean) were similar in all conditions. Cell numbers and statistics as in Figure 2.
- Figure 7.
Spike characteristics. A, A representative spike illustrates amplitude; rising time from 10% to 90% of peak; half-width (at 50% of spike peak); and decay time from peak until return to baseline. B, Mean spike amplitudes were indistinguishable in all conditions. Note that this was the mean of spikes ≥20 pA; by comparison, the means of all events (≥2 pA) varied (Fig. 4B). C, The rising time was significantly greater in DKO and syp KO+dC. D, The half-width was significantly longer in syp KO+dC and WT+syp. E, The decay time was significantly longer in syp KO+dC and even more so in WT+syp. F, The total area of spikes was significantly larger in syp KO+dC and WT+Syp. Cell numbers and statistics as in Figure 2.
- Figure 8.
Late-stage fusion pores. A, Transformation of spike to permeability for a WT and WT+syp spike by the equation in text. Amperometric current (solid trace) was used to calculate permeability (dotted trace). Dotted and dashed lines show peak and plateau permeability, respectively. B, Bar graph of peak permeability, which was significantly lower in DKO, Syp KO+Syp, syp KO+dC, and WT+Syp cells. C, Bar graph of plateau permeability, which was significantly lower for syp KO+dC and WT+syp. Cell numbers as in Figure 2; *p < 0.05, ***p < 0.001. One-way ANOVA with Tukey's post hoc test.
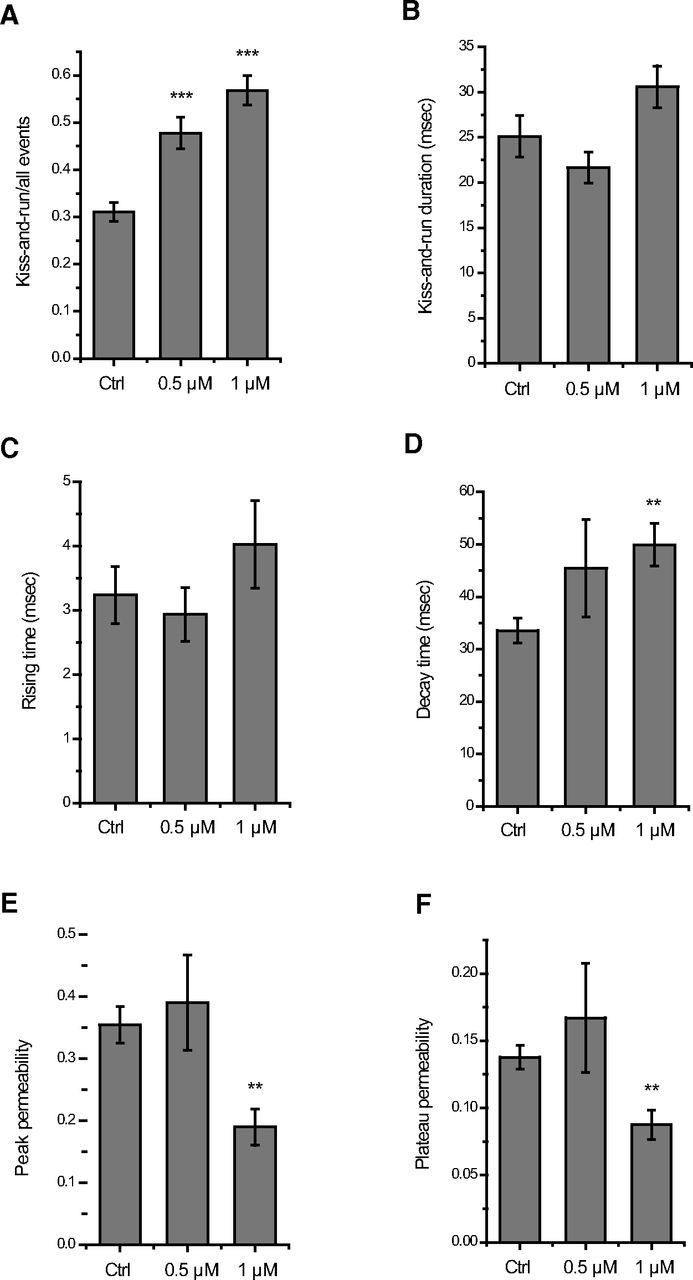
- Figure 9.
Inhibition of dynamin by dynasore. WT chromaffin cells were incubated in the bathing solution with 0.04% DMSO (Ctrl), or 0.5 or 1 μm dynasore for 5 min, and amperometry recordings conducted as in Figure 2A. A, The fraction of kiss-and-run events. B, Kiss-and-run duration. C, Rising time. D, Decay time. E, Peak permeability. F, Plateau permeability. Cell numbers: Ctrl, N = 29; 0.5 μm, N = 27; 1 μm, N = 31; *p < 0.05, **p < 0.01, ***p < 0.001. One-way ANOVA with Tukey's post hoc test.
- Figure 10.
Vesicle sizes. A, Electron micrographs of WT, syp KO, DKO, syp KO+dC, and WT+syp chromaffin cells. LDCVs are indicated by white arrows. Scale bars: 500 nm. B, Distribution of diameter in indicated groups. WT: 1755 DCVs from 18 cells; syp KO: 1963 DCVs from 18 cells; DKO: 1878 DCVs from 18 cells; syp KO+dC: 2530 DCVs from 20 cells; WT+syp: 2226 DCVs from 17 cells. C, Cell-means of diameter of indicated groups. WT: 284.93 ± 12.45 nm; syp KO: 303.91 ± 6.86 nm; DKO: 271.49 ± 9.66 nm; syp KO+dC: 281.35 ± 8.93 nm; WT+syp: 280.77 ± 20.31 nm. The values were statistically indistinguishable by one-way ANOVA with Student–Newman–Keuls post hoc test.
- Figure 11.
Syp interactions and fusion pores. A, A SNARE lined fusion pore forms with an opening transition. An interaction between syp TMDs and SNARE TMDs within a partially zipped SNARE complex of the initial fusion pore enables syp to influence early stages of fusion pores and thus PSF stability (Fig. 6). Reversal of pore opening leads to a small kiss-and-run event (Figs. 4, 5). B, The first dilation step, dilation 1, expands the pore to a lipidic state, and is presumably driven by a final zipping step of the SNARE complex. An interaction between the syp C-terminal domain and dynamin can influence the stability of this lipidic pore, and determine the rate of further expansion. The further expansion of the lipidic pore is indicated as dilation 2. Reversal of dilation 1 would terminate a large, spike-like event, in a second form of kiss-and-run.


