

Article Figures & Data
Figures
- Figure 1.
Filopodia and invadopodia stabilize at distinct time points. A, left, Representative confocal maximum projection of Tg(sox10:lifeact-gfp) from a 24-h time lapse starting at 48 hpf. Right, Graph of filopodia (blue) and invadopodia (green) number over time (n = 4 DRG). White dotted box denotes DREZ insets. White arrow denotes actin concentrates. Solid color lines denote representative graphs. Dashed colored lines denote mean ± SEM. Blue box denotes time at the DREZ. B, Quantification of filopodia and invadopodia before, during, and after entry (n = 8 DRG). C, Representative confocal maximum projection of Tg(sox10:lifeact-gfp) animal at 48 hpf localizing to Cortactin staining. D, Quantification of percent of transient invadopodia during navigation that have positive Cortactin staining (n = 12). E, Tracing of growth cone Lifeact-GFP intensity before, during, and after entry (n = 4 DRG). Blue box denotes time at the DREZ. Light purple arrow denotes transient invadopodia. Dark purple arrow denotes stable invadopodia. Blue line denotes representative graph. Dashed black line denotes mean ± SEM. F, G, Confocal maximum projections of super-resolution Tg(sox10:lifeact-gfp) from a 24-h time lapse starting at 48 hpf. Representative images of filopodia (blue arrows) and invadopodia (green arrows) in the x-y-plane and z-plane during (F) navigation and (G) at the DREZ. H, Quantification of difference in invadopodia number between navigation and time at the DREZ (n = 4 DRG). Positive numbers indicate the dominant role in navigation. Negative numbers indicate the dominant role during time at the DREZ. I, J, Correlation between invadopodia number and (G) filopodia number or (H) filopodia length over time (n = 4 DRG). Scale bars: 10 μm (A, C, F, G). A, B, E, H–J, Data are represented as mean ± SEM.
- Figure 2.
Rac1 inhibits coordinated invadopodia state. A, Quantification of invadopodia number during time at the DREZ (n = 8 non-pa-Rac1 DRG; n = 8 pa-Rac1 DRG; n = 5 DMSO DRG; n = 5 NSC23766 DRG). B, Quantification of filopodia length during time at the DREZ (n = 20 non-pa-Rac1 filopodia; n = 20 pa-Rac1 filopodia; n = 16 DMSO filopodia; n = 16 NSC23766 filopodia). C, Quantification of difference of transient invadopodia between navigation and time at the DREZ (n = 5 non-pa-Rac1 DRG; n = 5 pa-Rac1 DRG; n = 4 DMSO DRG; n = 5 NSC23766 DRG). D, Quantification of difference of stable invadopodia between navigation and time at the DREZ (n = 5 non-pa-Rac1 DRG; n = 5 pa-Rac1 DRG; n = 4 DMSO DRG; n = 5 NSC23766 DRG). E, Quantification of duration of coordinated invadopodia state of stable invadopodia (n = 4 non-pa-Rac1 DRG; n = 5 pa-Rac1 DRG; n = 4 DMSO DRG; n = 5 NSC23766 DRG). A–E, Black dots denote non-photoactivated Rac1. Purple dots denote photoactivated Rac1. Gray dots denote DMSO. Magenta dots denote NSC23766. F–I, left, Confocal maximum projection of Tg(sox10:lifeact-gfp) from a 24-h time lapse starting at 48 hpf in a (F) non-photoactivated Rac1, (G) photoactivated-Rac1, (H) DMSO, or (I) NSC23766 condition. White dotted box denotes DREZ insets. White arrow denotes actin concentrates. Right, Tracing of growth cone Lifeact-GFP intensity before, during, and after entry in a (F) non-photoactivated Rac1 (n = 4), (G) photoactivated-Rac1 (n = 5), (H) DMSO (n = 4), or (I) NSC23766 (n = 5) condition. Blue box denotes time at the DREZ. Blue line denotes representative graph. Dashed black line denotes mean ± SEM. Scale bars: 10 μm (F–I). A–I, Data are represented as mean ± SEM.
- Figure 3.
Precise levels of cAMP regulate the invadopodia brake. A, Images of Tg(tnfa:gfp) animals at 72 hpf treated with DMSO, 100 μm sp-cAMP, or 25 μm rp-cAMP. B, Quantification of invadopodia number during time at the DREZ (n = 6 DMSO DRG; n = 7 sp-cAMP DRG; n = 6 rp-cAMP DRG; n = 5 sp-cAMP + rp-cAMP DRG; n = 4 pa-Rac1 DRG). C, Quantification of filopodia length during time at the DREZ (n = 10 DMSO filopodia; n = 10 sp-cAMP filopodia; n = 10 rp-cAMP filopodia; n = 10 sp-cAMP + rp-cAMP filopodia; n = 20 pa-Rac1 + rp-cAMP filopodia). D, Quantification of difference of transient invadopodia between navigation and time at the DREZ (n = 5 DMSO DRG; n = 5 sp-cAMP DRG; n = 5 rp-cAMP DRG; n = 5 sp-cAMP + rp-cAMP DRG; n = 4 pa-Rac1 + rp-cAMP DRG). E, Quantification of difference of stable invadopodia between navigation and time at the DREZ (n = 4 DMSO DRG; n = 5 sp-cAMP DRG; n = 5 rp-cAMP DRG; n = 5 sp-cAMP + rp-cAMP DRG; n = 4 pa-Rac1 + rp-cAMP DRG). F, Quantification of duration of coordinated invadopodia state of stable invadopodia (n = 5 DMSO DRG; n = 5 sp-cAMP DRG; n = 4 rp-cAMP DRG; n = 5 sp-cAMP + rp-cAMP DRG; n = 4 pa-Rac1 + rp-cAMP DRG). B–F, Black dots denote DMSO. Dark blue dots denote 100 μm sp-cAMP. Green dots denote 25 μm rp-cAMP. Light blue dots denote 100 μm sp-cAMP + 25 μm rp-cAMP. Pink dots denote pa-Rac1 + 25 μm rp-cAMP. G–K, left, Confocal maximum projection of Tg(sox10:lifeact-gfp) from a 24-h time lapse starting at 48 hpf in a (G) DMSO, (H) 100 μm sp-cAMP, (I) 25 μm rp-cAMP, (J) 100 μm sp-cAMP + 25 μm rp-cAMP, or (K) pa-Rac1 + 25 μm rp-cAMP-treated animal. White box denotes DREZ insets. White arrow denotes actin concentrates. Right, Tracing of growth cone Lifeact-GFP intensity before, during, and after entry in a (G) DMSO (n = 4), (H) 100 μm sp-cAMP (n = 5), (I) 25 μm rp-cAMP (n = 4), (J) 100 μm sp-cAMP + 25 μm rp-cAMP (n = 5), or (K) pa-Rac1 + 25 μm rp-cAMP (n = 4) treated animal. Blue box denotes time at the DREZ. Blue line denotes representative graph. Dashed black line denotes mean ± SEM. Scale bars: 10 μm (A, G–K). A–K, Data are represented as mean ± SEM.
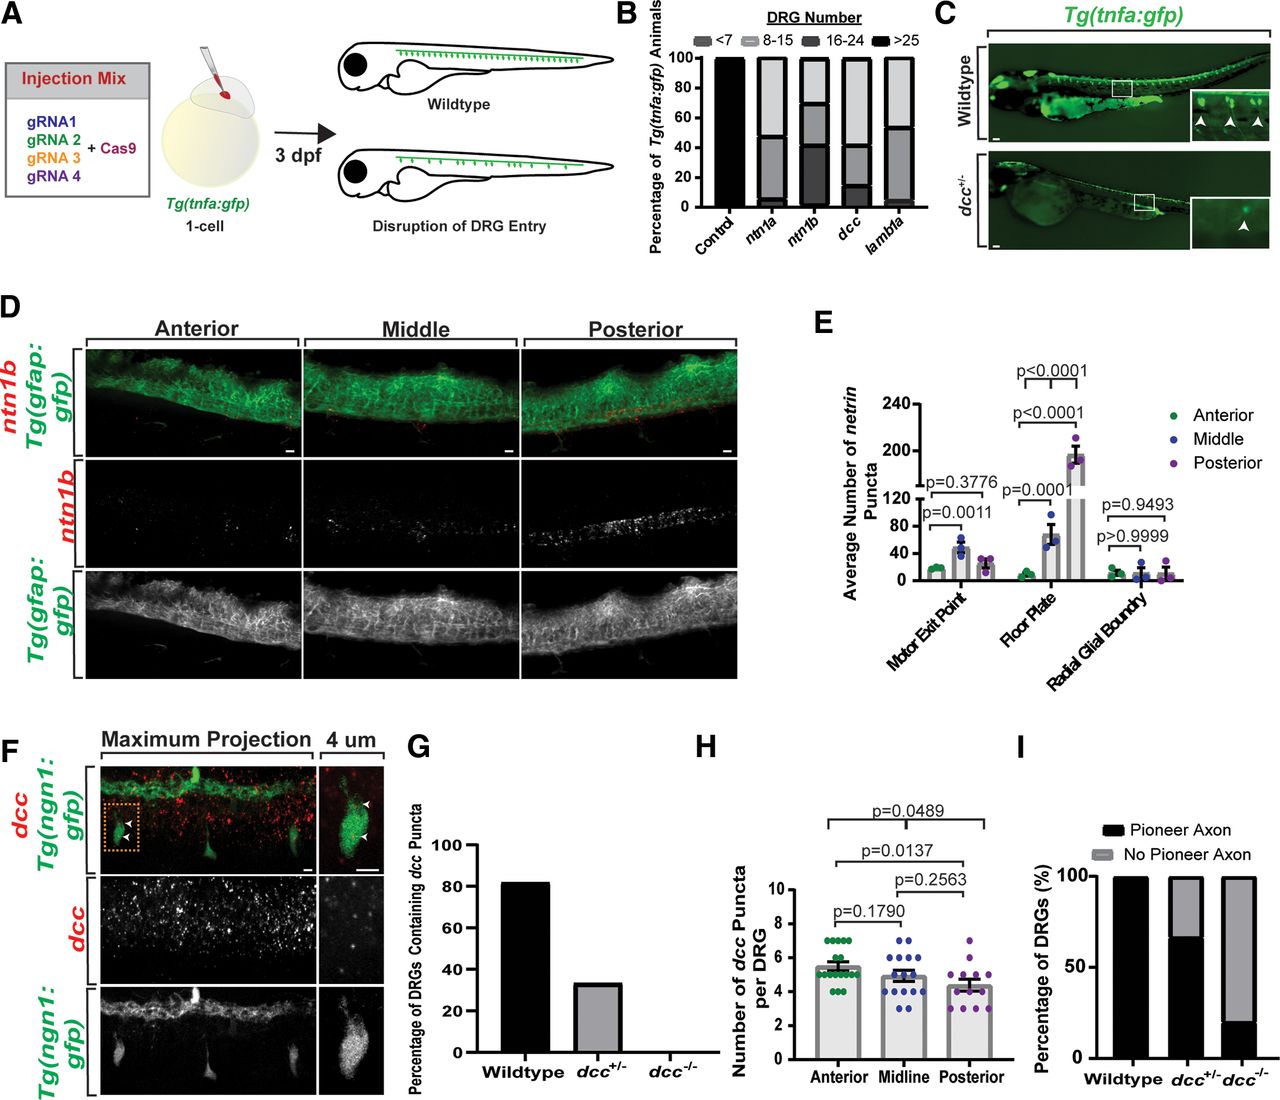
- Figure 4.
DCC identified as candidate for actin-regulated entry. A, Schematic representation of screen using Tg(tnfa:gfp) animals. B, Quantification of genetic screen showing percentage animals with the given number of Tg(tnfa:gfp)+ DRG (n = 53 ntn1a animals; n = 53 ntn1b animals; n = 26 dcc animals; n = 43 lamb1a animals). C, Images of Tg(tnfa:gfp) animals in wild-type and dcc+/− backgrounds at 72 hpf. D, Confocal maximum projects of the anterior, middle, and posterior Tg(gfap:gfp) animals with RNAScope of ntn1b. E, Quantification of ntn1b puncta per anatomical location (n = 3 animals). Green dots denote anterior. Blue dots denote middle. Purple dots denote posterior. F, Confocal maximum projections of Tg(ngn1:gfp) animals with RNAScope of dcc. Dotted orange box denotes inlet of 4 μm DRG plane. White arrowheads denote localization with dcc puncta. G, Quantification of percent of DRG that contain dcc puncta (n = 10 wild-type DRG; n = 6 dcc+/− DRG; n = 3 dcc−/− DRG). H, Quantification of number of dcc puncta per DRG over anatomic location (n = 7 animals). Green dots denote anterior. Blue dots denote middle. Purple dots denote posterior. I, Quantification of percentage of pioneer axons in dcc−/− and dcc+/− animals. Scale bars: 10 μm (C, D, F). E, H, Data are represented as mean ± SEM.
- Figure 5.
DCC signaling controls invadopodia in pioneer axons. A, Quantification of invadopodia number during time at the DREZ (n = 6 wild-type DRG; n = 4 dcc−/− DRG; n = 7 dcc+/− DRs; n = 3 dcc+/− + sox10:dcc DRG; n = 5 dcc+/− + sp-cAMP DRG; n = 6 dcc+/− + rp-cAMP DRG). B, Quantification of filopodia length during time at the DREZ (n = 10 wild-type filopodia; n = 10 dcc−/− filopodia; n = 10 dcc+/− filopodia; n = 10 dcc+/− + sox10:dcc filopodia; n = 10 dcc+/− + sp-cAMP filopodia; n = 10 dcc+/− + rp-cAMP filopodia). C, Quantification of difference of transient invadopodia between navigation and time at the DREZ (n = 5 wild-type DRG; n = 4 dcc−/− DRG; n = 5 dcc+/− DRG; n = 3 dcc+/− + sox10:dcc DRG; n = 5 dcc+/− + sp-cAMP DRG; n = 5 dcc+/− + rp-cAMP DRG). D, Quantification of difference of stable invadopodia between navigation and time at the DREZ (n = 5 wild-type DRG; n = 4 dcc−/− DRG; n = 5 dcc+/− DRG; n = 3 dcc+/− + sox10:dcc DRG; n = 5 dcc+/− + sp-cAMP DRG; n = 5 dcc+/− + rp-cAMP DRG). E, Quantification of duration of coordinated invadopodia state of stable invadopodia (n = 4 wild-type DRG; n = 4 dcc−/− DRG; n = 4 dcc+/− DRG; n = 3 dcc+/− + sox10:dcc DRG; n = 5 dcc+/− + sp-cAMP DRG; n = 5 dcc+/− + rp-cAMP DRG). A–E, Black dots denote wild type. Purple dots denote dcc−/−. Orange dots denote dcc+/−. Red dots denote dcc+/− + sox10:dcc. Blue dots denote dcc+/− + sp-cAMP. Green dots denote dcc+/− + 25 μm rp-cAMP. F–J, left, Confocal maximum projection of Tg(sox10:lifeact-gfp) from a 24-h time lapse starting at 48 hpf in a (F) wild-type, (G) dcc−/−, (H) dcc+/−, (I) dcc+/− + sox10:dcc, or (J) dcc+/− + sp-cAMP-treated animal. White box denotes DREZ insets. White arrow denotes actin concentrates. Right, Tracing of growth cone Lifeact-GFP intensity before, during, and after entry in a (F) wild-type (n = 4), (G) dcc−/− (n = 4), (H) dcc+/− (n = 4), (I) dcc+/− + sox10:dcc (n = 3), or (J) dcc+/− + sp-cAMP (n = 5) treated animal. Blue box denotes time at the DREZ. Blue line denotes representative graph. Dashed black line denotes mean ± SEM. K, left, Confocal maximum projection of Tg(sox10:lifeact-gfp) at 48 hpf localizing with DCC. Right, Quantification of DCC localization to the DRG soma, transient invadopodia, and stable invadopodia (n = 6 DRG). Scale bars: 10 μm (F–K). A–K, Data are represented as mean ± SEM.
- Figure 6.
Disruption of coordinated invadopodia state disrupts axon entry. A, Images of Tg(tnfa:gfp) animals at 72 hpf treated with DMSO, 1 μm NSC23766, 1 μm NSC23766 + 100 μm sp-cAMP, or in a dcc+/− background treated with 1 μm NSC23766. B, Quantification of number of Tg(tnfa:gfp)+ DRG in animals treated with DMSO (n = 6), 1 μm NSC23766 (n = 11), 1 μm NSC23766 + 100 μm sp-cAMP (n = 13), 100 μm sp-cAMP (n = 5), or 25 μm rp-cAMP (n = 5), or wild-type animals (n = 6), dcc+/− animals (n = 4), or dcc+/− animals treated with 1 μm NSC23766 (n = 5). Black dots denote DMSO. Magenta dots denote NSC23766. Cyan dots denote NSC23766 + sp-cAMP. Blue dots denote sp-cAMP. Green dots denote rp-cAMP. Gray dots denote wild type. Purple dots denote dcc+/−. Orange dots denote dcc+/− + NSC23766. C, Quantification of percentage of DRG neurons that bifurcate in pa-Rac1 (n = 5), 1 μm NSC23766 (n = 8), 100 μm sp-cAMP (n = 11), 25 μm rp-cAMP (n = 6), or dcc+/− animals (n = 14). D, IMARIS rendering of the pioneer axon (green arrow) and radial glial boundary (purple arrow) in the x-y-plane and the y-orthogonal view. Dotted orange line represents the line of intensity used to determine intensity numbers of transgenes in entry quantifications. E, Quantification of percent of axons that entered the spinal cord in Tg(sox10:meGFP);Tg(gfap:nsfb-mcherry) animals treated with DMSO (n = 6 DRG), 100 μm sp-cAMP (n = 9 DRG), or 25 μm rp-cAMP (n = 9 DRG), or in a dcc−/− (n = 6 DRG) or dcc+/− background treated with DMSO (n = 7 DRG), 100 μm sp-cAMP (n = 6 DRG), 25 μm rp-cAMP (n = 4 DRG), injected with sox10:dcc (n = 4), or injected with sox10:dcc and treated with rp-cAMP (n = 4). F, G, Intensity tracings of y-orthogonals show relationship between the pioneer axon and glial limitans. Green arrows denote pioneer axon. Purple arrows denote glial limitans. Scale bars: 10 μm (A, D). B, Data are represented as mean ± SEM.
- Figure 7.
Molecules that disrupt coordinated invadopodia state and growth cone entry cause behavioral defects. A, Schematic of the behavioral assay. B, Representative collapsed image from 60-s movies of animals exposed to either 4°C or 23°C showing animals display a shivering movement after exposure to 4°C. C, Representative image of FLOTE segmentation used for the behavioral analysis. D, Method of calculating tail curvature. Curvature magnitude analyzed as the sum of angle A, angle between segments 2 and 3, and angle B, angle between segments 3 and 4. E, Representative graph of typical “turn/swim” bout. F, Two representative plots of spine curvature during shiver events. Note the scale on the y-axis demonstrates a shorter displacement then seen in turn bouts. G, Number of shivers quantified at 4°C (n = 24 at 2 dpf, 42 at 3 dpf, 42 at 4 dpf, and 48 at 5 dpf) and 23°C (n = 12 at 2 dpf, 21 at 3 dpf, 21 at 4 dpf, and 24 at 5 dpf). H, Total percentage of time shivering quantified at 4°C (n = 24 at 2 dpf, 42 at 3 dpf, 42 at 4 dpf, and 48 at 5 dpf) and 23°C (n = 12 at 2 dpf, 21 at 3 dpf, 21 at 4 dpf, and 24 at 5 dpf). I, Number of “turn/swim” bouts at 4°C (n = 24 at 2 dpf, 42 at 3 dpf, 42 at 4 dpf, and 48 at 5 dpf) and 23°C (n = 12 at 2 dpf, 21 at 3 dpf, 21 at 4 dpf, and 24 at 5 dpf). G–I, Cyan dots denote 4°C. Pink dots denote 23°C. J, Representative collapsed image from 60-s movies of animals exposed to 4°C and either treated with DMSO, 100 μm sp-cAMP, 25 μm rp-cAMP, or in a dcc+/− background treated with DMSO or 100 μm sp-cAMP. K, Total percentage of time shivering quantified at 4°C and 23°C (n = 4 sp-cAMP animals; 4 rp-cAMP animals; 5 dcc+/− animals; 3 dcc+/− +100 μm sp-cAMP animals). Cyan dots denote 4°C. Pink dots denote 23°C. L, Schematic representation of DCC-mediated invadopodia brake. Scale bars: 10 μm (B, J). G–I, K, Data are represented as mean ± SEM.


Movies
- Movie 1.
Time lapse of control growth cone. Confocal maximum projection of 400-min time lapse of control 48 hpf Tg(sox10:lifeact-gfp) animal. Time lapse covers 200 min before and after growth cone entry. Green open circle denotes growth cone.
- Movie 2.
Time lapse of photoactivated-Rac1 growth cone. Confocal maximum projection of 400-min time lapse of 48 hpf Tg(sox10:lifeact-gfp) animal with photo-activated Rac1. Time lapse covers 200 min before and after growth cone entry. Green open circle denotes growth cone.
- Movie 3.
Time lapse of sp-cAMP-treated growth cone. Confocal maximum projection of 400-min time lapse of 48 hpf Tg(sox10:lifeact-gfp) animal treated with 100 μm sp-cAMP. Time lapse covers 200 min before and after growth cone entry. Green open circle denotes growth cone.
- Movie 4.
Time lapse of rp-cAMP-treated growth cone. Confocal maximum projection of 400-min time lapse of 48 hpf Tg(sox10:lifeact-gfp) animal treated with 25 μm rp-cAMP. Time lapse covers 200 min before and after growth cone entry. Green open circle denotes growth cone.
- Movie 5.
Time lapse of photoactivated-Rac1 growth cone treated with rp-cAMP. Confocal maximum projection of 400-min time lapse of 48 hpf Tg(sox10:lifeact-gfp) animal with photo-activated Rac1 and treated with 25 μm rp-cAMP. Time lapse covers 200 min before and after growth cone entry. Green open circle denotes growth cone.
- Movie 6.
Time lapse of dcc+/− growth cone. Confocal maximum projection of 400-min time lapse of 48 hpf Tg(sox10:lifeact-gfp); dcc+/− animal. Time lapse covers 200 min before and after growth cone entry. Green open circle denotes growth cone.
- Movie 7.
Time lapse of dcc+/− growth cone injected with sox10:dcc. Confocal maximum projection of 400-min time lapse of 48 hpf Tg(sox10:lifeact-gfp); dcc+/− animal injected with sox10:dcc. Time lapse covers 200 min before and after growth cone entry. Green open circle denotes growth cone.
- Movie 8.
Time lapse of dcc+/− growth cone treated with sp-cAMP. Confocal maximum projection of 400-min time lapse of 48 hpf Tg(sox10:lifeact-gfp); dcc+/− animal treated with 100 μm sp-cAMP. Time lapse covers 200 min before and after growth cone entry. Green open circle denotes growth cone.
- Movie 9.
Time lapse of dcc+/− growth cone treated with rp-cAMP. Confocal maximum projection of 400-min time lapse of 48 hpf Tg(sox10:lifeact-gfp); dcc+/− animal treated with 25 μm rp-cAMP. Time lapse covers 200 min before and after growth cone entry. Green open circle denotes growth cone.


