

Article Figures & Data
Figures
- Figure 1.
Action potential amplitude decay rate differed significantly between the three distinct adaptation classes of SGN. A1-A3, stacked sweeps from UA, RA, and SA neurons. Traces from each experiment were aligned vertically from low to high current amplitude (step current levels in pA: A1, 270, 480, 700, 900; A2, 185, 305, 365, 395; A3, 246, 286, 546, 956). The constant current injection time course is shown below each stack of sweeps. Holding potential = −60 mV; calibration bar lower right (50 ms, 40 mV) applies to all voltage traces. B1, Action potential (AP) amplitude decay rate (m) was significantly different between RA and SA neurons when assessed for the second to last action potential fits (m2), but not for the first and second action potential fits (m1). B2, Overlapping sweeps and linear fits from 42 RA neurons. B3, Overlapping sweeps and linear fits from 14 SA neurons. C1-C3, Input-output functions for UA, RA, and SA neurons, respectively.
- Figure 2.
Heterogeneous firing rates at APmax overlap for SA and RA neurons. A, SA and RA neurons with similar ISIs were overlaid in 5 different pairs and arranged vertically by firing rate. Double-headed arrows indicate the time intervals used to calculate the ISI(a) ([t last AP − t first AP]/[number of APs −1]); and the ISI(i) (t second AP – t first AP). Bottom right, Calibration (50 ms, 40 mV) applies to all voltage traces. B, ISI(i) and ISI(a) plotted as functions of APmax for 42 RA and 14 SA neurons; 29 UA neurons fired a single spike only. SA ISI(a) and ISI(i) functions were fitted with exponentials having R2 values of 0.95 and 0.86, respectively.
- Figure 3.
Depolarization evoked action potential threshold levels (APDϴ) and RMP are heterogeneous yet show significant differences between adaptation categories. A1-3, Superimposed increasing step depolarization traces from UA, RA, and SA neurons, respectively, were used to measure APDϴ. The peak voltage of the highest subthreshold trace (gray) is the most accurate current-clamp measurement of threshold voltage (dashed line). Bottom right, Calibration (5 ms, 20 mV) applies to all traces. B, Ten sequential sweeps recorded from the spontaneously active SA neuron in A3 held at −60 mV. Arrows indicate examples of membrane oscillations. Bottom left, Calibration (40 ms, 30 mV) applies to all sweeps. C, APDϴ voltage and RMP plotted as a function of APmax for each adaptation category. D1, D2, Significant differences are found between UA, RA, and SA neurons for APDϴ and RMP, respectively.
- Figure 4.
SGNs responded at the offset of hyperpolarizations at levels linearly related to their depolarization-evoked onset responses. A1-A3, Superimposed step depolarization and hyperpolarization traces used to assess APD and APR thresholds from UA, RA, and SA neurons, respectively. Gray represents APmax and subthreshold sweeps. Calibration bars and time course of current injection shown in the top and bottom right in A3, respectively, apply to all panels. Input-output functions for each recording are below each set of superimposed sweeps. Double-headed red arrows indicate the difference in current required to generate an APD and APR threshold response. Blue asterisks indicate the APRϴ trace and its location within the plot below. Red symbols represent the recordings for reference in B-D. B, APD and APR voltage thresholds were both graded by adaptation. Values for individual neurons in each adaptation group (n = 23 UA, 38 RA, 13 SA) were connected by a solid black line. Lower voltage thresholds for APR were consistently observed compared with APD; this difference was greater for the highest threshold UA neurons compared with the lowest threshold SA neurons. Inset, The difference between APD and APR threshold voltages was significantly larger for UA neurons compared with RA and SA neurons (p < 0.01). C, APR plotted as a function of APD threshold voltage. A single linear fit (black line, R2 = 0.86) deviated from unity (gray dashed line) toward lower voltage threshold levels for APR compared with APD. The RA/SA category indicates measurements made from neurons that fired >1 action potential yet were not evaluated for APmax. D, APR plotted as a function of APD threshold current. Two linear functions were fitted to the data. The low threshold fit (m = 0.94; R2 = 0.89) had a slope close to unity (gray dashed line); the high threshold fit (m = 1.57; R2 = 0.69) deviated toward higher current levels for APR. Values derived from A1-A3, are shown as red symbols in B–D. Legend in C applies to C, D.
- Figure 5.
Hyperpolarizing-leading biphasic square pulses and sinusoids lowered action potential threshold by rebound excitation (APRE). A1, A2, Example recordings (top traces) from an individual neuron in response to double square pulses and sinusoids, respectively; with (blue) and without (black) a leading hyperpolarization. Red dotted lines indicate APD threshold. Red dashed lines indicate APRE threshold. B, Average APRE threshold current levels, for both square pulses and sinusoids, were significantly lower than APD values; APRE square pulses, however, showed the greatest change. C, APD current threshold levels plotted as a function of APRE square pulses and sinusoids showed nonoverlapping linear relationships (m = 0.4, R2 = 0.87; m = 0.6, R2 = 0.96, respectively). D, Average APRE threshold voltage levels, for square pulses and sinusoids, were significantly lower than APD values; no significant difference was found, however, between APRE square pulses and sinusoids. E, APD voltage thresholds plotted as a function of APRE square pulses and sinusoids showed essentially overlapping linear relationships (m = 0.79, R2 = 0.79; m = 0.86, R2 = 0.79, respectively). Both linear fits vary from unity (black dashed line) at depolarized threshold levels.
- Figure 6.
Hyperpolarization voltage protocol impacts the relationship between input current and threshold voltage. A, Threshold voltage plotted as a function of input current for APD, APRE (double square pulse), and absolute current values for APR show different resolution, based on the slopes from linear fits: black (m = 0.595, R2 = 0.74, n = 90), gray (m = 0.1198, R2 = 0.795, n = 38), and dashed (m = 0.0222, R2 = 0.599, n = 77) lines, respectively. B, Threshold sweeps from a single neuron when holding potential is hyperpolarized from −60 to −80 mV in 5 mV increments. Inset, dV/dt (mV/ms) plotted as a function of voltage for each high-resolution action potential stimulated with 24 ms square pulses. C1-C3, Overlapping sweeps from low, middle, and high threshold neurons, respectively. Bottom right, Calibration bars apply to all sweeps. Symbols represent the time where measurements were made. D, Voltage to current relationships at −60 mV holding potential for the three recordings shown in C1-C3. Fits were made to the linear regions (thick lines) of the function that extended from just below threshold, through holding potential to ∼−70 mV. The resulting conductance values were 57.7, 72.7, and 95.7 mΩ for the high, middle, and low threshold neurons, respectively. E, Measurements from the three example neurons of APD at −60 to −80 mV holding potentials (colored diamond symbols) are superimposed on average linear fits of APD, APR, and APRE population data replotted from A (gray lines). Colored lines fitted to a larger dataset ranging from 7 to 9 measurements from 9 different neurons had relatively stable slopes (red: −60 mV, m = 0.051, R2 = 0.77, n = 9; amber: −65 mV, m = 0.058, R2 = 0.77, n = 9; light green: −70 mV, m = 0.062, R2 = 0.77, n = 9; light blue: −75 mV, m = 0.062, R2 = 0.78, n = 8; purple: −80 mV, m = 0.061, R2 = 0.82, n = 7). To show the consistency in measurements for each category of response, APRE (gray triangles) and APR (gray squares) measurements shown for the three example neurons aligned closely with the population data replotted from A (top and bottom light gray lines, respectively). APD at −60 mV holding potential for the three neurons (red diamonds), similarly aligned with the population data replotted from A (middle light gray line).
- Figure 7.
SGNs supplemented with 8-Br-cAMP displayed selective responses by electrophysiological parameter and adaptation class. A, Traces from two UA neurons used to assess Ih sag magnitude (hyperpolarization from −60 to −185 mV) for vehicle control (black) and 8-Br-cAMP (gray). Inset, RMP was defined herein as the voltage level recorded at the outset of the experiment in current-clamp mode before any current had been injected. Black traces represent control condition (asterisks). Gray traces represent 8-Br-cAMP supplemented condition. Arrowheads indicate the membrane kinetic differences between control (black) and cAMP (gray) conditions. B, Ih sag magnitude changed significantly between vehicle control and 8-Br-cAMP conditions for each adaptation class. C, RMP level was significantly elevated in the 8-Br-cAMP condition compared with vehicle control for each adaptation class. D, E, Graded average APD (D) and APR (E) threshold current level differences for adaptation classes was unchanged between experimental conditions. The distribution of current values, assessed with f-distribution statistics, was significantly compressed in the 8-Br-cAMP condition compared with vehicle control for RA neurons (gray line and #). F, Graded average APRE threshold current level differences for adaptation classes was unchanged between experimental conditions for UA and SA neurons. A significant difference was noted, however, for RA neurons (p < 0.05). G-I, Average voltage thresholds of APD (G), APR (H), and APRE (I) retained levels and graded differences by adaptation type between treatment groups. J, K, APD voltage threshold plotted as a function of RMP for control and cAMP conditions, respectively. Two different voltage magnitudes at 15 and 25 mV are shown as reference. L, Average input resistance (Rin) showed similar patterns of significance to APD, APR, and APRE threshold current levels shown in D-F.
- Figure 8.
Kinetic differences affected by 8-Br-cAMP were preferentially targeted to RA neurons. A, Action potential firing numbers within each APmax category did not change significantly from vehicle controls for RA and SA classes supplemented 8-Br-cAMP. Inset, Action potential latency was measured (in ms) between the onset of the step depolarization and the peak of the action potential. Action potential duration (in ms) was measured between data points located halfway between the peak and the nadir of the spike. B, Average values and graded latency trends between adaptation categories in the vehicle control condition were retained in the 8-Br-cAMP experimental group. The significant difference between control UA and SA neurons was not observed in the cAMP condition. C, Action potential duration was uniformly heterogeneous for each adaptation group in vehicle control condition. The average value (p = 0.037) and f distribution (p = 0.040) of this parameter changed significantly, but only for RA neurons in the 8-Br-cAMP experimental condition. D1, D2, Action potential duration plotted as a function of input current for vehicle control and cAMP conditions, respectively. Colored symbols represent measurements from traces shown in the inset. Inset, Traces from example recordings were normalized for action potential amplitude and aligned to the initial depolarizing upstroke of the spike to enable direct comparison of duration differences. D2, Double arrowhead indicates active onset kinetics noted at higher thresholds. E, ISI(i) reduced significantly for RA neurons in the 8-Br-cAMP condition compared with vehicle controls. F, ISI(i) plotted as a function of current for 42 RA recordings obtained in the vehicle control condition showed a wide range of responses. G, ISI(i) plotted as a function of current for 28 RA neurons in the 8-Br-cAMP condition displayed more compressed responses. H, ISI(i) did not differ significantly for SA neurons between the vehicle control and 8-Br-cAMP conditions. I, ISI(i) plotted as a function of current from 14 SA neuron recordings obtained in the vehicle control condition. Inset, Percentage of neurons in each adaptation category for the vehicle control condition. J, ISI(i) plotted as a function of current from 12 SA neuron recordings in the 8-Br-cAMP condition. Inset, Percentage of neurons in each adaptation category for the 8-Br-cAMP condition.
- Figure 9.
SGNs supplemented with 8-Br-cAMP displayed selective responses by electrophysiological parameter and tonotopic location. A-C, APmax, action potential latency and duration, respectively, did not differ between region or condition. D, The current required to reach a constant negative potential from which comparisons between sag magnitude were made (−185 mV) was significantly different between regions in control, but not in the cAMP condition. E, Ih sag magnitude differed significantly between base and apex neurons in vehicle control and between vehicle control and 8-Br-cAMP conditions for each tonotopic region. F, RMP level was significantly elevated in the 8-Br-cAMP condition compared with vehicle control for each tonotopic region. G, H, APD and APR threshold current levels, respectively, differed only between base and apex neurons in the vehicle control condition. I, APRE threshold current was not significantly different between regions or conditions. J-L, APD, APR, and APRE threshold voltage levels, respectively, did not differ between regions or conditions. M, N, Linear fits to apex, middle, and base APR threshold voltages plotted as a function of input current showed slopes with a greater divergence between tonotopic regions in control than in the 8-Br-cAMP condition, respectively. The slopes (mV/pA) and R2 values are as follows: control: apex = 0.0413, 0.886, middle = 0.0319, 0.713, base = 0.0164, 0.561; cAMP: apex = 0.0328, 0.835, middle = 0.0243, 0.414, base = 0.0259, 0.767). O, Significant differences in Rin between tonotopic categories in the control condition are no longer present in the cAMP condition.
- Figure 10.
Dual gradients of APD and APR threshold current levels and Rin observed between adaptation classes and cochlear locations were altered by cAMP. A-C, For the control condition, significant tonotopic differences were restricted to RA neuron measurements, while significant differences between adaptation categories were consistently found in the middle and apex. D-F, In the cAMP condition, tonotopic differences displayed by RA neurons were eliminated and adaptation-specific differences were limited to the apex. Interestingly, a new tonotopic difference emerged for SA neurons, but only for Rin (F).
- Figure 11.
Diverse hyperpolarization protocols are powerful modulators of stimulus detection and resolution by shifting the relationship between current responsiveness and output sensitivity. A, Fitted functions from data in Figure 6A (APRE, APD, and APR, light gray, and black solid lines, and blue-gray dashed line, respectively) exemplify how voltage to current relationships can be shifted along the x and y axes (thin gray, black and blue-gray arrows) within a uniform population of neurons. The rebound excitation voltage protocol lowers APRE threshold voltage compared with APD, while requiring lower depolarizing current input to do so. The compression of both voltage and current heterogeneity of these parameters results in enhanced resolution (steeper slope). Thus, by limiting the voltage and current dynamic ranges for the same group of cells, neurons within a uniform population are endowed with enhanced responsivity, sensitivity, and resolution. APR in response to hyperpolarizations, on the other hand, show the lowest resolution. The compression of voltage sensitivity (y axis, dotted arrows) and expansion of current input responsiveness (x axis, dotted arrows) are responsible for changing the slope of their relationship. B, Fitted functions from Figure 6E progressively shift in sensitivity (y axis, −60 and −80 mV holding potential for red and navy blue, respectively) and responsiveness (y axis, colored arrows), while maintaining resolution (slope of the functions). Thus, amplifying dissimilarities of a specific parameter (i.e., APRϴ) permits greater accuracy in comparative discriminations, such as those required for sound localization, whereas enhanced resolution is classically used by the nervous system to improve the detection of stimulus form (i.e., APRE).
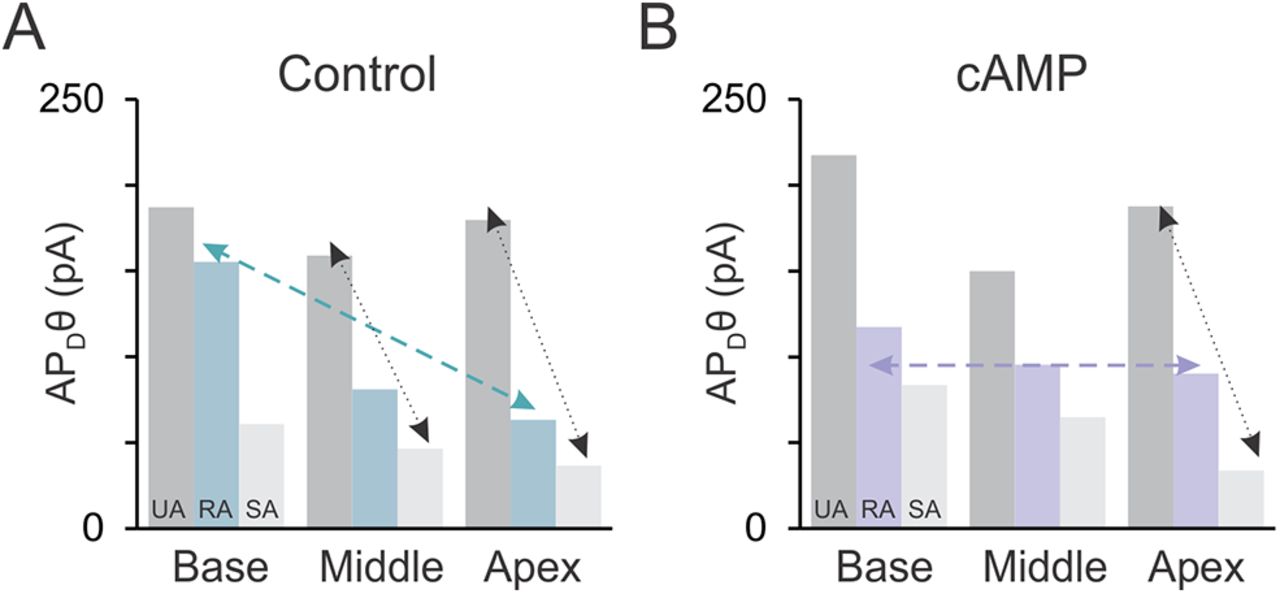
- Figure 12.
Patterns of input responsivity form multiple gradients in the spiral ganglion that were dynamically and selectively modulated. A, In the control condition, average APD input responsivity was graded as a function of adaptation category in the middle and apex regions (dotted double arrows). These electrophysiological features were also tonotopically graded, yet interestingly, this observation was limited to the RA neurons (dashed double arrow). The electrophysiological behavior summarized for APD was also observed for APR current thresholds, as was the expected reciprocal activity for Rin. B, Selective modulation by cAMP eliminated the RA tonotopic gradient (dashed double arrow) and restricted the significance of the local gradients between adaptation groups to the apex.


