

Abstract
GABAergic inhibition in neurons plays a critical role in determining the output of neural circuits. Neurons in avian nucleus magnocellularis (NM) use several tonotopic-region-dependent specializations to relay the timing information of sound in the auditory nerve to higher auditory nuclei. Previously, we showed that feedforward GABAergic inhibition in NM has a different dependence on the level of auditory nerve activity, with the low-frequency region having a low-threshold and linear relationship, while the high-frequency region has a high-threshold and step-like relationship. However, it remains unclear how the GABAergic synapses are tonotopically regulated and interact with other specializations of NM neurons. In this study, we examined GABAergic transmission in the NM of chickens of both sexes and explored its contributions to the temporal coding of sound at each tonotopic region. We found that the number and size of unitary GABAergic currents and their reversal potential were finely tuned at each tonotopic region in the NM. At the lower-frequency region, unitary GABAergic currents were larger in number but smaller in size. In addition, their reversal potential was close to the resting potential of neurons, which enabled reliable inhibition despite the smaller potassium conductance. At the higher-frequency region, on the other hand, unitary GABAergic currents were fewer, larger, and highly depolarizing, which enabled powerful inhibition via activating the large potassium conductance. Thus, we propose that GABAergic synapses are coordinated with the characteristics of excitatory synapses and postsynaptic neurons, ensuring the temporal coding for wide frequency and intensity ranges.
SIGNIFICANCE STATEMENT We found in avian cochlear nucleus that the number and size of unitary GABAergic inputs differed among tonotopic regions and correlated to respective excitatory inputs; it was larger in number but smaller in size for neurons tuned to lower-frequency sound. Furthermore, GABAergic reversal potential also differed among the regions in accordance with the size of Kv1 current; it was less depolarized in the lower-frequency neurons with smaller Kv1 current. These differentiations of GABAergic transmission maximized the effects of inhibition at each tonotopic region, ensuring precise and reliable temporal coding across frequencies and intensities. Our results emphasize the importance of optimizing characteristics of GABAergic transmission within individual neurons for proper neural circuit function.
Introduction
The avian nucleus magnocellularis (NM) is the second-order nucleus in the auditory pathway, homologous to anteroventral cochlear nucleus (AVCN) in mammals. It is responsible for transmitting the timing information of sound to binaural coincidence detectors in nucleus laminaris for computation of interaural time differences of microsecond orders (Hackett et al., 1982; Young and Rubel, 1983). To do so, neurons within the NM generate action potentials reliably and precisely in response to excitatory synaptic inputs from the auditory nerve (Trussell, 1999). NM neurons are tuned to a specific frequency of sound (characteristic frequency [CF]) and arranged tonotopically within the nucleus (Rubel and Parks, 1975). Temporal jitter of auditory nerve activity differs along the tonotopic axis, and it becomes larger for lower CF (Warchol and Dallos, 1990; Fukui et al., 2006). This variation is compensated for by presynaptic and postsynaptic specializations in NM. For example, the number and size of excitatory inputs differ tonotopically; low-CF neurons converge multiple small inputs, whereas high-CF neurons receive a single large input to generate a spike (Parks and Rubel, 1978; Jhaveri and Morest, 1982; Carr and Boudreau, 1991; Köppl, 1994; Fukui and Ohmori, 2004; Oline and Burger, 2014). NM neurons also differ along the tonotopic axis in the expression of voltage-gated ion channels, such as potassium channels (Kv1.1) and sodium channels (Nav1.6); Kv1-channel expression was lower while Nav-channel expression was higher in the low-CF neurons compared with the high-CF neurons (Fukui and Ohmori, 2004; Kuba and Ohmori, 2009; Akter et al., 2018, 2020).
GABAergic inhibition plays a critical role in determining the output of the NM, and the level of inhibition is regulated based on ongoing inputs (Burger et al., 2011). GABAergic projection fibers in NM originate from superior olivary nucleus (SON), which are driven by the auditory nerve via nucleus angularis, the other cochlear nucleus in birds (see Fig. 1A) (Lachica et al., 1994; Yang et al., 1999; Burger et al., 2005). Recently, we showed that GABAergic inputs increase linearly with excitatory inputs in low-CF neurons during the auditory nerve stimulation, whereas they are recruited at much higher intensities than excitatory inputs in high-CF neurons (Al-Yaari et al., 2020). The linearly coupled GABAergic inputs in the low-CF neurons would require fine adjustment of synaptic conductance, including the size as well as the number of unitary conductance. In addition, GABAergic inputs are depolarizing in the high-CF neurons, and the inhibition is mediated via activations of Kv1 conductance as well as GABAergic shunting conductance (Hyson et al., 1995; Monsivais et al., 2000; Lu and Trussell, 2001; Howard et al., 2007), emphasizing the importance of GABAergic reversal potential (equilibrium potential of Cl–, ECl) in regulation of postsynaptic conductances. However, how GABAergic transmission interacts with other presynaptic and postsynaptic characteristics in the NM is not fully understood.
In this study, we examined the number and size of IPSCs and their reversal potential along the tonotopic axis, and explored their implication in the temporal coding in NM. We found that unitary GABAergic inhibitory current was smaller and uniform in low-CF neurons, which was preferable in shaping the graded inhibition. Importantly, ECl was close to the resting potential in the neurons, ensuring inhibitory effects despite their small Kv1 conductance, which allowed reliable and precise spike output during the converging excitatory input. On the other hand, unitary inhibitory current was much larger and ECl was depolarizing in high-CF neurons, which would be suited to activate Kv1 conductance and accomplish powerful inhibition against the large excitatory input. Our results highlighted the importance of interaction among GABAergic transmission, excitatory transmission, and postsynaptic neuronal properties for proper neural circuit function.
Materials and Methods
Animals
Chickens (Gallus domesticus) of either sex at 1-7 d of age were used in this study, unless otherwise stated. The care of experimental animals was in accordance with animal research at Nagoya University, and the experiments were approved by the institutional committee.
Tonotopic regions of NM
Definitions of tonotopic regions were described previously (Al-Yaari et al., 2020), and neurons in low-CF and high-CF regions were used in this study. The low-CF region would correspond to NMc in Wang et al. (2017), where neurons have substantial dendrites (Akter et al., 2018).
Immunohistochemistry
Rabbit polyclonal vesicular GABA transporter (VGAT) antibody (2 µg/ml, Synaptic Systems), mouse monoclonal microtubule associated protein 2 (MAP2) antibody (1:200, Sigma), rabbit polyclonal Na+-K+-2Cl− cotransporter 1 (NKCC1) antibody (1 µg/ml, Millipore), and mouse monoclonal K+-Cl− cotransporter 2 (KCC2) antibody (5 µg/ml, University of California–Davis) were used for immunohistochemistry. Detailed immunostaining procedures were described previously (Kuba et al., 2010). Animals were perfused transcardially with periodate-lysine-PFA fixative (ml/g body weight): 2% (w/v) PFA, 2.7% (w/v) lysine HCl (Nacalai), 0.21% (w/v) NaIO4, 0.1% (w/v) Na2HPO4. The brainstem was postfixed for 2 h at 4°C. After cryoprotection with 30% (w/w) sucrose in PBS, coronal sections (30 µm) were obtained. The sections were incubated overnight with the primary antibodies, then with Alexa-conjugated secondary antibodies (10 µg/ml, Invitrogen) for 2 h, and were observed under a confocal laser-scanning microscope (FV1000, Olympus) with a 40× objective lens (NA0.95, Olympus). Serial sections were z-stacked with a step of 1 µm. VGAT-positive particles and MAP2-positive NM cells were quantified as described previously (Nishino et al., 2008). A series of two images were stacked, and the number of VGAT-positive particles was counted automatically using ImageJ for an ROI (160 × 160 µm) after setting a threshold by eye. The number of neurons within each ROI was determined by eye.
Slice preparation
Slices were prepared as described previously (Al-Yaari et al., 2020). After decapitation under deep anesthesia with ether, brainstem was isolated and immersed in an oxygenated ice-cold high-glucose ACSF (HG-ACSF, concentration in mm as follows: 75 NaCl, 2.5 KCl, 26 NaHCO3, 1.25 NaH2PO4, 1 CaCl2, 3 MgCl2, 100 glucose, saturated with 95% O2 and 5% CO2). The brainstem was embedded in 3%-4% agarose (Nacalai) and glued to a slicing chamber filled with HG-ACSF. Horizontal acute brain slices (200 µm) were cut with a vibratome (VT1200, Leica Microsystems), and they were stored in HG-ACSF (37°C) for 30-45 min before use.
Electrophysiology
Slices were perfused with an oxygenated ACSF (in mm as follows: 125 NaCl, 2.5 KCl, 26 NaHCO3, 1.25 NaH2PO4, 2 CaCl2, 1 MgCl2, 0.04 DNQX, 0.05 AP5, 17 glucose, saturated with 95% O2 and 5% CO2), and recordings were made at 37°C. Patch pipettes had a resistance of 2-3 mΩ, and a Cs+-based internal solution (in mm as follows: 150 CsCl, 10 NaCl, 0.2 EGTA, 10 HEPES, pH 7.2) was used to facilitate voltage clamp. ECl was at ∼5 mV, while membrane potential was held at –63 mV unless otherwise stated. Miniature IPSCs (mIPSCs) were recorded in the presence of TTX (1 μm, Sigma) in the bath. When measuring ECl, the occurrence of mIPSCs was facilitated by elevating CaCl2 to 4 mm and adding DTX (10-100 nm, Alomone Labs) in the bath. Evoked IPSCs were recorded under the blockade of Nav channels with QX314-Br (6 mm, Alomone Labs) in the pipette (Talbot and Sayer, 1996). Spontaneous spikes were recorded under cell-attached clamp using a pipette filled with the ACSF and blocking Kv1 channels with DTX (40 nm) in the bath, while GABA (50 μm in ACSF) was puff-applied through the other pipette placed at ∼30 µm away from the recorded cells.
Electrical stimulation
Unitary IPSCs (uIPSCs) were evoked with a theta-glass electrode (1-µm tip diameter) placed at a distance of 40-60 µm from the soma. Maximum IPSCs were induced with a bipolar tungsten electrode (50-µm-tip diameter) placed in the dorsolateral side of NM at a distance of ∼300 µm away from the recorded cells. Biphasic square pulses were produced with an electronic stimulator (SEN-7203, Nihon Kohden) and applied through an isolator (SS-202J, Nihon Kohden). Stimulus intensity was adjusted by changing the duration of pulses at a constant amplitude (Al-Yaari et al., 2020).
Data acquisition and analysis
Recordings were made with a patch-clamp amplifier (EPC8, HEKA Elektronik). Output signals were low-pass filtered at 3 kHz, sampled at 50 kHz (BNC-2090A, National Instruments), stored and analyzed on a personal computer with AxoGraph X (AxoGraph Scientific). Series resistance (<10 mΩ) was not compensated, while liquid junction potential (3 mV) was corrected offline for whole-cell recording. mIPSCs were filtered offline at 1 kHz. Ensemble averages of mIPSCs were made from >70 events, whereas overlapping events were excluded from the analysis. Rise time of mIPSCs was measured between the periods of 10%-90% amplitude, and half-width at 50% amplitude. Coefficient of variation (CV) of IPSC amplitude was calculated from 10 to 50 events. uIPSCs were defined as the responses at the minimum stimulus, where a rate of failure responses was >30%. Maximum IPSCs were defined as the responses, whose amplitude did not increase further with an increase of stimulus intensity by 30%-100% after reaching a plateau.
Gramicidin perforated-patch recording
Gramicidin perforated-patch recording was performed as described previously (Kim and Trussell, 2007). Briefly, gramicidin D (0.05 mg in 1 µl DMSO, Sigma) was added into 1 ml of a K+-based solution (in mm as follows: 140 KCl, 10 NaCl, and 10 HEPES-KOH, pH 7.2), and GABAergic currents were recorded with the puff-application of GABA (50 μm) after series resistance reached ∼20 mΩ, which was compensated by >80%. Liquid junction potential was not corrected (Kim and Trussell, 2007). ECl was measured as an intersection of least square regression line in current–voltage relationship. Intactness of the patch membrane was confirmed by the absence of fluorescence in the cell. Animals at embryonic day 21 (E21) and posthatch day 0 (E22/P0) were used because ECl is reported to reach a mature level by E17 (Lu and Trussell, 2001).
Two-photon Cl– imaging
Two-photon Cl– imaging was performed with a Cl– indicator (n-6-methoxyquinolyl acetoethyl ester [MQAE], Biotium), as described previously (Adachi et al., 2019). A slice was incubated in HG-ACSF containing 6 mm MQAE for 10 min at 37°C, and then washed in dye-free solution for 10 min at room temperature. The laser was tuned to 750 nm, and fluorescence signal peaked at 460 nm was captured with a 25×, 1.05-NA objective (Olympus), a dichroic mirror (SDM570), bandpass filters (FF01-510/84-25 and FF01-630/92-25), and a GaAsP detector. During imaging, ACSF was circulated, while Cl– channels were blocked by adding NPPB (200 μm, R&D Systems) in the bath. The temperature was 30°C. GABA (50 μm) was puff-applied through a pipette near the imaged cells. Data were collected in a frame scan mode with 10 µs/pixel at 0.3 Hz, and signals for a cell were calculated as an average of the somatic area. Data are expressed as ΔF/F0, where F0 is the baseline fluorescence before application of GABA. Effects of GABA were evaluated at the end of application (30-60 s), at which Cl– signals reached a plateau.
qRT-PCR
Detailed procedures were described previously (Kuba et al., 2015). NM was excised with a fine needle under an observation with a dissecting microscope. Extensive care was taken to avoid a contamination of surrounding tissues, and tissues from 3 animals were pooled for each set of experiments. Total RNAs were extracted from either low-CF or high-CF region of NM using NucleoSpin RNA XS kit (TaKaRa). Quality and concentration of extracted RNA were measured with Agilent 2100 Bioanalyzer (Agilent Technologies), and cDNA was synthesized using ReverTra Ace qRT-PCR kit (Toyobo). mRNA levels for NKCC1, KCC2, and GAPDH were quantified using Thunderbird SYBER qPCR Mix (Toyobo) with a StepOne Real-Time PCR system (Applied Biosystems). Primers used are listed in Table 1. Cycle threshold data of individual molecules were analyzed with GAPDH as an internal standard, and they were compared between tonotopic regions.
Primer sets used in this work
Simulation
Neuronal modeling and simulation were performed with NEURON 7.6, using a model of low-CF NM neurons, as described previously (Al-Yaari et al., 2020). Excitatory input consisted of multiple unitary EPSC conductances (uEPSGs), and the input timing of each uEPSG varied randomly according to the normal distribution with a SD of 0.24 ms. Individual uEPSG had a profile of α function (= gsyn • t/τsyn • exp(1 – t/τsyn)), time constant (τsyn) of 0.3 ms, and amplitude of 4 nS, corresponding to those in low-CF NM neurons (Fukui and Ohmori, 2004). Inhibitory input consisted of multiple unitary IPSC conductances (uIPSGs), each of which was a tonic conductance with the size and the number the same as those of uEPSG otherwise stated (Al-Yaari et al., 2020). Parameters of spike responses were calculated from 2000 trials. Probability of spikes was defined as the probability during the trials, threshold conductance as the number of uEPSGs exceeding probability of 0.05, and jitter as the SD of spike timing.
Statistics
Data were presented as a mean ± SE (n = number of cells). Normality of data and equality of variance were evaluated by Shapiro–Wilk test and F test, respectively. Statistical significance was determined by two-tailed Student's t test for comparison between two groups. ANOVA or Kruskal–Wallis test was used for comparison among more than two groups with normal or non-normal distributions, respectively, and post hoc Tukey test or Steel–Dwass test for pairwise comparisons. The level of significance was set at 0.05.
Results
A larger number of GABAergic synapses would impinge on low-CF neurons
GABA-immunopositive terminals are densely accumulated at caudolateral areas in NM (Code et al., 1989). Therefore, we hypothesized that low-CF neurons receive more GABAergic synapses than high-CF neurons. To test this idea, we conducted immunohistochemistry using antibodies against VGAT and MAP2 at each tonotopic region of NM (Fig. 1B,C). Quantitative analyses revealed that the density of VGAT-positive particles was higher at the low-CF region (Fig. 1D), while the density of MAP2-positive NM neurons did not differ between the regions (Fig. 1E), leading to a larger number of VGAT-positive particles per cell at the low-CF region (Fig. 1F). On the other hand, the size of VGAT-positive particles was not different between the tonotopic regions (Fig. 1G).

VGAT-positive particles were heavily accumulated at low-CF region. A, Auditory pathway of the chicken. AN, Auditory nerve; NA, nucleus angularis. B, Tonotopic regions were based on the position within the NM (see Materials and Methods). C, Double immunostaining of VGAT (green) and MAP2 (red) at low- (top) and high-CF (bottom) regions from the same animal. D-G, Density of particles (D), density of NM cells (E), number of particles per cell (F), and size of particles (G). Values from individual animals are plotted (circles). **p < 0.01 between tonotopic regions. Numbers in parentheses are the number of animals.
GABAergic quantal events are smaller and occur more frequently in low-CF neurons
To further evaluate the number of GABAergic synapses in each NM neuron, we first recorded mIPSCs at each tonotopic region in the presence of DNQX (40 μm) and TTX (1 μm) in the bath (Fig. 2). mIPSCs were identified as inward currents when recorded at –63 mV with the CsCl-based internal solution (ECl of 5 mV) (Fig. 2A). The amplitude of mIPSCs varied greatly at both tonotopic regions, but its distribution in the histogram was narrower and negatively shifted in low-CF neurons, making the mean amplitude of mIPSCs smaller by 2 times in the neurons (Fig. 2B–D). Of note, the fraction of mIPSCs <0.2 nA, which roughly reflected the fraction around the primary peak in Figure 2B, was 86% in the low-CF neurons, whereas it was 47% in the high-CF neurons. These smaller mIPSCs tended to have faster time course for both rise time and half-width (Fig. 2G–J). This made mIPSCs in the low-CF neurons slightly faster than those in the high-CF neurons; the rise time was 0.7 ± 0.1 ms and 1.0 ± 0.1 ms (p = 0.009), while the half-width was 16.3 ± 1.1 ms and 19.2 ± 1.4 ms (p = 0.1) in low-CF (n = 8) and high-CF (n = 8) neurons, respectively. This also rules out potential effects of filtering by dendrites in the low-CF neurons (Akter et al., 2018).

Number of release sites rather than probability would be different tonotopically. A, mIPSCs were recorded in low-CF (blue) and high-CF (black) neurons (left), and 10 events were superimposed (right). SD of baseline was 3.2 ± 0.3 pA and 3.7 ± 0.4 pA for low-CF (n = 8) and high-CF (n = 8) neurons, respectively. B, Histogram of mIPSC amplitude. Data from different cells were pooled and plotted for low-CF (1636 events, 8 cells) and high-CF (966 events, 8 cells) regions. C, E, Cumulative plot of amplitude (C) and interevent interval (E) of mIPSCs from B. Statistical significance was tested by Kolmogorov–Smirnov test. D, F, Amplitude (D) and interevent interval (F) of mIPSCs. Values from individual cells are plotted (circles). G, I, Relationship between amplitude and rise time of mIPSCs in low-CF (G) and high-CF (I) neurons. H, J, Relationship between amplitude and half-width of mIPSCs in low-CF (H) and high-CF (J) neurons. K, IPSCs evoked by a train of 20 stimuli at 100 Hz. SON fibers were stimulated with a bipolar tungsten electrode. Five traces were superimposed, and they were ensemble-averaged (thick traces). IPSCs were temporally summated and reached a plateau in both neurons, and the extents of depression and fluctuation did not differ tonotopically (red circles, text), suggesting that release probability would be similar between the neurons. *p < 0.05, ***p < 0.001 between tonotopic regions. Numbers in parentheses are the number of cells.
The interevent interval of mIPSCs also differed between the tonotopic regions, being shorter by 2 times in the low-CF neurons (Fig. 2E,F). When the frequency of mIPSCs was calculated from the interevent interval, it was 6.2 ± 1.4 Hz and 2.4 ± 0.4 Hz (p = 0.02) in low-CF (n = 8) and high-CF (n = 8) neurons, respectively. This raised two possibilities: one is that the low-CF neurons receive more GABAergic synapses and the other is that they receive GABAergic synapses with higher release probability.
Release probability at GABAergic synapses does not differ tonotopically
We next examined release probability of GABAergic synapses at each tonotopic region by applying a train of 20 pulses at 100 Hz to projection fibers from SON with a bipolar tungsten electrode (Fig. 2K). In both tonotopic regions, IPSCs declined sharply during the train, while they were temporally summated to reach a plateau level because of the slow time course, which would underlie the stable inhibition during ongoing inputs (Lu and Trussell, 2000; Al-Yaari et al., 2020). The extent of synaptic depression did not differ between the tonotopic regions; the average IPSC amplitude relative to that at the first stimulus was 0.25 ± 0.05 and 0.30 ± 0.05 (p = 0.97) for the second stimulus, while 0.07 ± 0.01 and 0.05 ± 0.01 (p = 0.56) for the 18th-20th stimuli in low-CF (n = 9) and high-CF (n = 10) neurons, respectively (Steel–Dwass test after Kruskal–Wallis test). The fluctuation of IPSC amplitude was also similar between the regions, being larger at a later period of the train, presumably because of a progression of vesicle depletion; CV of amplitude was 0.17 ± 0.03 and 0.15 ± 0.03 (p = 0.99 by Tukey test) for the first stimulus, while 0.47 ± 0.09 and 0.59 ± 0.09 (p = 0.63 by Tukey test) for the 18th-20th stimuli in low-CF (n = 7) and high-CF (n = 7) neurons, respectively (F(1,24) = 0.55, p = 0.47 for tonotopy; F(1,24) = 30.73, p <0.01 for train by two-way ANOVA). These results indicated that the release probability and rate of replenishment at GABAergic synapses do not differ between the tonotopic regions. This implied that the higher mIPSC frequency at the low-CF region would reflect a larger number of GABAergic synapses impinging on a cell, which is consistent with the immunohistochemical findings (Fig. 1).
A larger population of GABAergic neurons project onto low-CF neurons
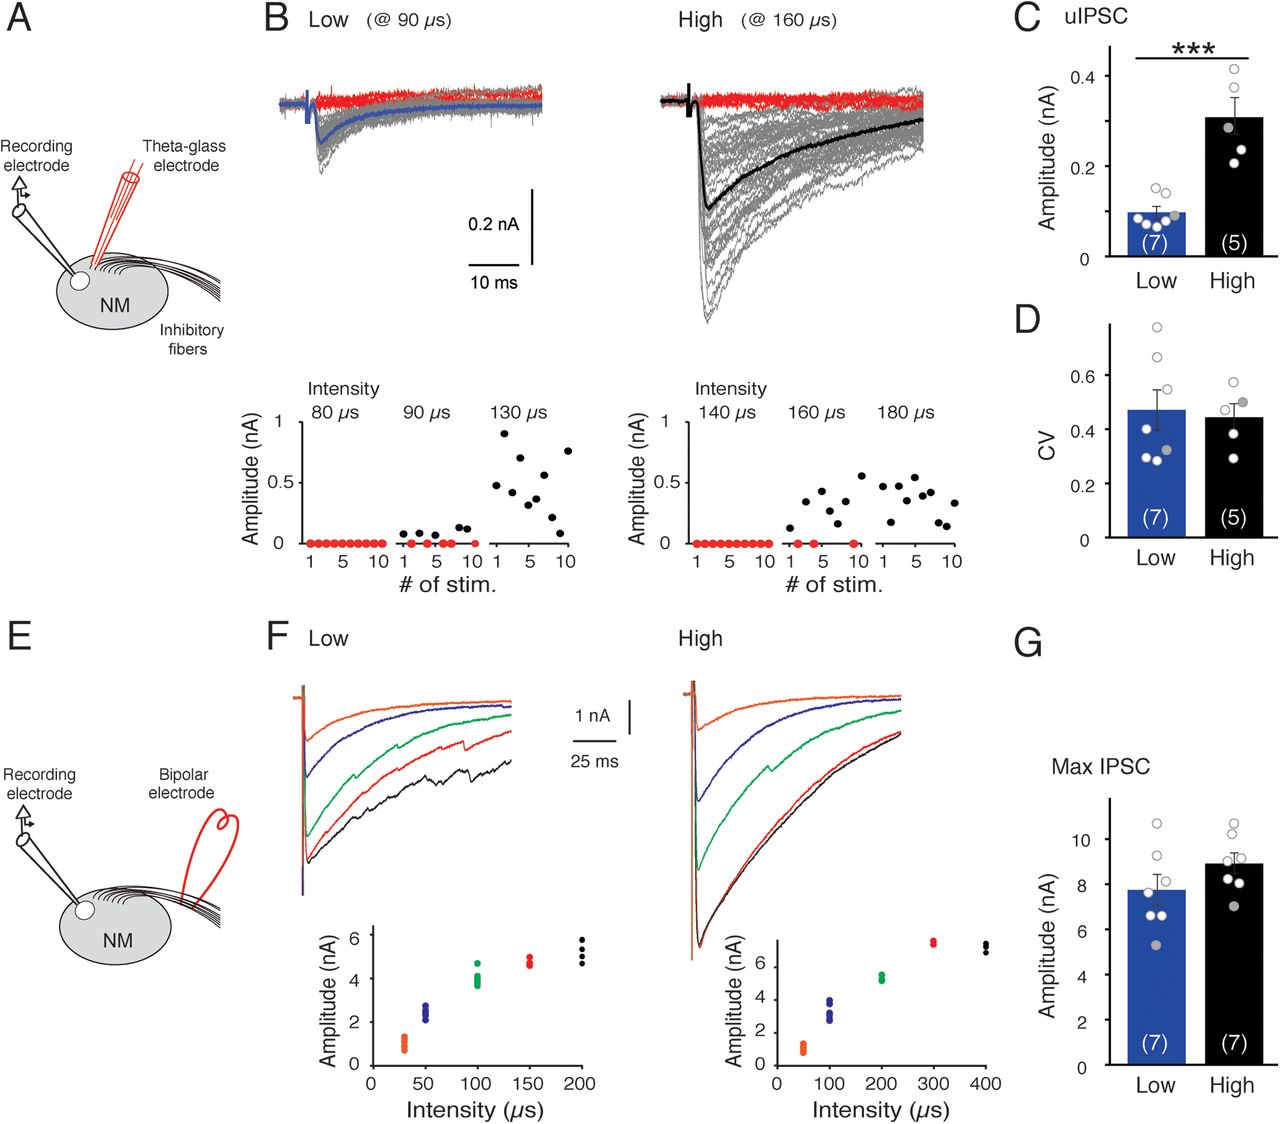
The number and the strength of GABAergic synapses were further evaluated at each tonotopic region (Fig. 3). We stimulated a projection fiber from SON in the vicinity of the cell using a theta glass electrode and recorded putative uIPSCs in NM neurons at the minimum intensity to cause current responses (gray traces) (Fig. 3A,B). Failure responses (red traces) occurred in >30% of trials at the minimal intensity, and they disappeared and the amplitude increased with an increase in the intensity. The uIPSC amplitude in low-CF neurons was 3 times smaller than in high-CF neurons (Fig. 3C). However, the CV of uIPSC amplitude did not differ between the neurons (Fig. 3D), confirming the similar release probability regardless of the tonotopic regions. We found that the amplitude and kinetics of uIPSCs were similar to those of mIPSCs; the rise time was 1.0 ± 0.1 ms and 0.9 ± 0.1 ms (p = 0.3), and the half-width was 13.5 ± 4.0 ms and 15.0 ± 2.0 ms (p = 0.4) for low-CF (n = 7) and high-CF (n = 5) neurons, respectively. This raised the possibility that the stimuli with the theta electrode underestimated the amplitude of uIPSCs because of a blockade of antidromic spike conduction into other branches. Therefore, we stimulated a fiber more proximally using a bipolar electrode placed at the dorsolateral side of NM, but the amplitude of uIPSCs did not differ from that by the theta electrode (data not shown).

uIPSCs were smaller in size and larger in number at low-CF region. A, A single SON fiber was stimulated in the vicinity of recorded cell with a theta glass electrode. B, uIPSCs in low-CF and high-CF neurons. Consecutive ∼50 traces were superimposed, showing substantial failure events (red) as well as unitary events (gray). Unitary events were ensemble-averaged (thick traces) (top). Amplitude of IPSCs in the cells was plotted for 10 trials at 3 different stimulus intensities (bottom). C, D, Amplitude of uIPSCs (C) and its CV (D). E, SON fibers were stimulated at the dorsolateral side of NM with a bipolar tungsten electrode. F, IPSCs at different stimulus intensities were superimposed. Amplitude of IPSCs in the cells was plotted for 2-6 trials at each stimulus intensity (inset). The stimulus intensity was adjusted by changing the pulse duration, while the pulse amplitude was kept constant. G, Maximum amplitude of IPSCs. Values from individual cells are plotted (circles), and those for the displayed traces are filled with gray. ***p < 0.001 between tonotopic regions. Numbers in parentheses are the number of cells.
We then examined the maximum IPSCs in NM neurons with the bipolar electrode (Fig. 3E–G). With an increase of the stimulus intensity, the amplitude of IPSCs increased systematically, and the maximum level (black trace) did not differ substantially between low-CF and high-CF neurons; it was 7.8 ± 0.7 nA and 8.9 ± 0.5 nA (p = 0.19) for low-CF (n = 7) and high-CF (n = 7) neurons, respectively. Together, these results indicated that low-CF neurons would receive GABAergic inputs from a larger population of SON neurons, while each input was smaller in the neurons, making the maximum GABAergic current similar between the neurons. The maximum IPSCs showed a slower decay kinetics. This might reflect a delayed clearance of transmitters after a robust transmitter release (Nusser et al., 2001; Barberis et al., 2004) and/or a voltage-clamp error, which could occur because of the large synaptic current despite the usage of Cs+-based internal solution.
GABAergic current is not so depolarizing in low-CF neurons
Inhibitory synaptic strength is determined by reversal potential (ECl) as well as conductance of GABAergic current. Therefore, we estimated ECl at each tonotopic region by recording mIPSCs immediately after the formation of whole-cell configuration (Fig. 4). We first measured the time course of replacement of cytosol with the pipette solution (ECl = 5 mV) after break-in in high-CF neurons, as the physiological ECl in the neurons was characterized by perforated patch recordings (∼–30 mV) (Lu and Trussell, 2001; Monsivais and Rubel, 2001; Howard et al., 2007). When the membrane potential was held at –13 mV, more positive than the physiological ECl, mIPSCs reversed from outward to inward at 8-10 s after break-in (Fig. 4A). In addition, when the membrane potential was held at –33 mV, near the physiological ECl, mIPSCs did not appear until 0.7 s after break-in, but they were obvious and became bigger rapidly afterward; the mean amplitude of mIPSCs calculated at each bin (1 s width) increased with a time constant of 6.1 s (Fig. 4B). Therefore, we used mIPSCs within 0-0.4 s after break-in, which was sufficiently shorter than the time course of replacement, for our estimation of ECl.

Reversal potential of IPSCs was less depolarized at low-CF region. A, mIPSCs recorded immediately after break-in in high-CF neurons. Membrane was held at –13 mV, positive to ECl of the cells in previous literatures (∼–30 mV). Amplitude reversed from outward to inward at 8-10 s after break-in. Periods indicated by bars (a, b) are expanded (bottom). B, mIPSCs recorded immediately after break-in in high-CF neurons. Membrane was held at –33 mV, near ECl of the cells. mIPSCs were not observed until 0.7 s after break-in, while a barrage of events occasionally caused extremely large responses (inset). Periods indicated by bars (a-c) are expanded (right). Arrowheads indicate individual steps. Time course of mean mIPSC amplitude at each bin (1 s width) (right bottom). Mean amplitude increased with a time constant of 6.1 s in the least squares fitting with a single exponential function. C, mIPSCs immediately after break-in in low-CF neurons held at four different holding potentials (left). Top, –3 mV; top middle, –33 mV; bottom middle, –53 mV; bottom, –73 mV. Mean mIPSC amplitude against holding potentials in low-CF neurons (right). Events within 0.4 s after break-in (∼15 events) were measured, and mean amplitude >10 pA was plotted. ECl was –50 mV from an intersection of least squares regression line. D, mIPSCs immediately after break-in in high-CF neurons held at four different holding potentials (left). Top, –13 mV; top middle, –33 mV; bottom middle, –53 mV; bottom, –73 mV. Mean mIPSC amplitude against holding potentials in high-CF neurons (right). ECl was –33 mV. E, F, GABAergic current at different holding potentials under gramicidin perforated-patch recording in low-CF (E) and high-CF (F) neurons. GABA (50 μm) was puff-applied through a pipette (100 ms). The current reversed between –60 and –50 mV in E, and between –25 and –8 mV in F. Yellow circles in (C) and (D) represent ECl in perforated-patch recording for low-CF (n = 6) and high-CF (n = 5) neurons, respectively. G, H, Two-photon Cl– imaging in low-CF (G) and high-CF (H) neurons before (left) and during (right) puff-application of GABA (50 μm). I, Effects of GABA on Cl– signals (ΔF/F0). Values from individual cells are plotted (circles). J, K, Cell-attached recordings from low-CF (J) and high-CF (K) neurons during puff-application of GABA (50 μm). Under the blockade of Kv1 channels with DTX (40 nm), exogenous GABA suppressed spontaneous spikes in low-CF neurons, whereas it occasionally induced spontaneous spikes in high-CF neurons. Spontaneous spikes in squares are expanded in inset. ***p < 0.001, between tonotopic regions. #p < 0.05, ###p < 0.001, between before and during GABA application. Numbers in parentheses are the number of cells.
Low-CF neurons were held at a potential between –93 and –3 mV; mIPSCs were outward >–33 mV, not detectable at –43 to −53 mV, and inward <–73 mV (Fig. 4C). The mean mIPSC amplitude from each cell was plotted against the holding potential, and ECl was determined as an intersection of the fitted line. The estimated ECl was –50 mV, which was close to the resting potential of the cell (–60 mV) (Fukui and Ohmori, 2004). Importantly, the ECl was close to the reversal potential at which mIPSCs were not detectable (–43 to –53 mV), validating our procedure. We also estimated ECl in high-CF neurons with the same procedure (Fig. 4D); it was –33 mV, which was similar to that in the previous reports. These results indicated that ECl is differentiated along the tonotopic axis, and it is less depolarized in low-CF neurons than in high-CF neurons. Indeed, when ECl was measured under gramicidin perforated-patch recording, it was –50.5 ± 2.5 mV and –21.1 ± 3.9 mV (p < 0.0001) for low-CF (n = 6) and high-CF (n = 5) neurons, respectively (Fig. 4E,F; see also Fig. 4C,D, yellow circles).
We further tested the effects of exogenous GABA (50 μm) on [Cl–]i by two-photon Cl– imaging with a Cl– indicator (MQAE; Fig. 4G-I). When GABA (50 μm) was puff-applied through a pipette, it increased fluorescent signals (i.e., decreased [Cl–]i in NM neurons). However, the extent differed tonotopically; it was much smaller in low-CF neurons than in high-CF neurons. This result indicated that Cl– was extruded outside the cells through GABAA receptors weakly in the former but strongly in the latter, which agreed with the electrophysiological estimates of ECl. Under the blockade of Kv1 channels with DTX, spontaneous firing occurred in low-CF neurons presumably because of the strong expression of Nav channels (Kuba and Ohmori, 2009), but not in high-CF neurons (Fig. 4J,K). Importantly, the exogenous GABA suppressed the spontaneous firing in the low-CF neurons (4 of 4 cells), revealing the inhibitory effects of GABAergic shunting conductance in the absence of Kv1 conductance. In contrast, the exogenous GABA occasionally caused spontaneous firing in some high-CF neurons (2 of 12 cells), indicating the importance of Kv1 conductance in the inhibitory effects of depolarizing GABAergic inputs (Howard et al., 2007).
Expression of NKCC1 and KCC2 in NM
ECl is determined by an interaction of NKCC1 and KCC2, which accumulates and extrudes Cl–, respectively; NKCC1 depolarizes ECl and KCC2 counteracts this effect (Ben-Ari, 2002; Blaesse et al., 2009; Friauf et al., 2011). To explore the mechanisms underlying the less depolarized ECl in the low-CF neurons, we examined the expression of these molecules at each tonotopic region with qRT-PCR and immunohistochemistry (Fig. 5). We found that NKCC1 mRNA levels were 10 times higher than those of KCC2 at both regions (Fig. 5A,B). In addition, KCC2 immunosignals in NM neurons were much weaker than those in medial vestibular nucleus neurons (middle, arrows) and cerebellar neurons (right), where ECl is reported hyperpolarizing because of strong KCC2 expression (Seja et al., 2012) (Fig. 5C). On the other hand, NKCC1 immunosignals in NM neurons were not different from those in the vestibular and cerebellar neurons. These results suggested that KCC2 expression is suppressed, dominating NKCC1 over KCC2 in NM neurons. Notably, NKCC1 mRNA levels were lower at low-CF region than at high-CF region, whereas those of KCC2 did not differ between the regions. These might indicate that the lower expression of NKCC1 underlies the less depolarized ECl in the low-CF neurons, although we could not detect significant differences in the immunosignals between the tonotopic regions.

Expressions of NKCC1 and KCC2 in NM. A, B, Relative mRNA levels of NKCC1 (A) and KCC2 (B). Numbers in parentheses are the number of experiments, and individual values are plotted (circles). The y axis scale in (A) and (B) differs by a factor of 10. C, Immunostaining of NKCC1 (top) and KCC2 (bottom) for low-CF (left), high-CF (middle) regions of NM, and cerebellum (right) from the same animal. Arrows indicate medial vestibular nucleus. Arrowheads indicate Purkinje cell layer. *p < 0.05 between tonotopic regions. M, Medial; D, dorsal.
ECl is critical for reliable and precise temporal coding in low-CF neurons
We then explored the implication of less depolarized ECl in low-CF NM neurons with a computational model (Fig. 6). Since excitatory and inhibitory synaptic inputs change in parallel according to the level of auditory nerve activity in the neurons (Al-Yaari et al., 2020), we altered the number of uEPSGs (4 nS) with a jitter comparable with that observed in vivo (Fukui et al., 2006), while setting the number and size of tonic uIPSGs the same as that of uEPSGs. We simulated spike output in response to linearly coupled EPSGs and IPSGs for three different ECl. With an increase in the number of uEPSGs, the probability of spikes increased and their jitter became smaller, but the extent differed depending on ECl. When ECl was depolarized (–35 mV), IPSGs had small but obvious excitatory effects (Fig. 6B, top, D,E, white); threshold conductance became lower (5 uEPSGs), dynamic range narrower (4 uEPSGs), and jitter became marginally smaller (0.109 ms for 13 uEPSGs) than those without IPSGs; they were 5 uEPSGs, 5 uEPSGs, and 0.111 ms for 13 uEPSGs, respectively (Fig. 6A,D,E, red). When ECl was hyperpolarized (–65 mV), IPSGs had prominent inhibitory effects (Fig. 6B, bottom, D,E, black); threshold conductance increased (7 uEPSGs), dynamic range became wider (8 uEPSGs), and jitter remained large even at large conductances (0.139 ms for 13 uEPSGs). When ECl was near physiological range (–50 mV), these inhibitory effects were moderate (Fig. 6B, middle, D,E, gray); threshold conductance increased (6 uEPSGs) and dynamic range expanded slightly (5 uEPSGs) with little effects on jitter (0.123 ms for 13 uEPSGs). The effects of ECl on the impacts of IPSGs were apparent, when the spike probability was plotted against EPSGs and IPSGs systematically in a color scale (Fig. 6C). It showed a negative correlation between EPSGs and IPSGs for ECl of –35 mV (top), changed into a positive correlation for ECl of –50 mV (middle), and the positive correlation became steeper for ECl of –65 mV (bottom). These results indicated that inhibitory effects of IPSGs appear and become larger as ECl is less depolarized in the low-CF neurons. The excitatory effects of IPSGs for ECl of –35 mV would be attributed to the weak Kv1 conductance (gKlva, 60 pS/µm2 at the soma) in the low-CF neuron model. In support, apparent inhibitory effects appeared for IPSGs at ECl of –35 mV with a 2× increase of somatic gKlva (120 pS/µm2), comparable with that in the high-CF NM neurons (Akter et al., 2018), and the effects were further augmented with a 3× increase of the gKlva (180 pS/µm2) (Fig. 6F).

GABAergic reversal potential had critical impacts on reliability and precision of spike output in a model of low-CF neurons. A, Spike responses to four different levels of EPSG without IPSG. B, Effects of linearly coupled IPSGs on spike responses in a model with three different ECl. ECl of –35 mV (top), –50 mV (middle), and –65 mV (bottom). Numbers of uEPSGs (red circles) and uIPSGs (blue circles) are specified. C, Color plots of spike probability as a function of EPSGs and IPSGs. ECl of –35 mV (top), –50 mV (middle), and –65 mV (bottom). Probability was calculated from 2000 trials. D, Effects of ECl on relationship of spike probability against EPSGs. ECl of –35 mV (white), –50 mV (gray), and –65 mV (black). Values correspond to the dotted lines in C for uIPSGs of 4 nS. E, Effects of ECl on relationship of spike jitter against EPSGs. Jitter is defined as an SD of spike timing. F, Effects of depolarizing IPSC depend on somatic gKlva. Spike probability ratio between with IPSG and without IPSG was calculated for ECl of –35 mV at threshold intensity with IPSG (uIPSG = 4 nS). The ratio was >1 for original gKlva (60 pS/µm2) but decreased to <1 when somatic gKlva was elevated by 2 times (×2, 120 pS/µm2) and 3 times (×3, 180 pS/µm2).
Discussion
Differentiation of GABAergic synaptic convergence
NM neurons differ in the number and size of excitatory synaptic inputs from the auditory nerve among the tonotopic regions (Fukui and Ohmori, 2004). Recently, we showed that NM neurons have a tonotopic difference in the coupling between excitatory and inhibitory inputs during auditory nerve stimulation (Al-Yaari et al., 2020); the threshold of IPSCs is similar to that of EPSCs, and their amplitudes increase linearly in low-CF neurons, while the threshold is much higher and IPSCs appear only at a high stimulus intensity in high-CF neurons. The linearly coupled excitatory and inhibitory inputs in the low-CF neurons imply a convergence of inhibitory as well as excitatory projection fibers in the neurons. Indeed, we found, based on estimates from the uIPSCs, that the number of inhibitory fibers innervating a cell was far larger at low-CF region than at high-CF region; the number was ∼80 and ∼30 for low-CF and high-CF regions, respectively. In contrast, the tonotopic representation is linear in both SON and NM, and the extent of frequency convergence, expected from bandwidth (Q10 dB), does not differ tonotopically in SON (Rubel and Parks, 1975; Tabor et al., 2012). In addition, the bandwidth of SON inhibition in NM is not different tonotopically either (Fukui et al., 2010). Collectively, the prominent innervation of inhibitory fibers in the low-CF NM neurons would result from a convergence within a frequency band presumably because of extensive branching, although further anatomic studies are necessary.
Differentiation of unitary GABAergic conductance
uIPSCs were small and uniform at low-CF region, while they were more heterogeneous with appearance of extremely large events in the high-CF region. uIPSCs showed almost the same size and kinetics as mIPSCs, suggesting that the unitary events primarily reflect the quantal events in NM. What underlies the variation of quantal size in the high-CF neurons? Since the high-CF neurons do not have dendrites, we can rule out dendritic filtering (Jhaveri and Morest, 1982; Akter et al., 2018). Importantly, the size of mIPSCs was positively correlated with the rise time and half-width in the high-CF neurons, implying that larger events showed slower kinetics. This correlation could be accounted for by heterogeneities in both amounts of transmitters released from terminals and size of postsynaptic areas (Frerking et al., 1995; Nusser et al., 1997; Nusser et al., 2001; Barberis et al., 2004). In this scenario, a large amount of transmitter release elevates transmitter concentration in the synaptic cleft, which would activate postsynaptic receptors at wider areas and for longer periods via extensive diffusion and delayed clearance of the transmitters. Consistently, synaptic vesicles show a remarkable variation in their shape and size in GABAergic synapses (Tao et al., 2018), while expression level of vesicular GABA transporters and cytosolic concentration of GABA at terminals are known to regulate the content of GABA in a vesicle (Wojcik et al., 2006; Apostolides and Trussell, 2013; Wang et al., 2013). In addition, synaptic areas of GABAergic synapses in NM vary with each other by up to ∼10 times (0.5-5.5 µm2) (Parks, 1981). Together, these morphologic changes combined with GABAergic transporter levels could underlie the tonotopic variations of quantal and unitary events in NM.
Differentiation of GABAergic reversal potential
In NM, ECl is close to the resting potential in the low-CF region, while it is far above the resting potential in the high-CF region even after maturation (Hyson et al., 1995; Lu and Trussell, 2001). This suggests that there is a differential regulation of NKCC1 and KCC2 among the tonotopic regions. We found that NKCC1 expression dominated over that of KCC2, while the extent was smaller in the low-CF region. These findings may indicate that NKCC1 plays a central role in creating the tonotopic difference of ECl in the NM with the relatively lower NKCC1 expression level leading to less depolarized ECl in the low-CF region. NKCC1 and KCC2 are the major Cl– transporters at the auditory brainstem of the chicken, and both increase with development until hatch (Wirth et al., 2020). However, in this report, the expression level of KCC2 was higher than that of NKCC1, contradicting with our observations. This may be related to their use of the entire auditory brainstem, including surrounding vestibular structures that showed strong KCC2 immunosignals (Fig. 5). Interestingly, in spherical bushy cells, mammalian homologues of NM neurons, mRNA and protein levels of KCC2 remain high throughout development, but it is incorporated into the plasma membrane with maturation, which coincides with the hyperpolarizing shift of ECl (Balakrishnan et al., 2003; Friauf et al., 2011). This implies that the activity rather than the expression level of transporters is important in determining ECl. In addition, KCC2 activity is upregulated by post-translational modifications, such as oligomerization and dephosphorylation (Blaesse et al., 2006; Rinehart et al., 2009). Thus, alternative explanations for the tonotopic difference of ECl in NM could be that these post-translational modifications increase KCC2 activity and lower [Cl–]i in the low-CF neurons. NM neurons express other Cl– transporters, KCC1 and AE3 (Wirth et al., 2020), which could also affect the differentiation.
Implication of GABAergic differentiations in temporal coding
Temporal jitter of auditory nerve activity increases with a decrease of sound frequency (Warchol and Dallos, 1990; Fukui et al., 2006). The differentiations of NM neurons contribute to accomplish the reliable and precise temporal coding at each tonotopic region (Fig. 7). High-CF neurons receive a few end-bulb synapses and mediate high-fidelity synaptic transmission via the large EPSCs, preserving the small jitter of auditory nerve activity (Trussell, 1999) (Fig. 7B). Correspondingly, these neurons show large Kv1 current but small axonal Nav current, which suppresses aberrant spike generation during the large EPSCs (Fukui and Ohmori, 2004; Kuba and Ohmori, 2009). In addition, IPSCs are recruited specifically at intense sound (Fukui et al., 2010; Al-Yaari et al., 2020); hence, the large IPSCs would be particularly preferable for ensuring the efficient suppression in the neurons. Moreover, the depolarizing ECl has an additional advantage; the IPSCs can activate the large Kv1 conductance in addition to the GABAergic shunting conductance, facilitating the suppression and securing the precise timing of spike output (Howard and Rubel, 2010).
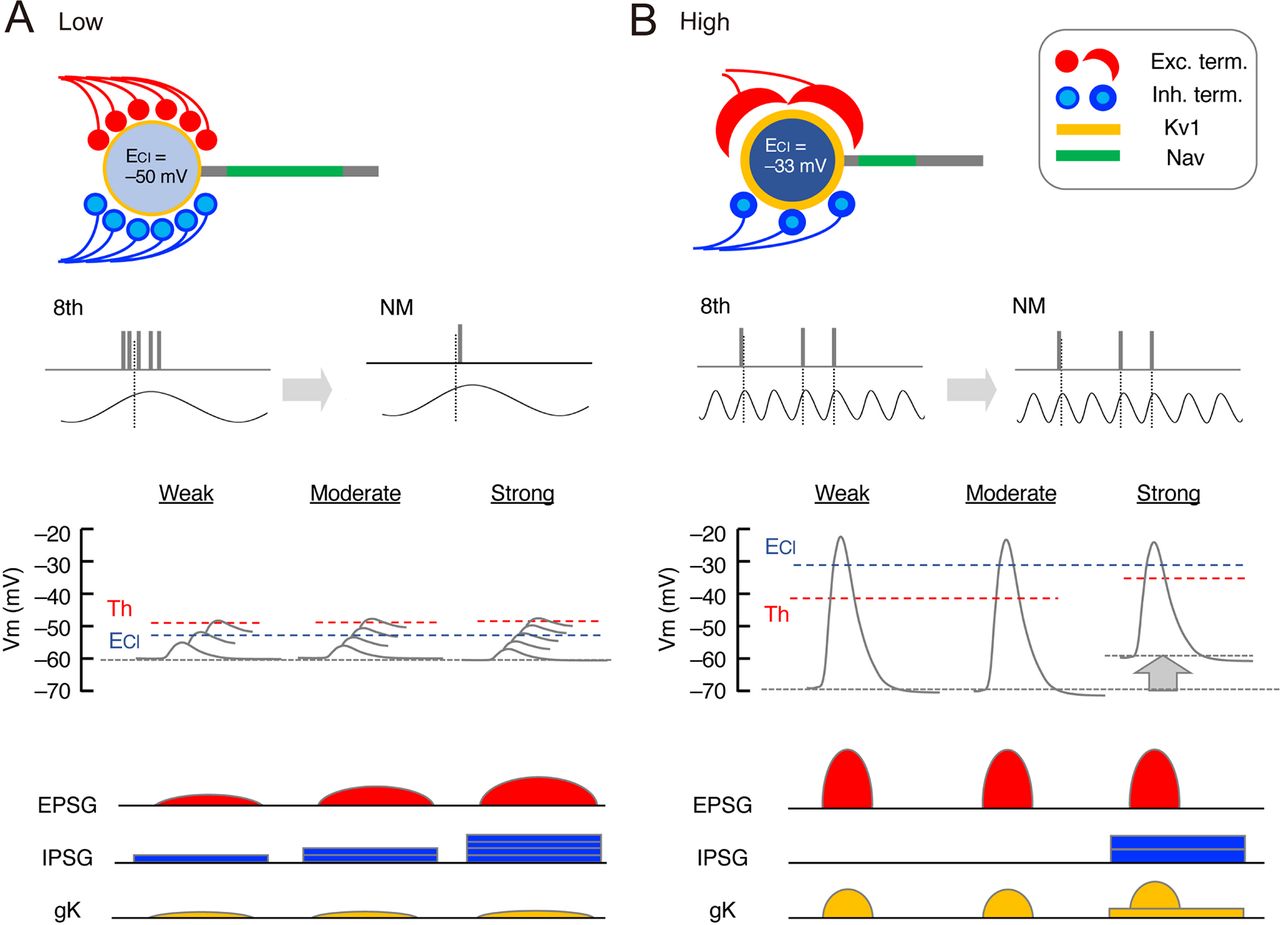
Implication of GABAergic differentiations in temporal coding of NM. Schematic drawing of synaptic and postsynaptic differentiations at each tonotopic region in NM. A, Low-CF neurons receive excitatory (red) and inhibitory (blue) inputs from a large number of bouton terminals, while the neurons possess small Kv1 conductance (yellow), large Nav conductance (green), and ECl close to the resting potential (top). Converging excitatory inputs reduce the jitter of output compared with that of inputs (top middle), while linearly coupled inhibitory inputs prevent saturation of output for wide intensity ranges (bottom middle). Small unitary inhibitory conductance (thin blue circles) and less depolarized ECl would be preferable in setting the appropriate level of inhibition with the small Kv1 conductance (bottom). B, High-CF neurons receive excitatory inputs from one or a few end-bulb terminals and inhibitory inputs from a relatively smaller number of bouton terminals, while the neurons possess larger Kv1 conductance, smaller Nav conductance, and ECl far above the resting potential (top). An extraordinary large excitatory input ensures high-fidelity transmission (top middle), while the inhibitory inputs with positive reversal potential and relatively large unitary conductance (thick blue circles) are recruited at strong intensities (bottom middle), which would strongly activate Kv1 conductance via membrane depolarization and suppress aberrant spike generation (bottom), as in vivo (Fukui et al., 2010). Thus, the number and size of inhibitory inputs are strategically determined according to the pattern of excitatory inputs. Moreover, ECl differs depending on Kv1 conductance, optimizing the strength of inhibition and the output of the neurons at each tonotopic region.
On the other hand, low-CF neurons receive multiple bouton synapses and converge small EPSCs in generating a spike, which compensates for the large jitter of auditory nerve activity and ensures the small jitter in the postsynaptic neurons (Fig. 7A). Importantly, these neurons show small Kv1 current and large axonal Nav current. These postsynaptic features allow the neurons to overcome the reduction of excitability that occurs via progressions of Kv1 current activation and Nav current inactivation during the slow rise time of converging potentials (Kuba and Ohmori, 2009). Additionally, the neurons recruit IPSCs linearly with EPSCs, and create balanced excitatory-inhibitory inputs during the auditory nerve activity, expanding the dynamic range of spike output (Al-Yaari et al., 2020). This balanced inhibition is shaped by the innervation of multiple SON fibers with a small unitary conductance and also by the less-depolarizing ECl. In particular, the less-depolarizing ECl is critical in making the effects of GABAergic inputs inhibitory in the low-CF neurons despite the small Kv1 current. Indeed, depolarizing GABA is known to have excitatory effects in high-CF neurons around E14 (Howard et al., 2007), well before the appearance of Kv1 current (Akter et al., 2018). Thus, ECl would be determined in a manner dependent on the level of Kv1 expression, optimizing the effects of inhibition at each tonotopic region in NM.
Comparison to mammals
Excitatory synapses differ in the number and size tonotopically in mammalian AVCN, being larger in number and smaller in size at lower-CF regions (Joris et al., 1994). In addition, the number of inhibitory synapses also increases toward the lower-CF region in AVCN (Moore and Moore, 1987; Kolston et al., 1992), suggesting that the coupling between excitatory and inhibitory inputs is a common feature to both mammals and birds. Notably, inhibitory inputs are hyperpolarizing in brainstem auditory nuclei in mammals after maturation (Balakrishnan et al., 2003), whereas they are mostly depolarizing in brainstem auditory nuclei in birds (Kuo et al., 2009), suggesting that a species-dependent difference exists in the polarity of inhibition.
How are these presynaptic and postsynaptic differentiations coordinated? The differentiations of Kv1 and Nav expressions in NM neurons progress during maturation, and they are driven by both activity-dependent [Ca2+]i elevation and intrinsic properties of the neurons (Akter et al., 2018, 2020; Adachi et al., 2019). Given the close correlation between ECl and Kv1 expression, we are tempted to speculate that ECl is determined by regulations of Cl– transporters via the similar Ca2+-dependent mechanisms. The elimination and maturation of excitatory synapses occur at high-CF region of NM after hearing onset (Lu and Trussell, 2007), while these processes are reported to depend on the expression of Hox2 genes in the postsynaptic neurons in AVCN (Karmakar et al., 2017). These raise a possibility that postsynaptic neurons dictate the number and size of synapses at each tonotopic region via regulating Hox2 gene expression and/or [Ca2+]i, and this should be tested in future studies.
Footnotes
This work was supported by Ministry of Education, Culture, Sports, Science and Technology Grant-in-aid 18H02541 to H.K. and 16K07345 to R.Y.; Innovative Areas “Dynamic Regulation of Brain Function by Scrap & Build” Grant 19H04747 to H.K.; and the Takeda Science Foundation to H.K. M.A. was supported by Ministry of Education, Culture, Sports, Science and Technology scholarship. We thank Dr. Samuel M. Young, Jr. for editing the manuscript; and the Division for Medical Research Engineering, Nagoya University Graduate School of Medicine, for usage of Agilent 2100 Bioanalyzer.
The authors declare no competing financial interests.
- Correspondence should be addressed to Hiroshi Kuba at kuba{at}med.nagoya-u.ac.jp


