

Article Figures & Data
Figures
- Figure 1.
Analysis schematic showing encoding model framework for predicting EEG responses to a given speech feature. We fit encoding models to neural data collected from participants as they listened to sentences from the TIMIT corpus and as they watched movie trailers, which contained speech in the presence of background noise. Speech features included the acoustic envelope, phonological features, pitch, and a combined or full model consisting of all the aforementioned features. Forward modeling was used to compute the temporal receptive field (TRF), which was then used to predict the neural response to a specific speech feature (pitch, acoustic envelope, phonological feature) or a combination of features from a given EEG channel in both conditions from the EEG task (TIMIT and movie trailers). See Crosse et al., 2016 for a similar modeling paradigm.
- Figure 2.
Speech feature correlation analysis for TIMIT and movie trailers. A, Stimulus correlations within TIMIT show the co-occurrence of features within the TIMIT stimuli. For example, sonorant phonemes are likely to be voiced and syllabic. The co-occurrence of specific phonological features with spectral and pitch features was low, since sentences were spoken by a variety of speakers. B, Stimulus correlations within the movie trailers. Co-occurrence of phonological features was highly similar to TIMIT. The spectrogram features were more correlated with one another, likely because of the presence of background noise, music, and other sounds in tandem with speech. C, The difference in stimulus correlation values between TIMIT and movie trailers. Overall, phonological feature correlations were very similar, but differences were observed in the co-occurrence of low- and high-spectrotemporal information, with TIMIT showing separate epochs with low- or high-frequency content (but not both), and movie trailers showing epochs with frequencies across the spectrum. D, Average stimulus correlations for acoustic and linguistic features in TIMIT and movie trailers. Acoustic features were generally more correlated than the phonological features, but the degree of correlation across stimulus sets was relatively similar.
- Figure 3.
Contributions of phonological and acoustic representations in predicting EEG. Comparing individual speech features (pitch, acoustic envelope, phonological features) with the full model (combination of all auditory features). A, Prediction performance (noise ceiling-corrected correlation between predicted and actual EEG data) of significant electrodes for each condition in models fit using TIMIT responses. Each individual dot is a single electrode. The shaded regions indicate the convex hull around the scatter points for each comparison, to indicate how the points are distributed along, above, or below the unity line. B, Same as A, for movie trailers. C, Variance partition analysis shows the unique variance explained by individual features (phonological features, pitch, and envelope) for each participant separately (bar chart) and across all participants (pie chart) when fit on TIMIT data. D, Same as C, for movie trailers condition.
- Figure 4.
Model performance when incorporating spectrogram features in addition to phonological features and pitch. A, Prediction performance (correlation between predicted and actual EEG data) of significant electrodes for each condition in models fit using TIMIT. Each individual dot is a single electrode. Electrode color indicates the individual model type. The shaded regions indicate the convex hull around the scatter points for each comparison, to indicate how the points are distributed along, above, or below the unity line. The average correlation value for each individual performance for TIMIT is as follows: phonological features, r = 0.33; spectrogram, r = 0.09; and pitch, r = 0.29. B, Same as A, for movie trailers. The average correlation value for each individual performance for movie trailers is as follows: phonological features, r = 0.07; spectrogram, r = 0.02; and pitch, r = 0.05. C, Variance partition analysis shows the average unique variance explained by individual features (phonological features, pitch, and spectrogram) for each participant separately (bar chart) and across all participants (pie chart) when fit on TIMIT data. D, Same as C, for movie trailers condition.
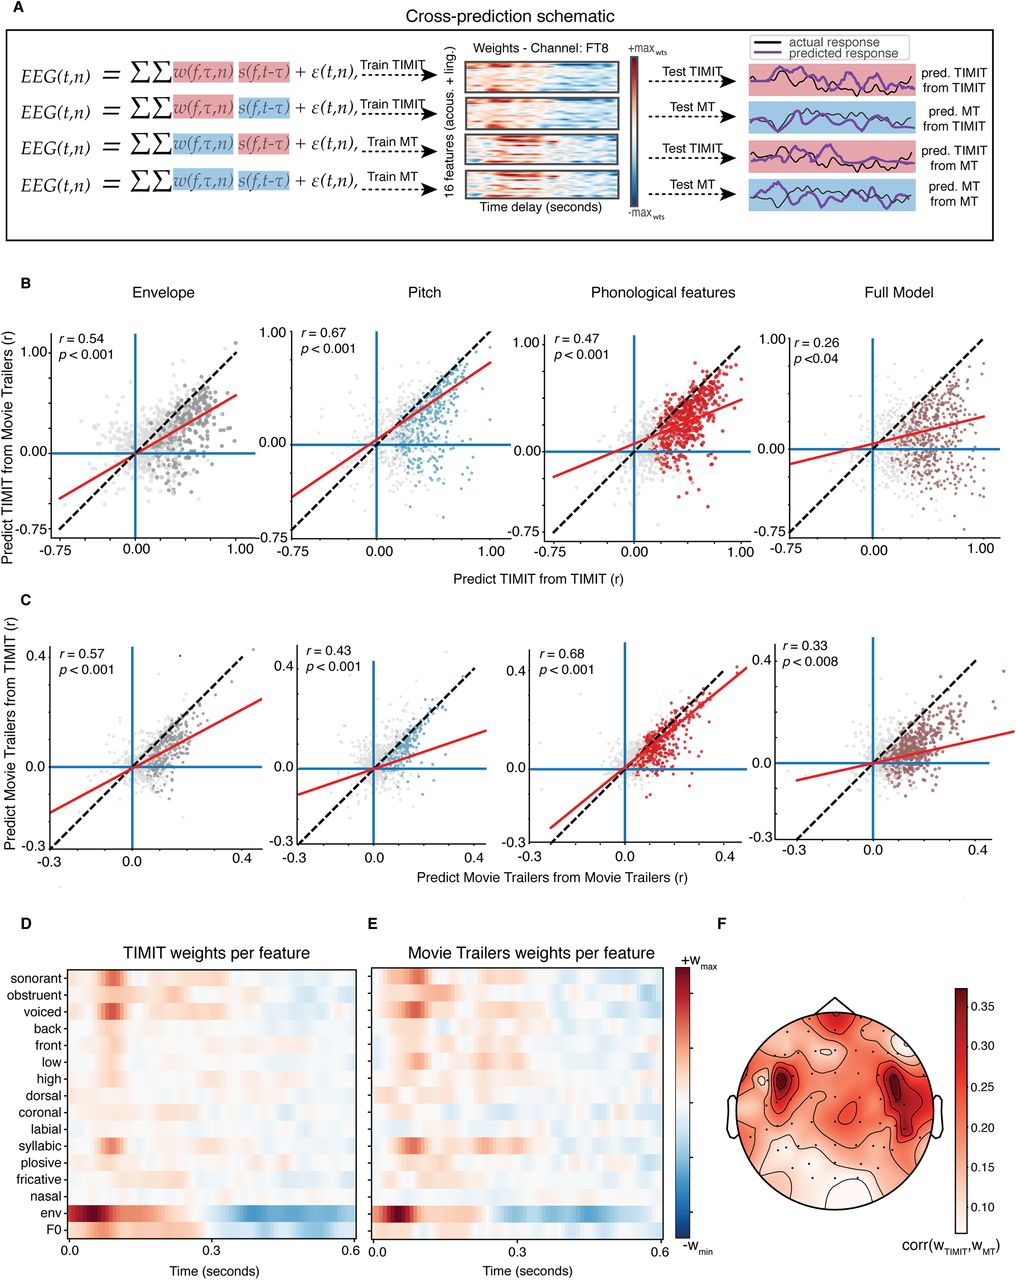
- Figure 5.
Cross-prediction analysis shows that models fit to TIMIT and movie trailer stimuli are generalizable to the other stimulus set. A, The cross-prediction analysis schematic is shown for the following conditions: training on TIMIT and testing on TIMIT, training on TIMIT and testing on MT, training on MT and testing on MT, and training on MT and testing on TIMIT. In each of these training and testing conditions, the weights for the training condition were used for a given stimulus set and the stimulus feature for either the same or a different stimulus was used for testing. B, Model performance for TIMIT test sets with TIMIT training data (x-axis) or movie trailer training data (y-axis). Each dot in the individual convex hull plots represents an individual electrode, where clusters of dots of the same color represent electrodes for a corresponding feature across participants. Dots in gray show nonsignificant models (p > 0.05, bootstrap test). Dashed black line, Unity line; red line, regression line. C, Same as B, but with model performance on movie trailer test set for movie trailer training (x-axis) or TIMIT training data (y-axis). D, Weight matrix for the TIMIT full model in one example channel 27 (FC6) from one participant (MT0008). E, Same as D for movie trailers. Note that the weights are highly similar to those in D despite training the model on separate stimuli. F, Average correlation between TIMIT and movie trailer weights for all participants. Across all participants, correlations among the receptive field weights were highest in central/temporal electrodes.
- Figure 6.
Effects of the number of repetitions and auditory environment on prediction performance. A, The average correlation value between the predicted and actual EEG data in response to TIMIT increases as repetitions are added to the test set. B, Same as A for movie trailers. C, Convex hull showing correlation values in one subject from two separate recording sessions, where the x-axis consists of 10 repetitions of the test set stimuli, whereas the correlations shown on the y-axis were evaluated using two repetitions of the test set. Each brown dot represents a single electrode. Averages are across different partitions of the test set using a bootstrap procedure without replacement. D, Average correlation performance for one test set trailer (Inside Out) in which the stimulus was segmented as speech only, speech with background noise, and background noise alone. Models were fit on individual speech features (phonological features, acoustic envelope, pitch) or a combination of all three (full model). Performance was highest during speech-only epochs.
- Figure 7.
Unique contribution of visual features for the noisy (movie trailer condition) to assess model performance. A, Visual stimuli in the movie trailers were decomposed into a set of Gabor wavelet features using a motion energy model. These features are static or drifting gratings at different spatial and temporal frequencies. Ten example spatiotemporal Gabors are shown, where each row represents one spatiotemporal feature set, and each column represents the evolution of that feature over time. In our experiment, we used a total of 2139 features, so these represent only a small fraction of the total set. B, The 2139 Gabor features are decomposed into their first 10 principal components using PCA on the entire Gabor feature matrix (2139 features over time). For illustration purposes, only 15 s of data are shown. This reduced dimensionality matrix then serves as the visual input to our mTRF models. C, Example combined visual and acoustic/linguistic features for 15 s of our test stimulus Inside Out. The acoustic features are identical to those used in the previous model fits, while the visual features include the Gabors shown in A–C. Example frames are shown for four time points in the stimulus. D, Model performance for the audiovisual combined model versus visual-only or audio-only models. Each dot represents an individual EEG channel. The topographic map shows the difference between the audiovisual correlations and visual-only correlations, averaged across all participants. Red indicates increased variance explained when adding auditory information. E, Unique variance explained by visual, auditory, or combined audiovisual information. The visual features contribute a large amount of variance of the EEG responses to movie trailers. Such results are further corroborated by the pie chart, demonstrating unique variance among the visual-only, audio-only, and shared audiovisual features. F, A comparison of the cross-prediction analysis where both an audio-only model or an audiovisual model was used to derive feature weights for movie trailers. The auditory weights for each analysis were then used to predict TIMIT responses. Overall, these models are highly correlated, showing that partialing out the visual information does not strongly affect cross-prediction performance. Each dot represents an individual EEG channel.
- Figure 8.
Weights from the full auditory encoding model are similar to the auditory information in the audiovisual model. A, Weights from the audiovisual model that included all 16 auditory features along with 10 Gabor wavelet features and one visual feature for scene cuts. B, Heat map of weights from the full auditory model without visual information (16 features). C, Topographic map of the correlation between auditory feature weights from the audiovisual model and audio-only model averaged across participants. Model weights were highly correlated, especially over temporal and central electrodes.


