

Article Figures & Data
Figures
- Figure 1.
BAX knock-out mice (BAX−/−) showed increased retinal and RGC axon bundle thickness. A, Example fibergrams (left panels) and circumpapillary B-scans (right panels) of littermate controls (BAX+/+ and BAX+/−, labeled as CTRL; top panel) and BAX−/− (bottom panel). The blue arrow highlights the left-most A-line of circumpapillary B-scans, and the red arrows indicate the direction and location of reconstructed circumpapillary B-scans. B, Magnified view of the boxed regions indicated in panel A. INL: inner nuclear layer; OPL: outer plexiform layer; ONL: outer nuclear layer; ELM: external limiting membrane; and RPE: retinal pigment epithelium. The green arrows exemplify retinal thickness measurements, the blue arrows exemplify the GCIPL measurements, and the orange arrows exemplify RGC axon bundle measurements. C, Distribution of retinal thickness measurements for CTRL (black) and BAX−/− (red) mice. D, GCIPL thickness measurements for CTRL (black) and BAX−/− (red) mice. E, RGC axon bundle thickness measurements for CTRL (black) and BAX−/− (red) mice (****p < 0.0001); σ values represent SD. Extended Data Figures 1-1, 1-2 are for Figure 1.
- Figure 2.
Vis-OCTF revealed BAX−/− mice had increased RGC axon bundle width and density. A, Comparing mouse RGC axon bundle organization between CTRL (top panels) and BAX−/− (bottom panels) retinas using in vivo vis-OCTF (left panels) and ex vivo confocal microscopy imaging of flat-mounted retinas immunostained for RGC axons (right panels). B, Magnified view of highlighted areas in panel A (red boxes). The orange arrows indicate RGC axon bundles, and the red arrows indicate blood vessels. The widths of individual axon bundles were measured (also see Extended Data Fig. 2-1 and Results). C, An example plot of the semi-log Sholl regression analysis using the fibergram image of a control retina shown in the inset. D, Measured k values for CTRL (black triangles) and BAX−/− (red triangles) mice. E, The average number of RGC axon bundles (intersects) recorded as a function of distance from the ONH (radius) for CTRL (black) and BAX−/− (red) mice. F, Average k value for CTRL (black) and BAX−/− (red) mice represented as slope of semi-log Sholl regression plot. G, Distribution of RGC axon bundle width measurements for CTRL (black) and BAX−/− (red) mice; σ values indicate SD. H, Average RGC axon bundle width for CTRL (black) and BAX−/− (red) mice (****p < 1e-4); σ values represent SD. Yellow scale bars: 250 μm; blue scale bars: 100 μm; S: superior; N: nasal; T: temporal; I: inferior. Extended Data Figure 2-1 is for Figure 2.
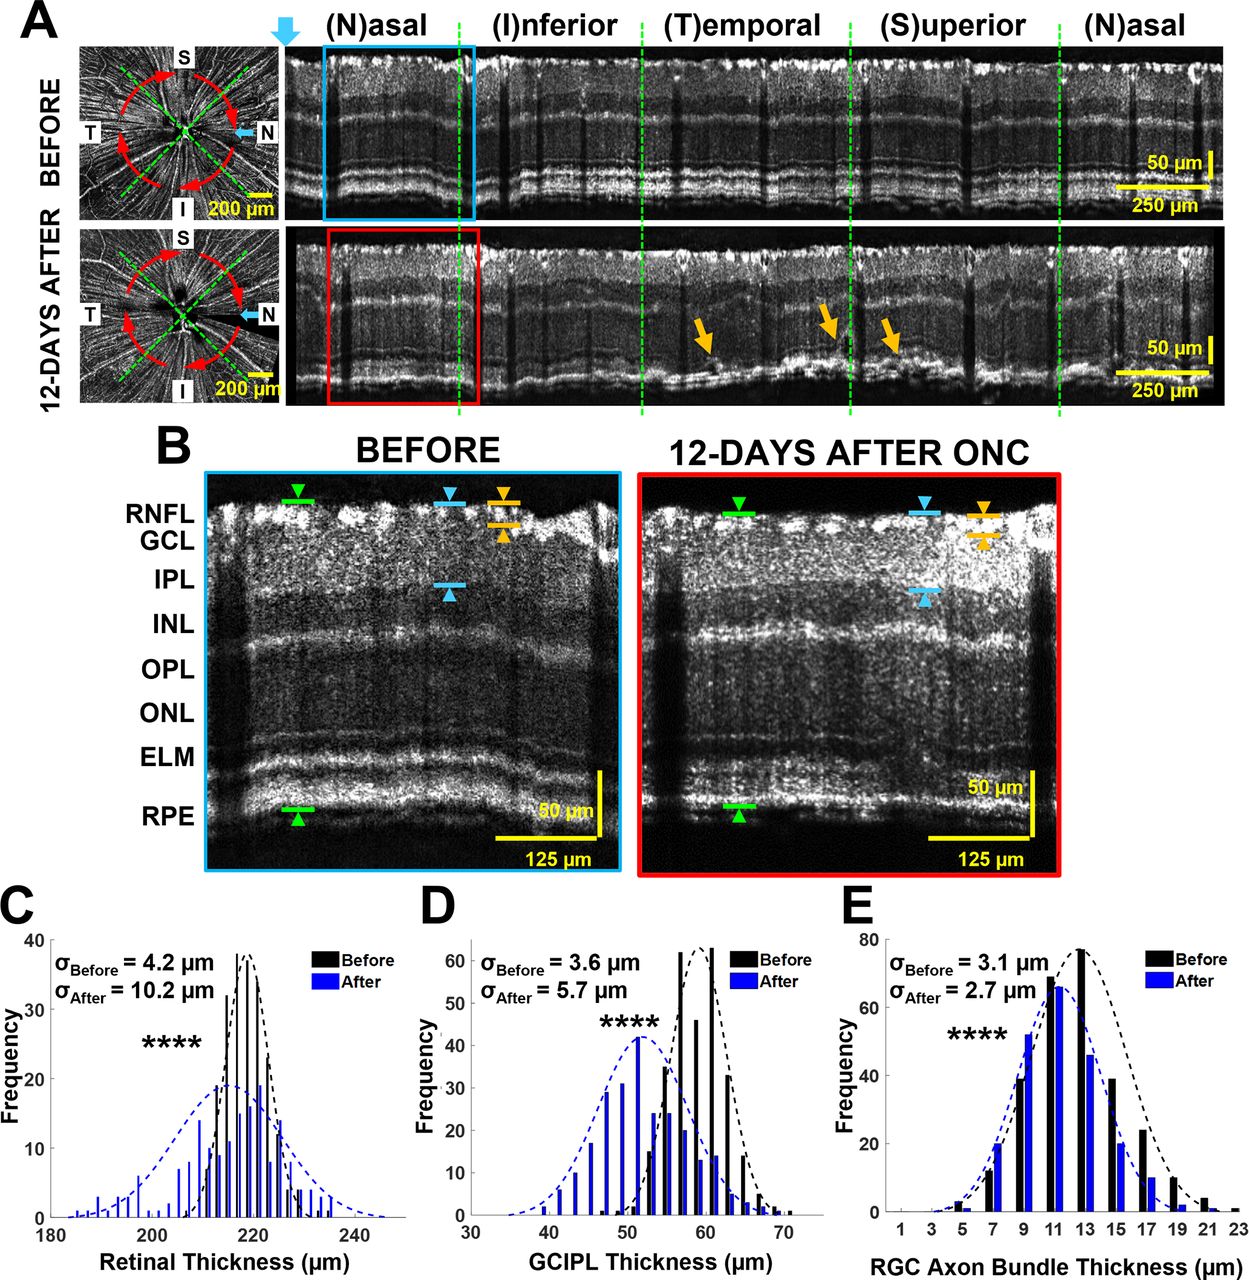
- Figure 3.
At 12 d after ONC injury, mice exhibited reduced retinal and RGC axon bundle thickness. A, Fibergrams and circumpapillary B-scans before (top panels) and 12 d after ONC (bottom panels). The blue arrow indicates the left-most A-line in circumpapillary B-scans, and the red arrows indicate the direction and location of reconstructed circumpapillary B-scans. The orange arrows in the bottom panel indicate localized edema. B, Magnified view of boxed regions indicated in panel A. The green arrows exemplify retinal thickness measurement, the blue arrows exemplify the GCIPL measurements, and the orange arrows exemplify RGC axon bundle thickness measurement. C, Distribution of retinal thickness measurements in retinas before (black) and 12 d after crush (blue). D, GCIPL measurements in retinas before (black) and 12 d after crush (blue). E, RGC axon bundle thickness measurements in retinas before (black) and 12 d after crush (blue; ****p < 0.0001); σ values represent the SD of distributions.
- Figure 4.
In vivo tracking of RGC axon bundle organization by vis-OCTF revealed a reduction in both axon bundle width and density at 12 d after ONC. A, Comparing RGC axon bundle organization before (left panels) and after crush (middle and right panels) in vivo with vis-OCTF (left and middle panels) and ex vivo with confocal microscopy images of flat mounted retinas stained for RGC axons (right panels). Bottom panels show the magnified views of highlighted regions in top panels (red boxes). The orange arrows in the bottom panels indicate axon bundles, and the red arrows indicate blood vessels. Yellow scale bars: 250 µm; blue scale bars: 100 µm. B, Tracking the k values for individual retinas before (black) and after crush (blue). C, The average number of RGC axon bundles (intersects) recorded as a function of distance from the ONH (radius) for mice before and after ONC. D, Average k value for mice before and after ONC represented as slope of semi-log Sholl regression plot. E, Distribution of RGC axon bundle width measurements for mice before and after ONC; σ values indicate SD. The black arrow points to that large bundles disappeared after ONC. F, Average RGC axon bundle width for mice before and after ONC (****p < 1e-4).
- Figure 5.
Regional thickness measurements showed changes in RGC axon bundle thickness at 5 d after ONC. A, Schematic representation of eight retinal regions from which RGC axon bundle thickness was measured. Measurements were recorded in each retinal quadrant near the center (C, 250 μm from the ONH) and in the periphery (P, 500 μm from the ONH). B, Example circumpapillary B-scan sections taken near the center (top panels) and periphery (bottom panels) before (left panels) and 5 d after (right panels) ONC. The green arrows exemplify retinal thickness measurements, the blue arrows exemplify the GCIPL measurements, and the orange arrows exemplify RGC axon bundle thickness measurements. C, D, Distribution of retinal thickness measurements from the central (C) and the peripheral regions (D). E, F, GCIPL thickness measurements from the central (E) and the peripheral regions (F). G, H, RGC axon bundle thickness measurements from the central (G) and the peripheral regions (H; NS: not significant, p > 0.05; **p <0.01, ***p <0.001, ****p <0.0001); σ values in all distribution plots denote SD.
- Figure 6.
Heatmaps revealed location-dependent changes in RGC axon bundle thickness. Heatmaps from two example mice (A, mouse #1; and B, mouse #2) show the mean thickness of RGC axon bundles before crush (left), after crush (middle), and change in thickness (right; *p < 0.05, **p < 0.01).
- Figure 7.
At 5 d after ONC, RGC axon bundle width reduced, but no change in bundle density. A, vis-OCT fibergrams before (left) and 5 d after (right) ONC. The orange arrows indicate RGC axon bundles, and the red arrows indicate blood vessels. B, The k values for mice before (black) and after ONC (blue). The black dashed lines track measurements for individual retinas before and after ONC. C, D, RGC axon bundle width distributions measured from the central (C) and the peripheral retina (D; NS: no significance; ****p < 1e-4); σ values indicate SDs.
- Figure 8.
Model for simulating the relationship between the k value and the axon bundle width and number. A, Simulated RGC axon bundle distributions. Simulated distributions include (from left to right): control (CTRL), low bundle density, high bundle density, thinner bundles, and thicker bundles. B, Average semi-log k value for each simulated condition shown in panel A. C, Average number of simulated intersects for simulated conditions shown in panel A. D, Comparison between simulated k values (open shapes) and measured k values (filled shapes) for control (black), BAX−/− (red), and ONC (blue) mice. Simulations were performed based on the measured width of RGC axon bundles for each condition (NS: no significance).


Extended Data
Extended Data Figure 1-1
Resampled circumpapillary scans improved the quality of retinal B-scan images compared to traditional continuous acquisition circumpapillary scans. A, Fibergram showing paths of circumpapillary scan acquired via continuous circular scan around ONH (blue) and circumpapillary scan generated from four rectangular OCT volumes (red). B, Circumpapillary B-scans resampled from four rectangular OCT volumes (top panel) and traditional circumpapillary B-scan (bottom panel). C, RGC axon bundle thickness distribution measured from resampled (red) and traditional continuous acquisition (blue) circumpapillary B-scans; σ values indicate SDs. This is related to Figure 1. Download Figure 1-1, file.
Extended Data Figure 1-2
Visual acuity and IOP measurement in BAX mutant mice. A, BAX mutant mice exhibited low or no optomotor response compared to littermate controls. B, The IOP values of BAX mutant mice were comparable to littermate controls (NS: no significance; ****p< 0.0001 as determined using one-way ANOVA followed by Tukey's method for multiple comparisons). This is related to Figure 1. Download Figure 1-2, file.
Extended Data Figure 2-1
RGC axon bundle width measurement procedure. A, A fibergram showing 400-μm radius analysis ring. Red dots indicate individual fibers from which thickness was measured. B, Magnified view of RGC axon bundle in panel A (green box). The red box shows the area to measure individual axon bundle width. The red lines highlight the locations to extract axon bundle intensity profiles. C, Average intensity profile of RGC axon bundle shown in panel B. The width of the axon bundle is measured at 1/e2 decay, as indicated by the red arrow. This is related to Figure 2. Download Figure 2-1, file.


