

Article Figures & Data
Figures
- Figure 1.
Cross-modal suppression of the PIVC during visual attentional tracking. a, Example trial of the visual attentional tracking task. A subset of white disks was briefly highlighted in green to denote them as targets during an initial cueing phase (duration, 2 s). Either one, two, three, or, as shown here, four of eight disks could be designated as targets. Tracking one and two targets served as the low-visual attentional load condition, whereas tracking three and four targets served as the high-visual attentional load condition. During tracking, all disks were white and physically indistinguishable from each other. Each disk moved in a different direction. Disks never collided or overlapped. Subjects maintained central fixation and followed the targets with their attention (tracking duration, 14 s). Red arrows show the motion directions of different disks and were not included in the real experiment. During the response phase (duration, 2 s), one disk was highlighted in green and subjects were requested to indicate whether this disk was a target or a distractor by pressing one of two buttons on a button box. b, Brain activation as measured by fMRI in the right hemisphere during visual attentional tracking in a weighted random-effects group analysis (n = 20). Cold colors (dark to bright blue) denote significantly lower BOLD signal in PIVC during high loads of visual attention on the tracking task (corresponding to the mean BOLD signal across tracking three and four disks) compared with low loads (corresponding to the mean BOLD signal across tracking one and two disks). Warm colors (red to yellow) denote the reverse contrast. Data are thresholded at p < 0.05, false discovery rate (FDR) corrected, and overlaid on a template brain. c, Mean BOLD percentage signal change (±SE) in right PIVC in the same set of subjects for each tracking condition. PIVC was independently defined by using average anatomic coordinates (taken from Frank et al., 2016b). Zero on the y-axis corresponds to BOLD activation during central fixation on an otherwise blank screen.
- Figure 2.
fMRS spectra in right PIVC during visual attentional tracking. a, Spectra during the low-visual attentional load condition taken from the PRESS scan. The Glx peak is seen at 2.1–2.5 ppm. Each row shows the result from a different subject (S1–S20). b, Same as a but for the high-visual attentional load condition. c, Spectra during the low-visual attentional load condition taken from the MEGA-PRESS difference scan. The GABA peak is seen at 3 ppm. d, Same as c but for the high-visual attentional load condition.
- Figure 3.
Results of the fMRS experiment. a, Group analysis of fMRI activation during CVS. Shown are significantly stronger activations during CVS than baseline (p < 0.05 FDR corrected, color coded in red to yellow) in a weighted random-effects group analysis for a total of 20 subjects overlaid on a template brain (right hemisphere). Activation at the junction of the parietal operculum and the posterior insula during CVS corresponds to PIVC. The white cross symbol shows the location of PIVC from a previous study (Frank et al., 2016b). b, Individual center of location of PIVC in the right hemisphere as defined by means of CVS for each subject in the fMRS experiment. Each dot shows the center of PIVC in a different subject. The results are overlaid on an inflated template brain with the recent cortical segmentation proposed by Glasser et al. (2016). The location of the enlarged section in the inflated brain is shown on the right. Across subjects, PIVC was centered at the junction of the parietal operculum and the posterior insula. 43, Area 43; FOP2, frontal opercular area 2; IG, insular granular complex; OP2-3, area OP2–3; OP4, area OP4; POL1, posterior insular area 1; POL2, posterior insular area 2. c, Location of the fMRS voxel (corresponding to the black square frame in the panel) centered on right PIVC as defined by significantly stronger BOLD activation during CVS than baseline (shown by red-yellow colors similar to those in a) in a sample subject. d, Mean concentrations (±SE) of Glx in right PIVC during low and high loads of visual attentional tracking (corresponding to tracking two and four disks, respectively) for 20 subjects. The concentrations of Glx were measured by a PRESS scan and are relative to tCr, a control metabolite taken from the same scan. e, Same as d but for GABA. The concentrations of GABA were measured by a MEGA-PRESS scan and are relative to NAA, a control metabolite taken from the same scan. **p < 0.01.
- Figure 4.
BOLD signal changes in PIVC during CVS combined with visual attentional tracking. a, Control condition. Mean (±SE) BOLD percentage signal change in right PIVC, while subjects (n = 17 from the fMRS experiment) received excitatory vestibular cues by means of CVS and kept their eyes closed. Zero on the y-axis corresponds to baseline with eyes closed and warm thermal stimulation in both ears. b, Experimental conditions. Subjects received CVS and performed a visual tracking task with different attentional loads while maintaining central fixation. Low load corresponds to the track-two condition. High load corresponds to the track-four condition. Zero on the y-axis corresponds to baseline with central fixation and warm thermal stimulation in both ears. Results are shown for a total of 18 subjects. Otherwise, same as a. c, Correlation between Glx and BOLD signal changes across subjects (n = 18). The Glx scores represent differences in the concentration of Glx in PIVC between high and low visual attentional loads from the fMRS experiment (high load minus low load; Fig. 3d). The BOLD scores represent differences in BOLD signal in PIVC between high and low visual attentional loads combined with CVS (high load minus low load, see b). Each dot shows the result from a different subject. Subjects with a greater decrease in Glx from low to high load (corresponding to lower values on the x-axis) tended to show a larger increase in negative BOLD signal from low to high load (corresponding to lower values on the y-axis). d, Correlation between GABA and BOLD across subjects (n = 18). Otherwise, same as c. *p < 0.05, **p < 0.01.
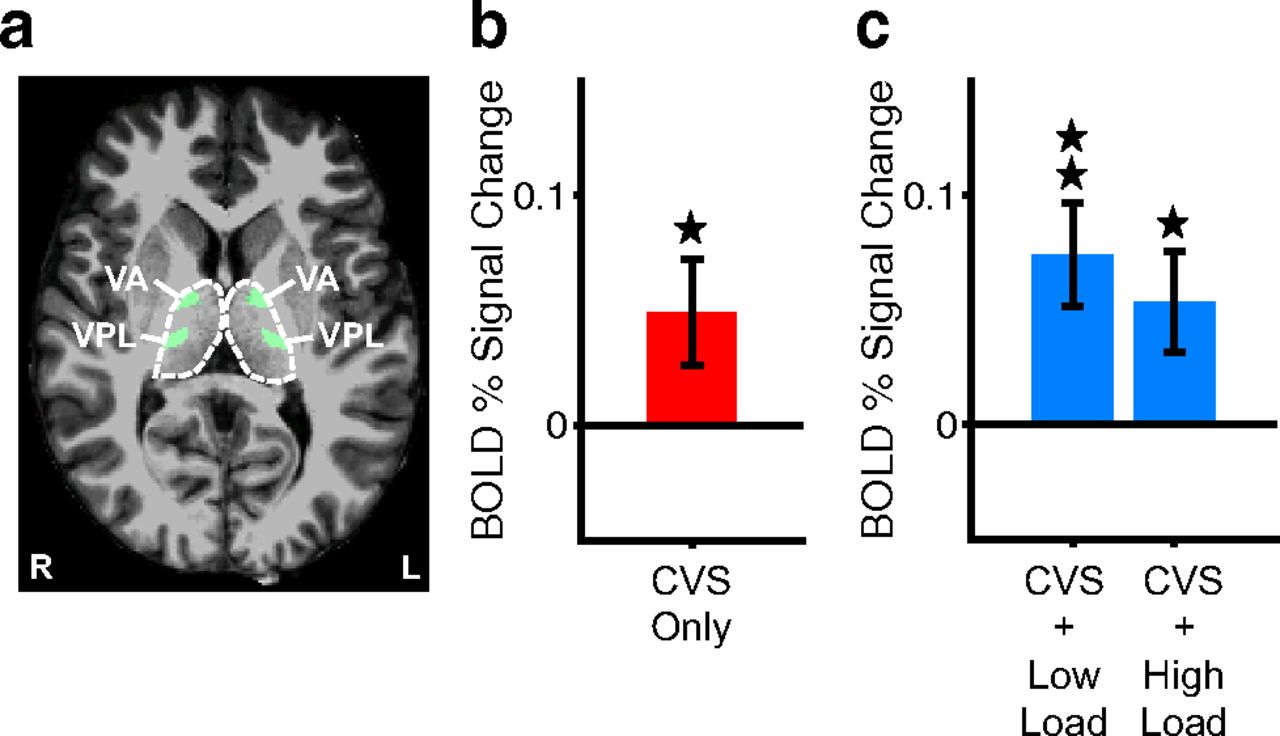
- Figure 5.
BOLD signal changes in vestibular thalamic nuclei during CVS-only or CVS combined with visual attentional tracking. a, Location of the vestibular thalamic ROI consisting of the ventral anterior (VA) and ventral posterior lateral (VPL) thalamic nuclei, defined by using an anatomic atlas (Krauth et al., 2010), overlaid on the high-resolution anatomic brain of a sample subject (L, left side; R, right side). Previous results (Wirth et al., 2018) showed that these vestibular nuclei of the thalamus have the strongest structural connectivity with PIVC in human subjects. Dashed lines show the outlines of the left and right thalamus as delineated by the anatomic segmentation of Freesurfer. b, Mean (±SE) BOLD percentage signal change in the vestibular thalamic ROI during CVS only. Otherwise, same as Figure 4a. c, Same as b but for BOLD percentage signal changes during CVS combined with low and high attentional loads on the visual tracking task. Otherwise, same as Figure 4b. *p < 0.05, **p < 0.01.


