

Abstract
Multifaceted microglial functions in the developing brain, such as promoting the differentiation of neural progenitors and contributing to the positioning and survival of neurons, have been progressively revealed. Although previous studies have noted the relationship between vascular endothelial cells and microglia in the developing brain, little attention has been given to the importance of pericytes, the mural cells surrounding endothelial cells. In this study, we attempted to dissect the role of pericytes in microglial distribution and function in developing mouse brains. Our immunohistochemical analysis showed that approximately half of the microglia attached to capillaries in the cerebral walls. Notably, a magnified observation of the position of microglia, vascular endothelial cells and pericytes demonstrated that microglia were preferentially associated with pericytes that covered 79.8% of the total capillary surface area. Through in vivo pericyte depletion induced by the intraventricular administration of a neutralizing antibody against platelet-derived growth factor receptor (PDGFR)β (clone APB5), we found that microglial density was markedly decreased compared with that in control antibody-treated brains because of their low proliferative capacity. Moreover, in vitro coculture of isolated CD11b+ microglia and NG2+PDGFRα– cells, which are mostly composed of pericytes, from parenchymal cells indicated that pericytes promote microglial proliferation via the production of soluble factors. Furthermore, pericyte depletion by APB5 treatment resulted in a failure of microglia to promote the differentiation of neural stem cells into intermediate progenitors. Taken together, our findings suggest that pericytes facilitate microglial homeostasis in the developing brains, thereby indirectly supporting microglial effects on neural progenitors.
SIGNIFICANCE STATEMENT This study highlights the novel effect of pericytes on microglia in the developing mouse brain. Through multiple analyses using an in vivo pericyte depletion mouse model and an in vitro coculture study of isolated pericytes and microglia from parenchymal cells, we demonstrated that pericytes contribute to microglial proliferation and support microglia in efficiently promoting the differentiation of neural stem cells into intermediate progenitors. Our present data provide evidence that pericytes function not only in the maintenance of cerebral microcirculation and blood brain barrier (BBB) integrity but also in microglial homeostasis in the developing cerebral walls. These findings will expand our knowledge and help elucidate the mechanism of brain development both in healthy and disease conditions.
Introduction
Microglia, the resident immune cells in the central nervous system (CNS), are seeded in the developing mouse brain at embryonic day (E)9 (Ginhoux et al., 2010; Goldmann et al., 2016) and are distributed in the cerebral wall with a stage-dependent localization pattern (Swinnen et al., 2013). In mice, the intrapallial microglial distribution is initially homogenous until E14, but these cells are temporarily absent from the cortical plate (CP) from E15 to E16 and prefer to colonize the ventricular zone (VZ), subventricular zone (SVZ), and intermediate zone (IZ). We previously reported that this transient microglial disappearance from the mid-embryonic CP is a result of microglial bidirectional migration occurring at E14 (Hattori et al., 2020).
Multiple functions of microglia in the embryonic stage have been progressively revealed in recent decades (Thion and Garel, 2017; Hattori, 2021). In the VZ/SVZ, microglia phagocytically regulate the number of intermediate progenitors (Cunningham et al., 2013; Barger et al., 2019). A previous study showed that microglia induce neural stem cells to differentiate into intermediate progenitors (Arnò et al., 2014), and this function is efficiently mediated by their extensive migratory activity (Hattori and Miyata, 2018). In addition, microglia have been demonstrated to regulate the entrance of interneurons generated in the subpallium into the CP and to orchestrate the proper intra-CP positioning of these neurons (Squarzoni et al., 2014). On the other hand, the temporal absence of microglia from the mid-embryonic CP is crucial for proper neuronal differentiation and maturation (Hattori et al., 2020). Although microglia account for only a minor population of the cells constituting the parenchyma, they provide diverse functions that are required in specific regions with optimal positioning through their extensive migratory activity.
Previous works revealed that vasculogenesis first occurs in the yolk sac at E7.5 (Gama Sosa et al., 2021). Although the detailed mechanism underlying vascular development in the brain remains unclear, a previous study reported that clusters of vascular endothelial-like cells were dispersed throughout the brain parenchyma at E7.5–E8.5 (Walls et al., 2008). Subsequently, the extensive branching and arborization of the vascular structure proceed toward the late embryonic stage (Mancuso et al., 2008).
In the capillary walls, vascular endothelial cells are covered with pericytes (Zimmermann, 1923). Although pericytes were previously thought to have merely a structural role, recent studies have highlighted their multifaceted functions in the postnatal and adult brains. For example, these cells play critical roles in angiogenesis, vascular stability and blood brain barrier (BBB) maintenance for CNS homeostasis under physiological conditions (Bell et al., 2010; Daneman et al., 2010; Teichert et al., 2017; Brown et al., 2019) and contribute to neuroinflammation, injury, and repair in CNS disorders (Armulik et al., 2010; Cheng et al., 2018; Rafalski et al., 2018).
An increasing number of studies have shown the relationships between vascular endothelial cells and microglia in the CNS. In the pathologic context, microglia are rapidly attracted to the vasculature following breakdown of the BBB (Barkauskas et al., 2015; Dudvarski Stankovic et al., 2016). Microglia also respond to the inflammation and then disrupt the BBB integrity, thereby permeabilizing the BBB barrier (Dudvarski Stankovic et al., 2016; Zhao et al., 2018; Haruwaka et al., 2019). In the healthy brain, microglia regulate vascular formation and complexity in the developing brain and retina (Checchin et al., 2006; Fantin et al., 2010; Rymo et al., 2011; Dudiki et al., 2020). Furthermore, microglia use the blood vessels as scaffolds to migrate throughout the CNS structure (Grossmann et al., 2002; Checchin et al., 2006; Monier et al., 2007; Fantin et al., 2010; Mondo et al., 2020). However, the importance of the association of pericytes with microglia has received little attention to date. In this study, we attempted to elucidate the effect of pericytes on microglia through multiple analyses using an in vivo pericyte depletion model and in vitro coculture of isolated pericytes and microglia.
Materials and Methods
Mice and cell line
ICR mice were purchased from Japan SLC. CX3CR1-GFP mice (stock #005582, RRID: IMSR_JAX:005582) were purchased from The Jackson Laboratory (Jung et al., 2000). For CX3CR1-GFP+ embryos (heterozygous), male homozygous CX3CR1-GFP mice (8–24 weeks) were mated with female ICR mice (8–24 weeks). The day when the vaginal plug was detected was considered E0. Both male and female embryos (E12–E14) were used for analysis. All mice were maintained under specific pathogen-free conditions and were housed at 22–24°C temperature with 40–60% humidity at Nagoya University. A 12/12 h light/dark cycle was used. The animal experiments were conducted according to the Japanese Act on Welfare and Management of Animals, Guidelines for Proper Conduct of Animal Experiments (published by Science Council of Japan), and Fundamental Guidelines for Proper Conduct of Animal Experiment and Related Activities in Academic Research Institutions (published by Ministry of Education, Culture, Sports, Science and Technology, Japan). All protocols for animal experiments were approved by the Institutional Animal Care and Use Committee of Nagoya University (No. 29006).
Administration of APB5 and clodronate liposomes into the mouse ventricle
After pregnant ICR mice were anesthetized by intraperitoneal injection of pentobarbital sodium, somnopentyl (Kyoritsu Seiyaku), rat anti-mouse PDGFRβ mAb (clone APB5; Uemura et al., 2002) or rat IgG2a isotype control antibody (catalog #BE0089, BioXCell, RRID: AB_1107769) dissolved in saline was injected into the lateral ventricle of male and female mouse embryos at E13 (3.6 µg). After 24 h, the brains of embryos (E14) were perfused with 4% paraformaldehyde (PFA) and subjected to immunohistochemistry. When necessary, empty or clodronate liposomes (Macrokiller V300, catalog #MKV300, Cosmo Bio) were administered (3 µg) to the ventricle of embryos at E12 to remove microglia in the cerebral walls (Fig. 9D–H).
FACS analysis
Freshly isolated E14 pallial walls were treated with trypsin (0.05%, 3 min at 37°C). Dissociated pallial cells were filtered through a 40-μm strainer (Corning) to eliminate all remaining cell debris and then resuspended in DMEM/nutrient mixture F-12 (DMEM/F12; Invitrogen) containing 5% fetal bovine serum (FBS; Invitrogen), 5% horse serum (HS; Invitrogen), and penicillin/streptomycin (50 U ml−1, each; Meiji Seika Pharma Co, Ltd.). Single cells were stained with rat anti-PDGFRβ mAb (1:100, catalog #16-1402-82, Thermo Fisher Scientific, RRID: AB_469070), which was labeled by FITC using an Ab-10 Rapid Fluorescein Labeling kit (LK32, Dojindo), or rat FITC IgG2a isotype control Ab (1:200, catalog #400505, BioLegend, RRID: AB_2736919), rat anti-NG2 mAb (1:200, catalog #MAB6689, R&D Systems, RRID: AB_10890940), which was labeled by PE using an Ab-10 Rapid R-Phycoerythrin Labeling kit (LK34, Dojindo), or rat PE IgG1 isotype control Ab (1:200, catalog #400408, BioLegend, RRID: AB_326514), and rat BV421 anti-PDGFRα mAb (1:200, catalog #135923, BioLegend, RRID: AB_2814036) or rat BV421 IgG2a isotype control antibody (1:200, catalog #407117, BioLegend, RRID: AB_2687343) for 1 h on ice. Data collection was performed using FACSDiva software version 8.0 on FACS Canto II (BE Biosciences) and the data were analyzed using FlowJo software version 7.6. Approximately 20,000 cells, which were gated on a forward scatter (FSC)/side scatter (SSC) plot for debris exclusion, were analyzed for each sample (Fig. 6A).
Cell sorting
Dissociated E14 pallial walls were filtered through a 40-μm strainer (Corning) to eliminate all remaining cell debris and then resuspended in DMEM/F12 media (Invitrogen) containing 5% FBS (Invitrogen), 5% HS (Invitrogen) and penicillin/streptomycin (50 U ml−1, each; Meiji Seika Pharma Co, Ltd.). Single cells were stained with rat FITC rat anti-mouse CD31 mAb (1:200, catalog #102405, BioLegend, RRID: AB_312900) or rat FITC IgG2a isotype control Ab (1:200, catalog #400505, BioLegend, RRID: AB_2736919), rat anti-NG2 mAb (1:200, catalog #MAB6689, R&D Systems, RRID: AB_10890940), which was labeled by PE using an Ab-10 Rapid R-Phycoerythrin Labeling kit (LK34, Dojindo), or rat PE IgG1 isotype control Ab (1:200, catalog #400408, BioLegend, RRID: AB_326514), and rat BV421 anti-PDGFRα mAb (1:200, catalog #135923, BioLegend, RRID: AB_2814036) or rat BV421 IgG2a isotype control antibody (1:200, catalog #407117, BioLegend, RRID: AB_2687343) for 1 h on ice. NG2+PDGFRα– cells and CD31+ cells were sorted through a 100-μm nozzle using FACSDiva software version 8.0 on FACS Melody (BD Biosciences). The drop delay was optimized using BD Biosciences Accudrop beads (catalog #345249, BD Biosciences) according to the manufacturer's recommendations. Cerebral wall cells were gated on a FSC/SSC plot (Fig. 6B). Debris and dead cells were excluded, and then, NG2+PDGFRα– cells and CD31+ cells were further gated for sorting. For preparation of microglia, CD11b+ cells were collected from cerebral wall cells using a magnetic bead separation (MACS) system (catalog #130-093-634, Miltenyi Biotec).
Coculture of microglia and pericytes
For the coculture to perform immunocytostaining, CD11b+ cells isolated by the MACS system were seeded at a density of 8.3 × 10⁴ cells per cm2 on glass coverslips (5-mm diameter; Matsunami Glass) coated with polyethylenimine (Sigma-Aldrich). Each coverslip was placed in a well of 24-well plate. After cells adhered to the cover glass, culture media were added to 500 µl to achieve the adequate volume for culturing. FACS-isolated NG2+PDGFRα– pericytes (1.0 × 10⁵ cells) were separately cultured on a Transwell membrane (catalog #3413, Corning) in Pericyte growth medium 2 (catalog #D12138, TaKaRa). After 24 h, the Transwell insert on which pericytes were cultured was placed on the microglial cultures, and coculture was started in a mixture of 10% FBS-containing DMEM/F12 and pericyte growth medium 2 (1:1), which contains 2% FBS and supplements for pericyte culture. Under these conditions, we confirmed that both of microglia and pericytes were successfully cultured (data not shown). After culture for 48 h, microglia were fixed, and then immunocytochemistry was performed. For the 5-bromo-2'-deoxyuridine (BrdU) proliferation assay, BrdU was added to the culture of microglia (10 μm) 1 h before fixation to detect proliferating cells.
For the preparation to perform RNA-Sequencing (RNA-Seq), NG2+PDGFRα– pericytes and CD31+ cells were first isolated by flow-cytometry. Endothelial cells (1.0 × 10⁵ cells) and/or pericytes (1.0 × 10⁵ cells) were cultured on a Transwell membrane in 10% FBS-containing DMEM/F12 for 24 h. On the other hand, CD11b+ cells were isolated by the MACS system, and 2.0 × 10⁵ cells of these cells were seeded on 24-well plate coated with polyethylenimine (Sigma-Aldrich). Twenty-four hours after culturing pericytes and endothelial cells, the Transwell insert on which endothelial cells and/or pericytes were seeded was placed on the microglial cultures, and coculture was started. In the dual coculture experiment with microglia and pericytes (Fig. 6), we used conditioned medium composed of half of the pericyte medium, which includes supplements and is optimal for pericyte culture. However, we thought that the artificial factors should be avoided as much as possible for RNA-Seq analysis. Thus, this triple cell-type coculture was performed in normal media (Figs. 7, 8).
We also tested the effect of pericytes on microglial proliferation using direct-contact culture system of microglia and pericytes. However, RNA-Seq analysis demonstrated that the genes related to phagocytosis were exclusively upregulated in microglia cultured with pericytes (data not shown). Since many kinds of gene expression were altered by phagocytosis activation and it seemed hard to understand the molecular mechanism by which pericytes induce microglial proliferation, we selected to use bilayer culture instead of direct-contact culture system.
RNA-Seq analysis
After coculturing for 24 h, total RNA from CD11b+ microglia was extracted using the RNeasy Micro kit (catalog #74004, QIAGEN). The culture was performed in triplet. Libraries were prepared using the SMART-Seq v4 Ultra Low Input RNA kit and TruSeq RNA Sample Prep kit v2 (Illumina) and then further sequenced on the Illumina NovaSeq6000 platform using a 100-bp paired-end strategy at Macrogen.
Analysis was performed on the paired-ends fastqs using the FASTQC tool on Galaxy before proceeding with read mapping. Fastq reads were mapped to the mouse genome assembly (mm10) using TopHat version 2.1.1 with the corresponding sample's mean inner distance between mate pairs. mRNA read counts were quantified during transcript assembly with Cufflinks version 2.2.1.2. For individual gene plots, we calculated fragments per kilobase of exon per million mapped reads (FPKM).
For the heat map, the count data were transformed using the DESeq2 algorithm. Among 24,889 genes, 11,763 genes were selected as valuable genes under the requirement of an FPKM value >1 read and detection in more than three samples among a total of nine samples. Furthermore, the top 10% of genes (1200 genes) were identified by calculating the standard deviation of the log2-transformed normalized mRNA molecules (Fig. 8A).
To generate dynamic Venn diagrams, Cuffdiff (version Galaxy Version 2.2.1.6) differential gene expression data obtained from bulk RNA-Seq experiments were transformed into the diagrams using the web tool Vennt (v0.8.4; http://drpowell.github.io/vennt/; Fig. 8B). The average FPKM value of genes of each group was calculated, and then categorized into two groups, “upregulated” and “downregulated,” by judging whether the average value was upregulated or downregulated in Tr3 compared with Tr2. Next, the genes were categorized based on the statistical threshold (FDR < 0.3) in the comparisons of Tr1 versus Tr2, Tr2 versus Tr3, and Tr1 versus Tr3. Furthermore, the genes that cleared the statistical threshold in both Tr1 versus Tr3 and that of Tr2 versus Tr3 were identified (upregulated: 136 genes, downregulated: 133 genes) as candidates for the next clustering analysis.
Next, driving segment clustering was conducted using k-means for these 269 genes, and 225 genes passed the threshold (FPKM > 1, expressed in at least two of three replicates; Fig. 8C). Fold-change profile clusters were selected for enrichment analysis based on annotations provided by Gene Ontology (GO) biological processes (Fig. 8D). Heatmap visualizations of the number of genes per ontology term was conducted using complete linkage hierarchical clustering. The raw data have been deposited in the DNA Data Bank of Japan (DDBJ) under the DRX accession number: DRX309613–DRX309621. For all other inquiries, please contact the corresponding author.
Immunofluorescence
Brains were fixed in 4% PFA, immersed in 20% sucrose, and then frozen sectioned (16 µm). Cultured cells were fixed in 4% PFA for 10 min at room temperature, washed in PBS, and then immunostained. Sections or cells were treated with the following primary antibodies: rat anti-BrdU mAb (1:1000, catalog #NB500-169, Novus Biologicals, RRID: AB_10002608), rabbit anti-cleaved Caspase 3 (Cl-Casp3) pAb (1:500, catalog #9661S, Cell Signaling Technology, RRID: AB_2341188), goat anti-CD31 pAb (1:600, catalog #AF3628, R&D Systems, RRID: AB_2161028), APC mouse anti-CX3CR1 mAb (1:100, catalog #400408, BioLegend, RRID: AB_326514), rat anti-ERG mAb (1:1000, catalog #ab92513, Abcam, RRID: AB_2630401), chicken anti-GFP pAb (1:1000, catalog #GFP-1020, Aves Labs, RRID: AB_10000240), rat anti-GFP mAb (1:500, catalog #GF090R, Nacalai Tesque, RRID:AB_2314545), rabbit anti-Iba1 pAb (1:2000, catalog #019-19741, Fujifilm Wako Pure Chemical Corp., RRID: AB_839504), rabbit anti-Ki67 pAb (1:1000, catalog #ab15580, Abcam, RRID: AB_443209), rabbit anti-NG2 pAb (1:1000, catalog #AB5320, Merck Millipore, RRID: AB_11213678), rat anti-NG2 pAb (1:200, catalog #MAB6689, R&D Systems, RRID: AB_10890940), rabbit anti-P2RY12 pAb (1:500, catalog #AS-55043A, AnaSpec), rat APC anti-PDGFRα mAb (1:100, catalog #135908, BioLegend, RRID: AB_2043970), rat anti-PDGFRβ mAb (1:100, catalog #16-1402-82, Invitrogen), rabbit anti-Sox2 pAb (1:500, catalog #ab97959, Abcam), and rat eFluor 660 anti-Trb2 mAb (1:100, catalog #50-4875-82, Thermo Fisher Scientific, RRID: AB_469070). After washing, the sections were treated with secondary antibodies conjugated to Alexa Fluor 488, Alexa Fluor 546, or Alexa Fluor 647 (1:1000, catalog #A10040, #A11029, #A11030, #A11039, #A11055, #A11056, #A11081, #A21202, #A21206, #A21208, #A21245, #A21247, #A21447, Invitrogen; 1:1000, catalog #150155, Abcam) and then stained with DAPI (catalog #D9542, Sigma-Aldrich). After staining, the sections were mounted with mounting solution. When necessary, antigen retrieval was performed by heating samples at 70°C in HistoVT One (catalog #06380-05, Nacalai Tesque) for 20 min (Cl-Casp3, Sox2, and Tbr2) or by treatment at RT in 5N HCl for 10 min (BrdU and Ki67). Image data were collected using FV10-ASW software version 4.1 on Fluoview FV1000 (Olympus) and NIS-Elements software AR Analysis version 5.01.00 on TiEA1R (Nikon) and A1Rsi (Nikon).
Evaluation of vascular permeability and endothelial cell proliferation
To evaluate vascular permeability, EZ-Link Sulfo-NHS-Biotin (catalog #21217, Thermo Fisher Scientific), diluted in PBS at 1 mg/ml concentration, was perfused from the hearts of E14 or E15 mice, which were treated with control antibody or APB5 at E13 in advance (Fig. 4C). Mouse brains were fixed with 4% PFA in PBS 10 min after tracer administration. Biotin was immunohistochemically detected with mouse monoclonal Cy3-conjugated anti-biotin antibody (1:500, catalog #C5585, Sigma-Aldrich, RRID: AB_258901).
To detect proliferating endothelial cells, BrdU (50 mg/kg, catalog #B5002, Sigma-Aldrich) was administered intraperitoneally to a dam 1 h before fixation. The proportion of BrdU+ERG+ cells per total ERG+ cells was evaluated through an immunohistochemical analysis (Haber et al., 2015; Ogura et al., 2017; Fig. 4D–G).
Real-time qPCR
APB5 or rat IgG2a isotype control antibody dissolved in saline was injected into the lateral ventricle of embryos at E13 (3.6 µg). After 24 h, the brains were pooled to make three groups: nine brains for APB5-treated samples and six brains for isotype control antibody-treated samples. Cells were isolated from cerebral wall cells by the MACS system, and then, total RNA was extracted. First-strand cDNA was synthesized from 100 ng of total RNA and reverse-transcribed into cDNA using SuperScript III reverse transcriptase (catalog #18080044, Invitrogen) in the presence of RNase OUT Recombinant Ribonuclease Inhibitor (catalog #10777019, Invitrogen). Quantitative real-time PCR (qRT-PCR) was performed with THUNDERBIRD SYBR qPCR Mix (catalog #QPS-201, Toyobo) using Thermal Cycler Dice Real Time System TP800 (TaKaRa). For amplification of specific transcripts, samples were heated at 95°C for 15 min and subsequently underwent a melting curve analysis from 60°C to 95°C. The threshold cycle number (Ct) of the target was calculated and expressed relative to that of GAPDH, and then, ΔΔCt values of the target were calculated and presented as relative fold induction. Primers were as follows: 5′-ACT TCG GGC CAT GTT TCT CT-3′ (sense) and 5′-GCT GGT AGG TTG ATT GTC GT-3′ (antisense) for Cd68; 5′-GTC CTC ATC GTC CTC ATT GC-3′ (sense) and 5′-CTG ATA GCC GGC GTG ACT-3′ (antisense) for Lamp1; 5′-AAG GTG CAA CCT TTT AAT GTG AC-3′ (sense) and 5′-TGT CAT CAT CCA GCG AAC AC-3′ (antisense) for Lamp2 and 5′-GTT GTC TCC TGC GAC TTC A-3′ (sense) and 5′-GGT GGT CCA GGG TTT CTT A-3′ (antisense) for Gapdh.
Statistics and reproducibility
Quantitative data are presented as the mean value ± SD of representative experiments. Statistical differences between groups were analyzed using the Mann–Whitney U test for two-group comparisons and the Steel–Dwass test for multiple comparisons in R software version 3.6.0. All statistical tests were two-tailed, and p < 0.05 was considered significant (**p < 0.01, *p < 0.05, or n.s., not significant). For qRT-PCR analysis, the samples were evaluated by Welch's t test. Individual values were plotted as circles in bar graphs. The number of samples examined in each analysis is shown in the corresponding figure legend. No randomization was used. The mice analyzed were littermates whenever possible. No samples were generally excluded from the analysis. We excluded only the data obtained from failed experiments for several reasons, e.g., failure in sample preparations. No statistical methods were used to predetermine the sample size owing to experimental limitations. The sample size was determined to be adequate based on the magnitude and consistency of measurable differences between groups. Basically, investigators were blinded during experiments. We confirmed that replicate experiments were successful by repeating all experiments at least three times. Representative micrographs are shown in the figures.
Results
Microglia were preferentially attached to pericytes surrounding capillaries
First, we categorized microglia in the cerebral wall according to whether they were associated with capillaries or existed apart from the vascular structure. Immunohistochemistry of the vascular endothelial marker CD31 and microglial marker CX3CR1 of the cerebral walls of E14 CX3CR1-GFP mice (Jung et al., 2000) showed that 52.9% of microglia were attached to capillaries, and the proportion of these classified cells was slightly but significantly greater than that of cells positioned independently from capillaries (Fig. 1A,B).

Microglia were preferentially attached to pericytes surrounding capillaries. A, Immunostaining of CX3CR1+ microglia and CD31+ vascular endothelial cells in the E14 mouse cerebral cortex. Yellow arrowhead, microglia positioned independently from capillaries. Blue arrowhead, microglia attached to capillaries. B, A comparison of the percentage of microglia that were categorized into two groups: those in contact with capillaries and those that were independent from the vascular structure (two-sided Mann–Whitney U test; the average value of four sections from each animal is plotted; N = 6 E14 mice; p = 0.041). Data are presented as the mean value ± SD. C, Immunostaining of CD31+ vascular endothelial cells and PDGFRβ+ pericytes in the E14 mouse cerebral cortex. D, A magnified image of immunostaining for CX3CR1-GFP/CD31/PDGFRβ of the E14 cerebral wall. White arrowheads indicate microglia attached to capillaries via pericytes. E, A pie chart showing how many microglia in contact with pericytes accounted for the total microglia attached to capillaries. The white broken line indicates the apical surface. Scale bar: 100 µm (A, C) or 20 µm (D).
Vascular endothelial cells are covered with mural cell pericytes (Daneman, et al., 2010; Teichert et al., 2017). Coimmunostaining of CD31 and platelet-derived growth factor receptor β (PDGFRβ), which is exclusively expressed in pericytes (Hellström et al., 1999), revealed that the PDGFRβ-positive area overlapped with CD31-positive vascular structures (Fig. 1C). The proportion of pericyte coverage calculated by the CD31-merged and PDGFRβ-merged area per the entire CD31-positive area in the E14 mouse cerebral wall was 79.8%. Importantly, magnified observations to detect the positioning of vascular endothelial cells, pericytes and microglia demonstrated that most of the microglia, which were associated with vascular structures, selectively attached to the regions that were covered with pericytes (Fig. 1D). Among the microglia that were in contact with vascular endothelial cells, the cells associated with vascular endothelial cells via pericytes accounted for 98.4%, while the cells directly touching endothelial cells (without pericytes) constituted a very minor population (1.6%; Fig. 1E). This result motivated us to test the hypothesis that pericytes might facilitate microglial development and/or distribution.
Intraventricular administration of anti-PDGFRβ antibodies resulted in the loss of pericytes surrounding the capillaries
PDGFRβ, which is expressed on pericytes, recognizes platelet-derived growth factor-BB (PDGF-BB) released from vascular endothelial cells (Heldin et al., 1998). Once PDGF-BB binds to PDGFRβ, PDGFRβ dimerization, which activates subsequent autophosphorylation of cytoplasmic tyrosine residues, is induced, thereby initiating a multitude of signal transduction pathways stimulating the proliferation, migration and recruitment of pericytes to the vascular walls of newly formed blood vessels (Lindahl et al., 1997; Heldin et al., 1998; Hellström et al., 1999). Previous studies reported that administration of a rat monoclonal blocking antibody to PDGFRβ (clone APB5), which blocks PDGFRβ signaling by inhibiting PDGFRβ dimerization (Sano et al., 2002), can selectively deplete pericytes in the mouse retina in the postnatal stage (Uemura et al., 2002; Ogura et al., 2017). To examine whether blockade of the PDGFRβ signal transduction pathway could effectively deplete pericytes in the embryonic mouse brain, we administered APB5 or isotype control antibodies to the E13 mouse ventricles (Fig. 2A). Twenty-four hours after intraventricular injection of antibodies, the E14 mouse brains were fixed and analyzed for immunostaining of neural glial antigen 2 (NG2), another pericyte marker, to evaluate the effectiveness of APB5 treatment for pericyte depletion. Since NG2 is also expressed on oligodendrocyte progenitor cells (OPCs), which emerge at around E14 in the lateral cortex and gradually increase their number toward the late embryonic stage (Hill and Nishiyama, 2014; Takebayashi and Ikenaka, 2015), we need to distinguish these cells from pericytes. Of note, OPCs have the following characteristics: they are positive for PDGFRα, a specific marker for OPCs, and are ramified-shaped cells located apart from capillaries; thus, OPCs and pericytes can be distinguished (Fig. 2B). Immunohistochemical analysis for CD31 and NG2 demonstrated that the regional pericyte coverage of capillaries, which was calculated by the CD31 and NG2-merged area per CD31-positive area, was comparable between the saline-treated and isotype control antibody-treated brains (79.3% and 79.0%, respectively). In contrast, this area was markedly reduced in the APB5-treated brains (9.89%) compared with the control brains (Fig. 2C,D).

Administration of APB5 induced pericytes to undergo apoptosis. A, A schematic showing the strategy of in vivo administration of anti-PDGFRβ antibodies (APB5). B, Representative immunostaining for CD31 (green), NG2 (magenta), and PDGFRβ (top) or PDGFRα (bottom; cyan) of the E14 cerebral wall. In top figures, white arrowhead indicates NG2+PDGFRβ+ pericytes and yellow arrowhead indicates NG2+PDGFRβ– OPCs. In bottom figures, white arrowhead indicates NG2+PDGFRα– pericytes and yellow arrowhead indicates NG2+PDGFRα+ OPCs. C, Immunostaining for NG2 (green), CD31 (magenta), and DAPI (blue) in the E14 cerebral wall. D, A graph comparing the proportion of pericyte coverage, which was calculated by dividing the merged area of NG2 and CD31 by the total CD31+ area in the pallium (not including the meninges), between the saline-treated, isotype control antibody-treated, and APB5-treated brains (two-sided Steel–Dwass test; the average value of four sections from each animal is plotted; N = 6 mice; p = 1.000 and p = 0.011; left to right). Data are presented as the mean value ± SD. E, Immunostaining for Cl-Casp3 (green), CD31 (magenta), and DAPI (blue) in the cerebral wall of the mice treated with antibodies or saline. The white broken line indicates the apical surface. Scale bar: 50 µm (B) or 100 µm (C, E).
To determine the cause of pericyte loss when APB5 was administered to the mouse ventricle, we examined whether pericytes might undergo apoptosis in the brain soon after (8 h) an intraventricular injection of saline, isotype control antibodies or APB5 at E14. We rarely found cells positive for Cl-Casp3, a marker of the early phase of apoptosis, in the saline-treated or control antibody-treated brains, while many Cl-Caps3+ cells surrounding the capillaries in the APB5-treated brains were detected (Fig. 2E), indicating that APB5 induced apoptosis in pericytes. These results indicate that the blockade of PDGFRβ signaling via intraventricular APB5 administration could successfully deplete pericytes by inducing apoptosis in the embryonic brain.
Pericyte depletion reduced the density of microglia in the cerebral cortex
To investigate whether pericytes affect microglial dissemination in the developing cortex, we first examined the density of microglia in the cerebral wall of the E14 CX3CR1-GFP mice treated with saline, isotype control antibody or APB5 at 24 h after injection (Fig. 3A). The microglial density was comparable between the saline-treated and control antibody-treated brains, while it was markedly decreased in the APB5-treated brains (Fig. 3B,C).

Pericyte depletion reduced the density of microglia in the cerebral cortex. A, An experimental design for antibody administration and BrdU treatment to the embryo. B, Immunostaining for CX3CR1 (green) and DAPI (blue) in the cerebral walls of the E14 CX3CR1-GFP mice. C, A graph comparing the density of microglia in the cerebral wall of saline-treated, the isotype control antibody-treated, and APB5-treated mice (two-sided Steel–Dwass test; the average value of four sections from each animal is plotted; N = 6 mice; p = 1.000 and p = 0.011; left to right). D, Immunostaining for GFP (CX3CR1) and Ki67 in the cerebral walls derived from the antibody-treated embryos. In the picture of control antibody-treated brains, magnified images are shown. White arrowhead, Ki67+ microglia. Cyan arrowhead, Ki67– microglia. E, A graph comparing the percentage of Ki67+ cells per total CX3CR1+ microglia in the cerebral walls of the saline-treated, isotype control antibody-treated, and APB5-treated mice (two-sided Steel–Dwass test; the average value of four sections per animal is plotted; N = 6 mice; p = 0.881 and p = 0.011; left to right). F, Immunostaining for GFP (CX3CR1) and BrdU in the cerebral walls derived from the antibody-treated embryos. White arrowhead, BrdU+ microglia. Cyan arrowhead, BrdU– microglia. G, A graph comparing the proportion of BrdU+ microglia per total CX3CR1+ microglia in the cerebral walls (two-sided Steel–Dwass test; the average value of four sections from each animal is plotted; N = 6 mice; p = 0.945 and p = 0.011; left to right). Scale bar: 100 µm (B) or 20 µm (D, F).
Next, to investigate how pericyte depletion affects microglia in the cerebral walls, we stained Ki67 to detect proliferating cells. Ki67 is present during all active phases of the cell cycle (G1, S, G2, and M) but is absent in resting cells (G0). We found that the proportion of CX3CR1+ microglia that were positive for Ki67 was significantly decreased in the APB5-treated brains (Fig. 3D,E). To enhance the reliability of the result obtained from Ki67 labeling, we performed further staining with BrdU, another proliferative marker that labels replicating cells during the S phase of the cell cycle (Fig. 3F). We found that the proportion of BrdU+ cells among all CX3CR1+ microglia was significantly lower in the APB5-treated brains (Fig. 3G).
However, APB5 administration might affect vascular structures, thereby causing low microglial density in the cerebral wall. Previous studies reported that pericyte loss caused vascular dysfunction through a failure of tight junctions between endothelial cells (Bell et al., 2010; Sengillo et al., 2013). To test whether APB5 treatment might immediately affect endothelial cells, we evaluated vascular dilation, permeability, and endothelial cell proliferation in APB5-treated brains compared with saline-treated or isotype control antibody-treated brains at 24 or 48 h after administration (Fig. 4A–G). We did not observe any significant differences between the APB5-treated group and the control group at 24 h after injection, which is the time schedule applied in our experiments. However, vascular dilation was detected only at 48 h after treatment (Fig. 4A,B). These data suggest that the vascular structure may still remain stable within 24 h after intraventricular APB5 injection, although the effects appear 48 h after administration. Thus, a decrease in microglial density in APB5-treated brains at 24 h after injection may be directly caused by pericyte depletion.

The influence of APB5 treatment on vascular endothelial cells. A, Immunostaining for CD31 of the E14 (at 24 h after) and E15 (at 48 h after) cerebral walls treated with saline, isotype control antibodies, or APB5 at E13. Arrowheads indicate the vascular dilation in the APB5-treated brains at 48 h after injection. B, A graph comparing the diameter of blood vessels in the cerebral wall of each group [two-sided Steel–Dwass test; the average value of eight sections from each animal is plotted; N = 6 mice; p = 0.945 and p = 0.798 (left to right) for E14, p = 0.945 and p = 0.011 (left to right) for E15]. C, Immunostaining for CD31 and biotin (Cy3) of the E14 (at 24 h after administration) and E15 (at 48 h after) cerebral walls. We did not observe a severe leakage of biotin at 24 h and 48 after antibody administration. D, Immunostaining for BrdU, ETR-related gene (ERG), which is a transcription factor expressed in endothelial cells, and CD31 of the E14 (at 24 h after) cerebral walls treated with isotype control antibodies. E, Magnified images of the white rectangle in D are shown. F, Immunostaining for BrdU and ERG of the E14 (at 24 h after administration) and E15 (at 48 h after) cerebral walls. G, A graph comparing the proportion of ERG+BrdU+ cells per total ERG+ endothelial cells in the cerebral walls [two-sided Steel–Dwass test; the average value of six sections from each animal is plotted; N = 6 mice; p = 0.501 and p = 0.798 (left to right) for E14, p = 0.245 and 0.320 (left to right) for E15]. The data indicate that intraventricular APB5 injection did not affect endothelial cell proliferation within 48 h after administration. Scale bar: 50 µm (A, C, D, F) or 20 µm (E).
Pericyte depletion did not affect microglial cell viability and phagocytotic activity
Next, to test whether APB5 administration might induce microglia to undergo apoptosis, we performed coimmunostaining of CX3CR1 and Cl-Casp3 in the brains 24 h after intraventricular injection of APB5. We found that Cl-Caps3+ nuclei did not merge with CX3CR1+ microglia, indicating that pericyte depletion did not induce microglia to undergo apoptosis (Fig. 5A) but caused a decrease in their proliferative activity (Fig. 3).

Pericyte depletion did not affect microglial cell viability and phagocytotic activity. A, Immunostaining for CX3CR1-GFP (green), Cl-Casp3 (red), and DAPI (blue) in the cerebral walls of the APB5-treated embryos at 24 h after injection. The magnified image (white rectangle in the top) is shown at the bottom. White arrowhead, Cl-Casp3+ cells. Yellow arrowhead indicates microglial cell, which is negative for Cl-Casp3. Scale bar: 100 µm. B, A schematic showing the preparation of isolated microglia derived from antibody-treated brains for qRT-PCR. C, Relative expression of genes normalized against Gapdh in isolated CD11b+ cells derived from the cerebral walls of the E14 mice treated with isotype control antibodies or APB5 (two-sided Welch's t test; n = 3 samples; p = 0.049 for Cd68, 0.439 for Lamp1, and 0.310 for Lamp2). Data are presented as the mean value ± SD. The white broken line indicates the apical surface.
Since a previous report showed that apoptotic uptake profoundly inhibits macrophage proliferation (Reddy et al., 2002), we next investigated whether microglia decreased the proliferative capacity as a result of their enhanced phagocytic activity to engulf apoptotic cells because of APB5 treatment. Therefore, we collected pallial walls from E14 mice treated with isotype control antibody or APB5 at E13, and then microglia were isolated from pallial wall cells based on their surface expression of CD11b using a magnetic separation system (MACS). Total RNA was extracted from harvested CD11b+ microglia and tested for the expression levels of some molecules relevant to phagocytic activity and markers for microglial subtypes by qRT-PCR (Fig. 5B). We investigated the mRNA expression of general markers of activated phagocytic microglia, such as Cd68 and lysosomal-associated membranes 1 and 2 (Lamp1 and Lamp2; Paolicelli et al., 2017; Liu et al., 2021). Cd68 mRNA expression was upregulated in the APB5-treated brains compared with the isotype control antibody-treated brains, while no significant differences were detected in the mRNA expression levels of Lamp1 and Lamp2 (Fig. 5C), suggesting that microglial phagocytic activity was not strongly increased in the cells derived from the APB5-treated brains, but this result prompted us to test whether pericytes contribute to microglial proliferation by another approach.
An in vitro coculture study demonstrated that pericytes induced microglia to proliferate
To test whether pericytes might be directly involved in microglial proliferation and/or survival, we established an in vitro coculture system of microglia with or without pericytes. Cerebral wall cells were collected from E14 mice injected with isotype control antibody or APB5 at E13, and microglia and pericytes were isolated. Microglia were similarly sorted using the CD11b MACS system. For pericyte isolation, we used an anti-NG2 antibody for pericyte detection and did not use an anti-PDGFRβ antibody (APB5) because our results showed that APB5 might induce pericytes to undergo apoptosis. Since OPCs also express NG2, we stained the cells with anti-PDGFRα antibody to exclude OPCs from NG2+ cells. Before the experiment, we performed a preinvestigation for pericyte sorting using anti-PDGFRβ antibody (APB5) and anti-NG2 antibody. Flow cytometry (FACS) analysis of the pallial cells showed that almost all PDGFRβ+ cells were positive for NG2, and the PDGFRβ+NG2+ cells were PDGFRα negative (Fig. 6A). Thus, we assumed that these NG2+PDGFRα– cells were composed mostly of pericytes (Fig. 6B).
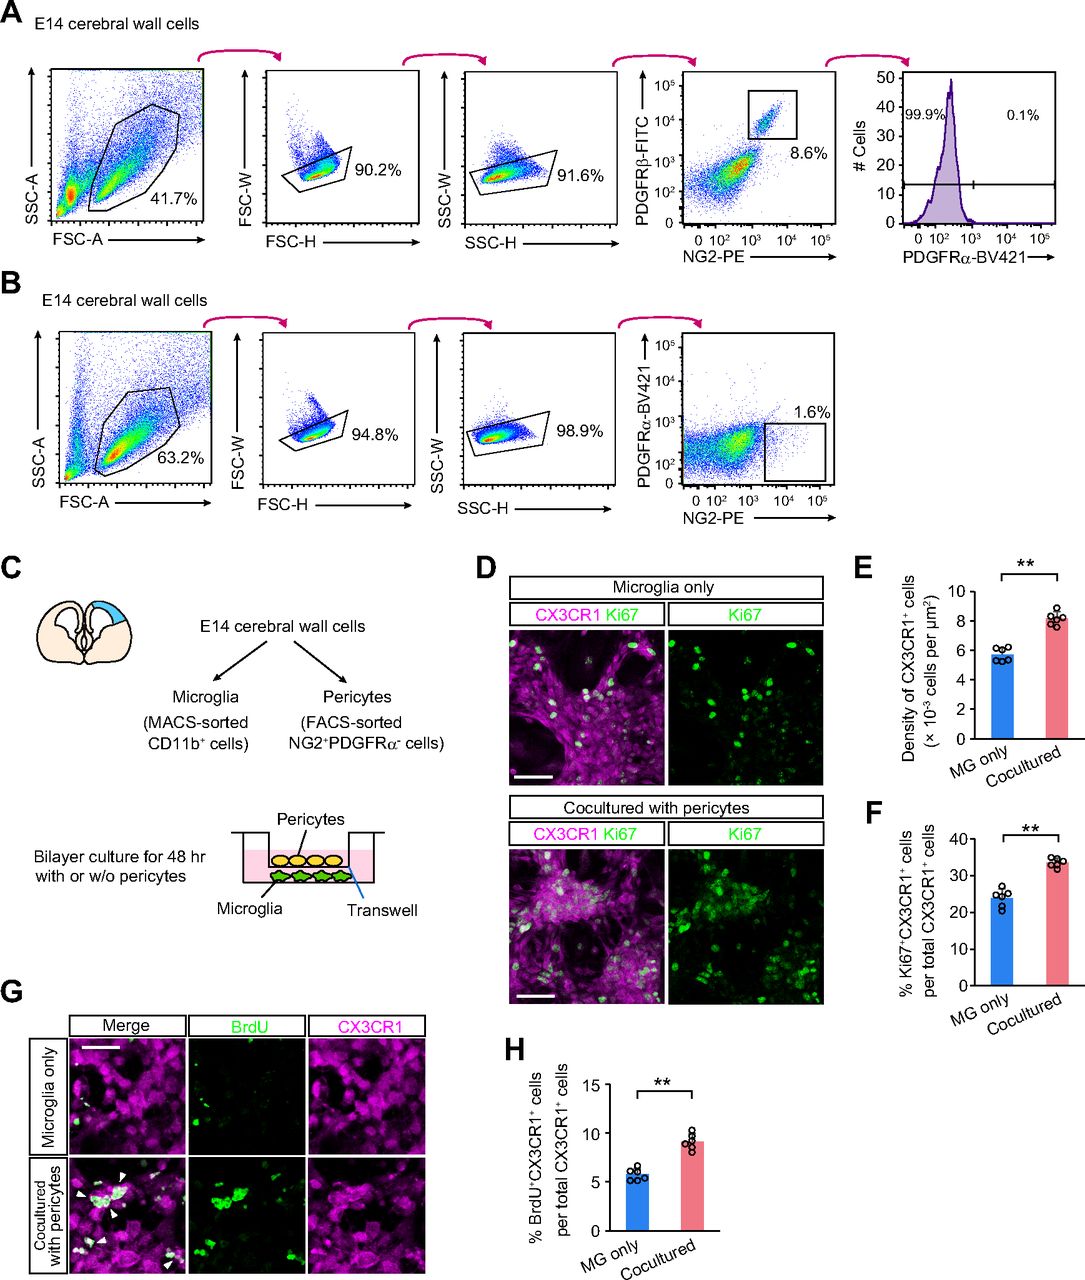
An in vitro coculture showed that pericytes promoted microglial proliferation. A, FACS analysis of pallial cells collected from E14 mice to detect PDGFRβ, NG2, and PDGFRα expression. B, Pericyte sorting strategy by FACS. NG2+PDGFRα– cells were collected from E14 cerebral wall cells. C, A schematic showing the bilayer culture of CD11b+ microglia with or without NG2+PDGFRα– cells (pericytes) using the Transwell insert. D, Immunostaining for CX3CR1 and Ki67 in microglia cultured with or without NG2+PDGFRα− cells (pericytes). E, A bar graph comparing the density of CX3CR1+ cells (two-sided Mann–Whitney U test; the average value of six fields per independent culture is plotted; N = 6 independent cultures; p = 0.002). F, A bar graph comparing the proportion of Ki67+ cells among CX3CR1+ cells (two-sided Mann–Whitney U test; the average value of six fields per independent culture is plotted; N = 6 independent cultures; p = 0.002). G, Immunostaining for CX3CR1 and BrdU in microglia cultured with or without NG2+PDGFRα− cells (pericytes). Scale bar: 20 µm. H, A bar graph comparing the proportion of BrdU+ cells among CX3CR1+ cells (two-sided Mann–Whitney U test; the average value of six fields per independent culture is plotted; N = 6 independent cultures; p = 0.002). Data are presented as the mean value ± SD. Scale bar: 50 µm (D) or 20 µm (G).
Isolated microglia were seeded on the bottom of the dish and cultured with NG2+PDGFRα– pericytes placed in the Transwell insert above the microglial culture or without pericytes for 48 h (Fig. 6C). We found that the density of CX3CR1+ microglia was significantly increased in the microglia cocultured with pericytes compared with the microglial cultures without pericytes (Fig. 6D,E). To test whether pericytes affect the microglial cell cycle, we stained Ki67 to detect proliferating microglia. The proportion of Ki67+ cells among CX3CR1+ microglia, which are in the active phases of the cell cycle, was significantly increased in the cells cocultured with NG2+PDGFRα– cells (Fig. 6D,F). Furthermore, we found that the proportion of replicating BrdU+ cells was significantly greater in the CX3CR1+ microglia in cocultured samples than in the microglia-only cultures (Fig. 6G,H). These results suggest that pericytes likely promote microglial survival and proliferation through the production of soluble factors.
RNA-Seq analysis revealed the influence of pericytes on the gene expression of microglia
To test whether pericytes affect the gene expression pattern of microglia, and if so, to investigate the mechanisms involved in microglial proliferation and/or survival, we performed RNA-Seq analysis on microglia cocultured with pericytes. In the brain, pericytes coexist with vascular endothelial cells. To better simulate physiological microglial responses to pericytes than is possible in the dual cell-type coculture system, a triple cell-type coculture system was established by adding endothelial cells (Fig. 7A). CD11b+ microglia isolated by MACS were seeded on the bottom of the dish, and FACS-sorted CD31+ endothelial cells with or without NG2+PDGFRα– pericytes were placed in the Transwell insert above the microglial culture. We confirmed that the density of microglia and the proportion of BrdU+ proliferating microglia were increased in cultures with both pericytes and endothelial cells compared with cultures only with endothelial cells after 24 h (Fig. 7B–E). Thus, twenty-four hours after coculturing, total RNA was extracted from microglia.

coculture of microglia and pericytes in the presence of endothelial cells. A, A schematic showing the triple cell-type coculture experiment of microglia (MG), endothelial cells (ECs), and pericytes (PCs) for RNA-Seq analysis (Figure 8). NG2+PDGFRα– pericytes and CD31+ endothelial cells were collected from E14 cerebral wall cells by flow-cytometry. Microglia were isolated from E14 cerebral walls by MACS system based on CD11b expression. Tr1, MG-only culture. Tr2, MG cultured with ECs. Tr3, MG cultured with ECs and PCs. B, Bright field images of microglial cultures. C, A bar graph comparing the density of microglia in cultures (two-sided Steel–Dwass test; the average value of one field per independent culture is plotted; N = 6 independent cultures; p = 0.011 and p = 0.043; left to right). Data are presented as the mean value ± SD. D, Immunostaining for CX3CR1 and BrdU in microglial cultures. Arrowhead indicates the cells positive for BrdU. E, A bar graph comparing the proportion of BrdU+ cells among CX3CR1+ cells (two-sided Steel–Dwass test; the average value of four fields per independent culture is plotted; N = 6 independent cultures; p = 0.043 and p = 0.043; left to right). Data are presented as the mean value ± SD. Both the density of microglia and the proportion of proliferating microglia were significantly increased in cultures with pericytes and endothelial cells, compared with the cultures with only endothelial cells. Scale bar: 50 µm (B) or 20 µm (D).
A heatmap revealed a transcriptional change in microglia cocultured with endothelial cells (Tr2) and those cocultured with both endothelial cells and pericytes (Tr3), compared with the control (only microglia) culture (Tr1; Fig. 8A). We found a various pattern of alteration in gene expression among these three groups. To investigate the kind of genes directly affected by pericytes, first, the upregulated or downregulated genes in the Tr3 group compared with the Tr2 group were listed. Next, these listed genes were further categorized based on the statistical threshold in the comparisons of Tr1 versus Tr2, Tr2 versus Tr3, and Tr1 versus Tr3 (Fig. 8B). Furthermore, the genes were selected by judging whether they cleared the statistical threshold of the comparisons of Tr1 versus Tr3 and Tr2 versus Tr3. This classification identified the genes that were valuably upregulated or downregulated in the Tr3 group compared with the Tr1 and Tr2 groups (upregulated: 136 genes, downregulated: 133 genes), implying that these genes were directly modulated in the presence of pericytes.

Transcriptomic profiles of microglia cocultured with endothelial cells and pericytes. A, A heatmap of 1200 genes identified as the top 10% valuable genes among 11 763 genes. Tr1, microglia (MG)-only culture. Tr2, MG cultured with endothelial cells (ECs). Tr3, MG cultured with ECs and pericytes (PCs). B, Venn diagrams for the genes categorized into two groups, “upregulated” and “downregulated,” by judging whether the FPKM average value of the gene was upregulated or downregulated in Tr3 compared with Tr2. Each Venn diagram shows the classification of the genes that were upregulated or downregulated in the Tr3 group compared with the Tr1 and/or Tr2 group. The number of genes identified as valuable genes that were specifically upregulated or downregulated in Tr3 are circled in red. C, The overlapping valuable genes in Tr1 versus Tr3 and Tr2 versus Tr3 were analyzed for K-means clustering. Among 269 candidate genes, 225 genes passed the threshold, and were categorized into three groups based on the gene expression pattern (clusters A–C). D, GO analysis was performed on 225 genes categorized into clusters A–C. The symbol genes which are categorized to each GO term group are summarized in Extended Data Figure 8-1.
Extended Data Figure 8-1
GO analysis for valuable genes in triple cell-type coculture experiment. The list shows symbol genes which are categorized to each GO term group. Download Figure 8-1, EPS file.
Among these 269 candidate genes, 225 genes passed the threshold for k-means clustering. These 225 genes were categorized into three groups by the expression pattern (clusters A to C; Fig. 8C). GO analysis showed that families of genes that encode proteins characteristic of protein metabolic process (categorized as “regulation of protein metabolic process,” “positive regulation of protein metabolic process,” and “positive regulation of catalytic activity”) were highly and specifically induced in Tr3 (cluster C; Fig. 8D; Extended Data Fig. 8-1). The link between metabolic processes and cellular proliferation and/or survival has been well studied (Zhu and Thompson, 2019). Cell proliferation requires the synthesis of intracellular biomass, such as proteins and lipids to generate daughter cells. Such biosynthetic processes were achieved through a network of cellular metabolic pathways. Thus, these data might suggest that pericytes contribute to microglial proliferation and survival by activating pathways of metabolic processes in microglia.
In contrast, the families of genes belonging to response to stimulus (categorized as “response to external stimulus” and “regulation of response to stimulus”) were downregulated (cluster A). These GO terms include any process that results in a change in the state or activity of cells, therefore, interpretation by these responses alone is difficult. However, the genes of microglia were affected by pericyte addition.
Gene families for immune response (categorized as “immune system process” and “response to cytokine”) were also observed to be upregulated in Tr2 compared with Tr1, and augmented in Tr3 compared with Tr2 (Cluster B). For example, the mRNA expression of genes involved in the immune response, such as Ccl2, Ccl3, Ccl7, Ifitm3, Oas2, and Bst2, was upregulated. Further studies are needed to elucidate the detailed molecular mechanism by which pericytes induce microglial proliferation and survival with a focus on these molecules.
Taken together, these RNA-Seq results suggest that pericytes directly modulate the gene expression pattern of microglia, and may trigger microglial proliferation and/or survival through the upregulation of genes that are involved in metabolic processes.
Pericytes indirectly support microglia to efficiently promote the differentiation of neural stem cells into intermediate progenitors
Finally, we tested whether neural lineage cells would be affected by microglial reduction because of pericyte depletion (Fig. 9A). Since previous studies revealed that microglia promote the differentiation from neural stem cells into intermediate progenitors (Arnò et al., 2014; Hattori and Miyata, 2018), we examined the numbers of Sox2+ neural stem cells and Tbr2+ intermediate progenitors in each bin (40-µm height vertically to the apical surface) numbered from the apical surface among the saline-treated, isotype control antibody-treated, and APB5-treated groups. We found that the number of Sox2+ cells was significantly increased in the APB5-treated brains compared with the control brains, especially in the region near the apical surface (bins 1–3). However, we did not detect a significant difference in the more distant region (bins 4 and 5; Fig. 9B,C). Moreover, the number of Tbr2+ cells located in bins 1–3 was significantly diminished in the APB5-treated brains compared with the control brains. These results suggest that microglia could not fully promote the differentiation of neural stem cells into intermediate progenitors when pericytes were depleted.

Microglial loss because of pericyte depletion affected the differentiation of neural progenitors. A, A schematic showing the strategy of in vivo administration of liposomal clodronate and antibodies (APB5 or isotype control antibodies). B, Immunostaining for Sox2 and Tbr2 in the E14 cerebral walls treated with isotype control antibodies or APB5. C, The number of cells expressing Sox2 (left) and Tbr2 (right) in 40-µm bins in the cerebral wall, which was numbered 5 bins from the apical surface [two-sided Steel–Dwass test; the average value of four sections per animal is plotted; N = 6 mice; p = 1.000, 0.011, 0.795, 0.010, 0.945, 0.011, 0.967, 0.146, 0.799, and 0.107 for Sox2 (bottom to top) and p = 0.880, 0.011, 0.915, 0.011, 0.915, 0.011, 0.986, 0.751, 1.000 and 0.489 for Tbr2 (bottom to top)]. D, Immunostaining for P2RY12 and DAPI of the E14 cerebral walls comparing groups treated with empty or clodronate liposomes. E, Immunostaining for CD31 and PDGFRβ of the E14 cerebral walls. F, A bar graph comparing the proportion of pericyte coverage, which was calculated by dividing the merged area of PDGFRβ and CD31 by the total CD31-positive area in the pallium (not including the meninges), between the empty liposome-treated and APB5-treated brains (two-sided Mann–Whitney U test; the average value of four sections per animal is plotted; N = 6 mice; p = 1.000). G, Immunostaining for Sox2 and Tbr2 in E14 cerebral walls treated with empty liposomes or clodronate. The clodronate-treated mice were administered isotype control antibodies or APB5. H, A comparison of the numbers of cells expressing Sox2 (left) and Tbr2 (right) in 40-µm bins in the cerebral walls in each bin (two-sided Steel–Dwass test; the average value of four sections per animal is plotted; N = 6 mice; p = 0.014, 0.996, 0.011, 0.968, 0.011, 0.945, 0.870, 0.692, 0.574, and 0.966 for Sox2 and p = 0.011, 0.838, 0.011, 0.277, 0.011, 0.945, 0.181, 0.840, 0.159, and 0.521 for Tbr2; bottom to top). Data are presented as the mean value ± SD. White broken line, the apical surface. Scale bar: 100 µm (D, E) or 20 µm (B, G).
However, we could not exclude the possibility that such alterations in the number of Sox2+ cells and Tbr2+ cells were because of other factors, such as the direct effect of APB5 on neural lineage cells or vascular endothelial cells. To assess whether the increase in Sox2+ cells and the decrease in Tbr2+ cells were caused by microglial loss because of pericyte elimination, we combined APB5 administration with an injection of clodronate liposomes, which can selectively remove microglia. At E12, clodronate or empty liposomes were injected into the ventricles, followed by the administration of APB5 or isotype control antibodies at E13 (Fig. 9A). Twenty-four hours after antibody treatment, the density of P2RY12+ microglia was markedly lower in the groups treated with clodronate liposomes than in the empty liposome-injected groups, in which microglia were abundantly distributed in the brains (Fig. 9D). To determine whether clodronate might affect pericyte proliferation, we investigated pericyte coverage and the ratio of the PDGFRβ and CD31-merged area to the CD31-positive area (Fig. 9E). However, no overt phenotypes were detected between the control and clodronate-administered brains (Fig. 9F). Immunohistochemical analyses of Sox2 and Tbr2 expression in the control antibody-treated groups, which were pretreated with empty or clodronate liposomes, showed that the number of Sox2+ cells was greater but that of Tbr2+ cells was fewer in the region near the apical surface in the clodronate-treated brains than in the empty liposome-treated brains (Fig. 9G,H), which is consistent with a previous report examining the impact of microglial removal by clodronate liposome injection on neural lineage cells (Hattori and Miyata, 2018). Notably, in a comparison of the clodronate-treated groups between the control antibody and APB5 treatment groups, no obvious changes were observed, indicating that the increase in Sox2+ cells and the decrease in Tbr2+ cells in the APB5-treated brains were induced by microglial loss as a result of pericyte depletion.
Taken together, pericytes indirectly support microglia to efficiently promote the differentiation of neural stem cells into intermediate progenitors.
Discussion
This study revealed that blockade of PDGFRβ signals by intraventricular APB5 injection induced pericytes to undergo apoptosis, leading to the loss of pericytes surrounding the capillaries in the cerebral walls. In pericyte-depleted brains, the density of microglia in the pallium was markedly decreased. An in vitro coculture study of microglia and NG2+PDGFRa– cells, which were mostly composed of pericytes, suggests that pericytes likely promote microglial survival and proliferation through the production of secretory molecules. Furthermore, pericytes facilitate microglial homeostasis, thereby indirectly supporting microglial effects on neural progenitors.
Emerging evidence has highlighted the relationship between vascular endothelial cells and neural lineage cells in the developing brain. Javaherian and Kriegstein reported that neural progenitors are closely associated with cortical vessels (Javaherian and Kriegstein, 2009). Tata and colleagues found the essential roles of vascular structures in regulating the expansion and differentiation of neural progenitor cells (Tata and Ruhrberg, 2018). Komabayashi-Suzuki an colleagues demonstrated that cortical vessels provide different niches to support ongoing neurogenesis and gliogenesis (Komabayashi-Suzuki et al., 2019). Moreover, multiple in vitro studies underscored the association of the vasculature and neural stem cells. Shen and colleagues proposed that vascular endothelial cells induce neurogenesis by stimulating neural stem cells to proliferate in the developing brain (Shen et al., 2004). Other groups also showed that when cocultured with embryonic neural progenitors, endothelial cells promoted stem cell maintenance via unknown soluble factors (Gama Sosa et al., 2007; Vissapragada et al., 2014). Hence, vascular endothelial cells likely regulate neurogenesis in the developing brain; however, whether pericytes collaboratively function in these aspects together with vascular endothelial cells remains to be elucidated. On the other hand, increasing evidence has demonstrated the interaction between vascular endothelial cells and microglia in the developing brain. Cortical vessels have been suggested to serve as a route of microglial entry into the cortex (Rezaie and Male, 1999). More recent studies have reported that microglia use blood vessels as scaffolds to migrate throughout the CNS structure (Grossmann et al., 2002; Checchin et al., 2006; Monier et al., 2007; Fantin et al., 2010; Mondo et al., 2020). Microglia also regulate vascular formation and complexity in the developing brain and retina (Checchin et al., 2006; Fantin et al., 2010; Rymo et al., 2011; Dudiki et al., 2020). Although vascular endothelial cells and microglia mutually regulate or promote appropriate brain development, how or whether pericytes impact these phenomena is not well understood. Pericytes might act as an interface among vascular structures, microglia and neural lineage cells. Additional experiments to test such possibilities are needed and will provide new insights into pericyte function.
We demonstrated that pericyte removal by APB5 treatment inhibited microglial proliferation, thereby resulting in a lack of microglia in the parenchyma. Moreover, the numbers of Sox2+ neural stem cells and that of Tbr2+ intermediate progenitors were increased and decreased in the cerebral wall of pericyte-depleted brains, respectively. We found no obvious change in the number of Sox2+ neural stem cells and Tbr2+ intermediate progenitors in the microglia-depleted brains when comparing the APB5-treated and isotype control antibody-treated brains, suggesting that pericyte loss because of APB5 treatment would not affect the numbers of Sox2+ or Tbr2+ cells, but microglial loss may be involved in the alterations in these cell numbers. However, we did not rule out the possibility that pericytes contribute to neurogenesis in embryonic brains. Previous reports have shown that pericytes support neurogenesis using in vitro culture and in vivo experiments in adult mice. For example, pericytes derived from adult brains have been reported to exhibit a multipotential neural stem cell capability and were demonstrated to differentiate into neural stem cells in the presence of basic fibroblast growth factor (Dore-Duffy et al., 2006). In an ischemic mouse model, pericytes promoted neurogenesis by secreting CXCL12, nerve growth factor and neurotrophin-3 (Sato et al., 2016). In our study, the effect of pericyte depletion on neural lineage cells was evaluated in a relatively short term (24 h after treatment) because we thought that whether the phenotypes observed in the APB5-treated brains are caused by pericyte loss or vascular dysfunction would be difficult to judge from experiments with long-term APB5 treatment. In fact, a previous study reported that the correct development of the vascular structure is crucial for neuronal formation and function (Eichmann and Thomas, 2013). Therefore, additional experiments to address these problems should be conducted to determine whether pericytes are directly involved in neurogenesis in embryonic brains.
In summary, our findings provide new insights into the link between pericytes and microglia in developing embryonic brains. Pericytes play critical roles not only in cerebral microcirculation maintenance and BBB integrity but also in microglial homeostasis support in the developing cerebral walls. We found that pericytes directly modulated the gene expression pattern in microglia, and induced the upregulation of genes involved in the metabolic process. Further studies on which molecules released from pericytes contribute to this phenomenon are needed. A deeper understanding of the roles of pericytes may help elucidate brain development in both healthy and pathologic conditions.
Footnotes
This work was supported by Japan Society for the Promotion of Science (JSPS) KAKENHI Grant Numbers JP18K15003, JP21K15330, and JP21H05624; the Mochida Memorial Foundation for Medical and Pharmaceutical Research; the Kanae Foundation for the Promotion of Medical Science; the Uehara Memorial Foundation; and the Narishige Neuroscience Research Foundation. We thank the Division for Medical Research Engineering, Nagoya University Graduate School of Medicine, for the use of and technical support with the flow cytometer (FACS Melody) and confocal microscopy (Nikon TiE-A1R and Olympus FV1000). We also thank Makoto Masaoka and Namiko Noguchi (Department of Anatomy and Cell Biology, Nagoya University Graduate School of Medicine) for technical assistance.
The authors declare no competing financial interests.
- Correspondence should be addressed to Yuki Hattori at ha-yuki{at}med.nagoya-u.ac.jp


