

Abstract
Interferon regulatory factor 8 (IRF8) is a transcription factor necessary for the maturation of microglia, as well as other peripheral immune cells. It also regulates the transition of microglia and other immune cells to a pro-inflammatory phenotype. Irf8 is also a known risk gene for multiple sclerosis and lupus, and it has recently been shown to be downregulated in schizophrenia. While most studies have focused on IRF8-dependent regulation of immune cell function, little is known about how it impacts neural circuits. Here, we show by RNAseq from Irf8−/− male and female mouse brains that several genes involved in regulation of neural activity are dysregulated. We then show that these molecular changes are reflected in heightened neural excitability and a profound increase in susceptibility to lethal seizures in male and female Irf8−/− mice. Finally, we identify that TNF-α is elevated specifically in microglia in the CNS, and genetic or acute pharmacological blockade of TNF-α in the Irf8−/− CNS rescued the seizure phenotype. These results provide important insights into the consequences of IRF8 signaling and TNF-α on neural circuits. Our data further suggest that neuronal function is impacted by loss of IRF8, a factor involved in neuropsychiatric and neurodegenerative diseases.
SIGNIFICANCE STATEMENT Here, we identify a previously unknown and key role for interferon regulator factor 8 (IRF8) in regulating neural excitability and seizures. We further determine that these effects on neural circuits are through elevated TNF-α in the CNS. As IRF8 has most widely been studied in the context of regulating the development and inflammatory signaling in microglia and other immune cells, we have uncovered a novel function. Further, IRF8 is a risk gene for multiple sclerosis and lupus, IRF8 is dysregulated in schizophrenia, and elevated TNF-α has been identified in a multitude of neurologic conditions. Thus, elucidating these IRF8 and TNF-α-dependent effects on brain circuit function has profound implications for understanding underlying, therapeutically relevant mechanisms of disease.
Introduction
Interferon regulator factor 8 (IRF8) is a transcription factor that regulates global gene expression in macrophages, as well as other immune cell types, basally and on an inflammatory stimulus (Salem et al., 2020). Further establishing the importance of IRF8, mutations in the gene confer genetic risk for multiple sclerosis (MS) (De Jager et al., 2009; 2011) and lupus (Cunninghame Graham et al., 2011). Irf8 is also decreased in patients with schizophrenia (Snijders et al., 2021). While IRF8-dependent effects in disease have mainly been attributed to its signaling in peripheral immune cells, the impact of IRF8 signaling on cells of the CNS has garnered less attention.
In the CNS, IRF8 is known to regulate microglial maturation and their transtion to a pro-inflammatory phenotype in a disease setting (Masuda et al., 2012; Yoshida et al., 2014; Zhou et al., 2019; Guo et al., 2020; Salem et al., 2020). During development, microglia are born as erythromyeloid progenitor cells where they transition first to an A1 and then an A2 progenitor cell, which requires IRF8 and PU.1 (Kierdorf et al., 2013). Previous work has shown that, in the absence of IRF8, microglia-like cells do enter and take up residence in the brain. However, they fail to adopt the mature, homeostatic adult microglia gene signature, which typically includes upregulation of molecules, such as P2ry12, Tmem119, Hexb, and Sall1, and downregulation of molecules, such as Apoe, Runx3, Cxcr4, Cst7, and Clec7a (Minten et al., 2012; Hagemeyer et al., 2016). Instead, their transcriptional signature more closely resembles embryonic microglia and peripheral resident tissue macrophages, such as those in the lung and liver. In addition, modulating microglial development, IRF8 is also critical for microglia to adopt a pro-inflammatory gene signature in disease. For example, following peripheral nerve injury, spinal cord microglia require IRF8 to induce the expression of proinflammatory molecules, such as IL-1β and subsequent gliosis (Masuda et al., 2012). Interestingly, Irf8−/− mice are also resistant to this neuropathic pain model (Masuda et al., 2012). These results suggest that loss of IRF8 impacts neuronal function either directly or indirectly through affecting microglial inflammatory signaling.
In the current study, we sought to address how IRF8 impacts cells of the CNS more broadly. We first identified by RNAseq from whole Irf8−/− (Holtschke et al., 1996) brains that genes encoding for ion channels, calcium signaling, and neurotransmitter signaling were dysregulated. These transcriptional changes were reflected in heightened neural excitability in hippocampal and cortical circuits in Irf8−/− mice and profound susceptibility to lethal seizures. We further showed that this heightened excitability is because of elevation of TNF-α in the CNS, and spatial transcriptomics revealed that TNF-α was specifically increased in microglia in Irf8−/− mice. These data demonstrate that IRF8 signaling is critical to not only immune cell function, but also neuronal function. This could have important implications where changes in Irf8 expression have been identified (e.g., schizophrenia) (Snijders et al., 2021) or where mutations in Irf8 are known to confer genetic risk (e.g., MS and lupus) (De Jager et al., 2009, 2011; Cunninghame Graham et al., 2011). Additionally, there are implications for a wide range of neurologic disorders, ranging from neurodevelopmental disorders, such as autism, to neurodegenerative diseases, such as Alzheimer's disease, where seizures are a comorbidity and elevated TNF-α is observed (Frankola et al., 2011; Cheng et al., 2014; Theoharides et al., 2016; Jung et al., 2019; Heir and Stellwagen, 2020)
Materials and Methods
Animals
Cx3cr1eGFP/+ (stock #005582), Tnfrsfab−/− (stock #003243), Cx3cr1-Cre (stock #025524), and Rosa26lslTomato mice were obtained from The Jackson Laboratory. Irf8−/− animals were obtained from Marco Prinz. Irf8+/+ and Irf8−/− littermates were generated by breeding heterozygous Irf8+/− mice. Irf8+/+;Cx3cr1eGFP/+ and Irf8−/−;Cx3cr1eGFP/+ littermates were generated by breeding heterozygous Irf8+/−;Cx3cr1eGFP/+. Irf8−/−;Tnfrsfab−/− and littermate controls were generated by breeding double heterozygous Irf8+/−;Tnfrsfab+/−. Equal numbers of males and females were used. All animal experiments were performed in accordance with Animal Care and Use Committees and under National Institutes of Health guidelines for proper animal use and welfare.
Cortex and hippocampus bulk RNAseq
Total RNA was isolated from micro-dissected cortex and hippocampus. Frozen tissue was added to a tissue grinder (DWK Life Sciences) containing 700 µl ice-cold Trizol LS reagent (Invitrogen) and 200 µl nuclease-free water in a 4°C cold room. Tissue was homogenized using a polytetrafluoroethylene (DWK Life Sciences) pestle attached to a laboratory stirrer (Yamato Scientific) for a total of 15 strokes at 900 RPM. Homogenates were transferred to 5′ phase lock gel (heavy) containing tubes (Quanta Bio) at room temperature for 5 min; then 200 µl chloroform:isoamyl alcohol was added. Tubes were shaken vigorously and incubated at room temperature for 5 min. Samples were spun at 13,000 × g for 10 min at 4°C followed by a second addition of 200 µl chloroform:isoamyl alcohol. Samples were spun again at 13,000 × g for 10 min at 4°C. The aqueous layer was transferred to a nuclease-free microcentrifuge tube, and 3 m sodium acetate, pH 5.5 (1/10 aqueous volume, Invitrogen), glycoblue (3 µl, Invitrogen), and 2-propanol (equal volume of aqueous volume, Sigma-Aldrich) were added. Tubes were transferred to −80°C for one night. Samples were spun at 21,000 × g for 30 min at 4°C. Pellets were washed with 1 ml ice-cold 70% ethanol and then spun at 21,000 × g for 10 min at 4°C, then washed and spun a second time. Pellets were air-dried, then resuspended in 30 µl nuclease-free water. Total RNA samples were submitted to the Yale Center for Genome Analysis where a bioanalyzer was run to ensure sample integrity. Libraries were prepared using Ribo-Zero Plus rRNA Depletion Kit (Illumina), and sequencing was performed using HiSeq4000 (Illumina).
Immunostaining
At the indicated time points, mice were deeply anesthetized and transcardially perfused with 0.1 m PB followed by 4% PFA/0.1 m PB. Brains were postfixed at 4°C in PFA overnight. Brains were then equilibrated in 30% sucrose/0.1 m PB, and then embedded in a 1:1 mixture of 30% sucrose/0.1 m PB and OCT compound (Thermo Fisher Scientific). Tissue was cryo-sectioned into 10-12 µm sections. Sections were blocked and permeabilized at room temperature for 1 h in 10% normal goat serum/0.1 m PB containing 0.3% Triton X-100 (all Sigma-Aldrich) followed by overnight incubation with primary antibodies at room temperature. The following primary antibodies have been used: guinea pig pAb α-VGLUT1 (Millipore, ab5905, 1:2000), guinea pig pAb α-VGLUT2 (Millipore, ab2251, 1:2000), rabbit pAb α-VGAT (Synaptic Systems, #131002, 1:1000), rabbit pAb α-c-Fos (Abcam, Ab190289, 1:1000), rabbit pAb α-Homer1 (Synaptic Systems, #160003, 1:1000), and chicken pAb α-NeuN (Millipore, ABN91, 1:1000). The following day, sections were incubated with appropriate Alexa-fluorophore-conjugated secondary antibodies (Thermo Fisher Scientific) and mounted with Fluoroshield containing DAPI (Sigma-Aldrich).
RNA ISH
RNA ISH was performed according to the manufacturer's specification (ACDBio). Briefly, two sections from each sample were treated with Protease III for 20 min at 40°C, rinsed with RNase-free water, and incubated with RNA in situ probes against Fos (ACDBio) for 2 h at 40°C. Subsequent amplification steps were performed according to the manufacturer's specification. Sections were mounted with Fluoroshield containing DAPI (Sigma-Aldrich).
Seizures
Mice were injected intraperitoneally (i.p.) with pentylenetetrazol (PTZ, 40 mg/kg, 60 mg/kg, Sigma-Aldrich) or kainic acid (35 mg/kg, Sigma-Aldrich), then evaluated for Stage I lethargy/immobility, Stage II myoclonic jerks, Stage III generalized clonus, Stage IV tonic-clonic with recovery, and Stage V tonic-clonic with death. For pharmacological TNF blockade, mice were injected with either a blood–brain barrier (BBB)-permeable transferrin receptor + TNF receptor fusion protein (cTfRMAb-TNFR) (3 mg/kg, i.p.) produced by Wuxi (Chang et al., 2017) or the peripherally acting TNF inhibitor etanercept (3 mg/kg, i.p., Immunex) 24 h before PTZ administration. For pharmacological interleukin 1 receptor blockade, mice were injected with a interleukin 1 receptor antagonist (IL-Ra) (25 mg/kg, i.p, Sobi)
EEG/EMG recording
Mice were anesthetized with ketamine/xylazine (100 and 10 mg per kg, respectively, i.p.). Mice were implanted with four EEG screw electrodes (2 frontal [1 mm frontal, 1 mm lateral from bregma] and 2 parietal [mid-distance between bregma and λ and 1 mm lateral from the mid-line] electrodes; Pinnacle Technology) and two flexible EMG wire electrodes (in the neck muscles; Plastics One), previously soldered to a 6-pin connector (Heilind Electronics), and the assembly was secured with dental cement. The scalp wound was closed with surgical sutures, and the mouse was kept in a warm environment until resuming normal activity as previously described (Anaclet et al., 2018a,b; Erickson et al., 2019). One to 2 weeks after surgery, the mice were housed individually in transparent barrels in an insulated soundproofed recording chamber maintained at an ambient temperature of 22 ± 1°C and on a 12 h light/dark cycle (lights on at 7:00 A.M.) with food and water available ad libitum. Mice were habituated to the recording cable for 5-7 d before starting polygraphic recording. Cortical EEG (ipsilateral frontoparietal leads) and EMG signals were amplified (A-M. System 3500) and digitalized with a resolution of 256 Hz using Vital Recorder (Kissei).
Electrophysiology
After pentobarbital injection (200 mg/kg), mice (P21-P44) were perfused with ice-cold cutting solution consisting of the following (in mm): sucrose 228, NaHCO3 26, glucose 11, KCl 2.5, NaH2PO4 1, CaCl2 0.5, MgSO4 7. Brains were quickly removed, and horizontal hippocampal slices (300 µm) were prepared with a vibratome (Leica VT1200) (Kang et al., 2021). Slices were incubated in ACSF for 1 h at 33°C, then at room temperature (22°C-24°C) until use. ACSF contained the following (in mm): NaCl 125, KCl 2.5, NaH2PO4 1.25, glucose 11, NaHCO3 26, MgCl2 1.3, CaCl2 2. Whole-cell recordings were performed in voltage-clamp and current-clamp mode using MultiClamp 700B (Molecular Devices). Pipette solution for voltage clamp consisted of CsMeSO4 135, NaCl 8, HEPES 10, EGTA 0.25, MgATP 2, NaGTP 0.3, phosphocreatine 7 (mOsm 290, pH 7.3). For current-clamp recording, CsMeSO4 was replaced with KmeSO4. The resistance of the pipettes ranged from 3 to 5 mΩ. Signals were filtered (3 kHz, Bessel), digitized (20 kHz, Digidata 1440A, Molecular Devices), and analyzed with Minianalysis (Synaptosoft). mEPSCs were isolated in TTX (1 µm, Tocris Bioscience), CPP (10 µm, Tocris Bioscience), and SR95531 (10 µm, Tocris Bioscience) at a holding potential of −70 mV. mEPSC events were detected using Minianalysis during the last 5 min period of 13 min drug application. For resting membrane potential, time constant, and input resistance in current clamp, current was injected from −50 to 50 pA with 10 pA steps for 1 s duration at 5 min after whole-cell configuration in ACSF (Kang et al., 2021). To evoke action potential frequency change to current injection, current was injected from 0 to 300 pA with steps of 50 pA. After a 1-2 min interval, sEPSC were recorded in voltage-clamp mode at holding potential of −70 mV. For the excitability experiment, GABAA antagonist (10 µm SR95531) was applied for 15 min. Synchronized activities were defined as a typical biphasic signal pattern. All recordings and analyses were performed blind to genotype.
TNF-α ELISA assays
Mice were deeply anesthetized and transcardiac perfused with ice-cold PBS. Cortex and hippocampus were micro-dissected and flash frozen in liquid nitrogen. Total protein was isolated using tissue protein extraction reagent (Thermo Fisher Scientific) supplemented with protease inhibitors (Roche). TNF-α concentrations in cortex and hippocampus protein lysates were measured using the V-PLEX Proinflammatory panel (mesoscale delivery).
qPCR
Genomic DNA was digested using Turbo DNA-free kit (Invitrogen), and cDNA synthesis was performed using High-Capacity RNA-to-cDNA kit (Applied Biosystems). qPCR was performed using commercially available prevalidated qRT-PCR primer assays (QIAGEN), PowerSYBR master mix (Invitrogen), and run using a CFX96 real-time PCR instrument (Bio-Rad).
Multiplexed error-robust FISH (MERFISH)
Mice were killed and brains were immediately place in cold OCT. Embedded brain were then frozen and transferred to −80°C for storage. Next, we followed the sample preparation according to the Vizgen Fresh Frozen Tissue Sample Preparation protocol. Briefly, a 10 µm slice of the tissue was sectioned and placed on a functionalized coverslip covered with fluorescent beads. Once adhered to the coverslip, the tissue was be fixed (4% PFA in 1× PBS, 15 min, room temperature) followed by three washes with 1× PBS. After aspiration, 70% ethanol was added to permeabilize the tissue (24 h, 4°C). After a wash with Formamide Wash Buffer (30% formamide in 2× SSC) the MERFISH library mix was added and left for the hybridization to occur for 48 h. Sample was then washed and incubated at 47°C with Formamide Wash Buffer twice, and then the tissue was embedded in a polyacrylamide gel followed by incubation with tissue clearing solution (2× SSC, 2% SDS, 0.5% v/v Triton X-100, and 1:100 proteinase K) overnight at 37°C. Then, tissue was washed and hybridized for 15 min with the first hybridization buffer, which contained the readout probes associated with the first round of imaging. After washing, the coverslip was assembled into the imaging chamber and placed into the microscope for performing the imaging step. The reagent cartridge was filled with the imaging kit buffers and hybridization buffers that will be loaded automatically into the imaging chamber. MERFISH imaging was performed on an automated Vizgen Alpha Instrument as previously described (Moffitt et al., 2018; Chen et al., 2015) with parameters files provided by Vizgen. Briefly, the sample was loaded into a flow chamber connected to the Vizgen Alpha Instrument. First, a low-resolution mosaic image is acquired (405 nm) with a low-magnification objective (10×). Then the microscope was switched to a high-magnification objective (×60) and seven 1.5 µm z-stack images of each FOV position were generated in 750, 647, and 561 nm channels. A single image of the fiducial beads on the surface of the coverslip is acquired and used as spatial reference (488 nm). After each round of imaging, in an automated fashion, the readout probes were extinguished, and the sample was washed and hybridized with the next set of readout probes. This process was repeated until combinatorial FISH was completed. Raw data were decoded using the MERLIN pipeline (version 0.1.6, provided by Vizgen) using the codebook for the library used.
Experimental design and statistical analyses
Bulk RNA sequencing analysis
FASTQ files were aligned to mm10 mouse reference genome (UCSC) using Salmon (version 1.6.0). Transcripts per million abundance was imported to R using the tximport package (version 1.20.0). Three differentially expressed gene (DEG) analyses were then performed. For analysis of cortex and hippocampus separately, N = 3 animals were assessed per genotype. For the cortex and hippocampus combined analyses, N = 6 samples (three hippocampi and three cortices) from 3 animals were assessed per genotype. DEGs were calculated using DEseq2 R package (version 1.32.0). Genes with fold change ± 1.25-fold and p value ≤0.05 were considered DEGs. To generate MA plots, the average expression for each gene was plotted on the x axis and log2 fold change plotted on the y axis. To evaluate DEGs not different expressed in Irf8−/− microglia, Venn diagrams were generated (https://bioinformatics.psb.ugent.be/webtools/Venn/) comparing cortex, hippocampus, or cortex hippocampus combined with Irf8−/− microglia genes with ±1.5-fold change and p value ≤0.05 obtained from Hagemeyer et al. (2016). Nonoverlapping genes were then used in downstream gene ontology (GO) analyses. To evaluate GO in the nonmicroglial DEG overlapping subsets, genes with fold change ≥1.25-fold (up genes) or fold change ≤1.25 (down genes) were input into the Database for Annotation, Visualization and Integrated Discovery tool (DAVID, https://david.ncifcrf.gov/). Results for molecular function (GOTERM_MF_DIRECT) are reported in Figure 1 as -log(p value). To evaluate GO of all Irf8−/− DEGs in cortex, hippocampus, and cortex hippocampus combined were input into DAVID. Results for biological process (GOTERM_BP_DIRECT) are reported in Figure 6 as -log(p value). For heatmap visualization, z scores for each gene were calculated across all samples. The pheatmap package (version 1.0.12) was used to generate the heatmap of DEGs present in the tumor necrosis factor production (GO:0032640) list with average z scores for each genotype and brain region.
MERFISH data quality control and filtering
Single-cell gene expression matrices were obtained by counting mRNA molecules within segmented cell boundaries and further analyzed in R using Seurat package and custom-made scripts. We excluded cells containing <10 transcripts or volume <50 µm3. To account for global differences in mRNA counts between samples, we normalized data to the total transcripts/cell for each sample. We then normalized each cell's gene expression by the cell's volume to compute counts/µm3. Cells with <10 unique genes or 0.0005 transcripts/µm3 were then further excluded.
MERFISH annotation of cell types
Data from all samples were merged into a single Seurat object for clustering and cell type annotation. Data were normalized by dividing gene counts/µm3 for each cell by total count/µm3 for that cell, multiplied by 10,000 and log-transformed. Data were then scaled, and principal components were calculated on all 430 measured genes. Thirty-eight principal components were used to calculate UMAP embedding and perform clustering analysis using Louvain algorithm and resolution 2.4. Clusters were manually annotated based on the spatial distribution of the cells in the tissue and the expression cell type-specific marker genes. Because of imperfections in cell boundary segmentation, a small fraction of cells expressed cell type markers for multiple cell types. Clusters composed of these “hybrid” cells were removed from the analysis, and UMAP embedding and clustering analysis were iteratively repeated until all “hybrid” clusters were removed. Analysis plots were generated using Seurat 4.1.0.9005and scCustomize(ref2) R packages R 4.0.0
c-Fos density quantification
For determining the density of c-Fos-positive neurons (NeuN), 2 or 3 randomly selected 40× FOVs were collected from the ROI (somatosensory cortex and the CA1, CA3, and dentate gyrus [DG]) of at least two slices from each animal with a Zeiss Observer microscope (Zeiss). Identical settings were used for the acquisition of all images from one experiment. The image calculator tool was used to identify colocalized c-Fos and NeuN from the previously thresholded images. Using the analyze particles function, the total number of colocalized c-Fos-positive neurons was measured from the thresholded images blind to genotype.
Seizure analysis
Animals were closely monitored for 1 h, and the number of seizure events per stage seizure severity score was recorded in 5 min bins. All scoring was performed blind to genotype or treatment. The maximum seizure stage reached in the 60 min trial was determined for each animal and entered into Prism 7 software (GraphPad) for statistical analysis. For maximum seizure score analysis: Stage I = 1 point, Stage II = 2 points, Stage III = 3 points, Stage IV= 4 points, and Stage V = 5 points. Graphs represent the mean maximum seizure stage ± SEM. For number of Stage III and Stage IV events, the total number of seizure stage events were counted, and the graphs represent the mean number of events ± SEM. For percentage of animals experiencing Stage III, IV, or IV events, for both Irf8+/+ and Ird8−/−, the number of animals with the stage events was divided by the total number of animals and the percentage depicted in the graphs with Fisher's exact statistical testing.
RNA ISH
For each section, 2 or 3 randomly chosen 63× FOVs within the CA1 were acquired on an Observer Spinning Disk Confocal microscope equipped with diode lasers (405, 488, 594, 647 nm) and Zen Blue acquisition software (Zeiss). Using the analyze particles function in ImageJ, the percent area of Fos RNA was measured from the thresholded images blind to genotype and condition.
Synapse density analyses
For assessing synapse density, two stained sections from each sample containing the hippocampus and somatosensory were imaged on a with a Zeiss Observer microscope (Zeiss) equipped with 405, 488, 555, and 639 nm lasers and Zen black acquisition software (Zeiss). For each section, 2 or 3 randomly chosen 63× FOVs within cortex layers 2/3, 4, and 5/6 and hippocampus CA1, CA3, and DG were acquired with three z stack steps at 0.22 µm spacing. Identical settings were used to acquire images from all samples within one experiment, and data analyses were performed blind using ImageJ (National Institutes of Health, version 1.52k) as described previously with minor modifications (Gunner et al. 2019; Werneburg et al. 2020). First, to determine a consistent threshold range, sample images for each genotype and condition were subjected to background subtraction, and then manual thresholding blinded to condition and genotype for each channel within one experiment was performed. Then, each channel from single z planes of the z stacks (3 z planes per animal) were subjected to the same background subtraction and thresholding, which was kept consistent for a given experiment. Using the analyze particles function, the total area of presynaptic inputs, postsynaptic compartments was measured from the thresholded images. To quantify the total area of structural synapses, the image calculator tool was first used to visualize colocalized presynaptic and postsynaptic puncta from the previously thresholded images. Then, the analyze particles function was used to calculate the total area of colocalized signals. Data from single planes were averaged for each z stack of each FOV, and the mean of all FOVs from 1 animal was determined to calculate densities.
Relative mRNA expression by qPCR
Relative mRNA expression of Fos and Tnf were determined using the δ CT method (https://pubmed.ncbi.nlm.nih.gov/11846609/) normalized to the housekeeping gene Gapdh. The RQ values for all samples were entered into Prism 7 software (GraphPad) and Student's t tests were performed comparing Irf8−/− expression (N = 3) to Irf8+/+ expression (N = 3).
EEG analysis
To analyze the EEG frequency bands, cortical EEG power spectra were computed for consecutive 4 s epochs within the frequency range of 0.5-50 Hz using an FFT routine. The data were collapsed into 0.5 Hz bins. For each epoch, power bins were summed in δ (0.5-3.5 Hz) theta (3.5-7.5 Hz), α (7.5-12.5 Hz), β (12.5-30 Hz), and γ (30-50Hz) power bands and expressed in fraction of epoch total power. Analysis was performed during both the light dark periods. For the response to PTZ, following a 15 min baseline EEG/EMG recording period, mice were injected with PTZ (60 mg/kg, i.p.) and EEG/EMG were recorded for an additional 115 min. Power bands were normalized to the 15 min baseline period. All analyses were performed blind to genotype.
Graphs and statistical tests were performed using Prism 7 software (Graph-Pad, La Jolla, CA, USA). Specific statistical tests are specified in the figure legends.
Results
Basal changes in several genes that impact neural activity in Irf8−/− brain
Transcriptomic studies of Irf8−/− brains have focused on microglial transcriptomes. We therefore performed bulk RNAseq on whole cortices and hippocampi of 2-month-old Irf8−/− and Irf8+/+ littermates to gain a more global understanding of changes in gene expression across multiple CNS cell types (Fig. 1A). Consistent with published data (Minten et al., 2012; Hagemeyer et al., 2016), there was a decrease in genes enriched in homeostatic, adult microglia, such as P2ry12 and Tmem119 (Fig. 1B) in Irf8−/− brains. Surprisingly, there were also transcriptional changes in several RNAs encoding for ion channels and proteins involved in synaptic function, such as Gabra6 and Gabrr2 in the Irf8-/cortex and Gabrr3, Kcnj5, Kcna10, Grin3a, Gria2, and Gabra3 in the Irf8-/hippocampus. Previous work has identified several genes that are differentially regulated in microglia purified from Irf8−/− (Hagemeyer et al., 2016). We therefore next subtracted out these microglia-enriched DEGs from our data set and performed further GO analysis on the remaining subset of genes (Fig. 1C–E). This analysis further revealed dysregulated calcium signaling and other ion channel activity in Irf8−/− brains. This led us to hypothesize that calcium-dependent gene transcription related to neural activity may be perturbed in the Irf8−/− brains. One key calcium and activity-dependent transcription factor in neurons is c-Fos. Indeed, we observed elevated Fos mRNA in the cortex and hippocampus by qPCR (Fig. 1F) and elevated c-Fos protein in Irf8−/− cortical and hippocampal neurons (Fig. 1G). Thus, along with dysregulation of several microglia-specific genes known to be regulated by IRF8, several genes involved in regulating neural excitability and synaptic function are dysregulated, even at baseline, in Irf8−/− brains.

Dysregulation of genes known to regulate neuronal and synaptic function in Irf8−/− cortex and hippocampus. A, Experimental design of the bulk RNAseq from microdissected P60 cortices (CX) and hippocampi (HP). B, DEGs (log2 fold change) in Irf8−/− cortex (left) and Irf8−/− hippocampus (middle), and Irf8−/− cortex/hippocampus combined by bulk RNAseq. DEGs were defined as ±1.25-fold. p ≤ 0.05. Select upregulated and downregulated genes are labeled. Green text indicates homeostatic microglia genes. Blue text indicates synaptic signaling/membrane potential-related genes. Gray text indicates other DEGs. C-E, DEGs in Irf8−/− microglia (Hagemeyer et al., 2016) were removed from bulk cortex and hippocampus RNAseq up and down lists. GO (molecular function) on cortex (C), hippocampus (D), and combined cortex and hippocampus (E) up (red) and down (blue) DEGs. F, The immediate early gene Fos is increased in P60 cortex (CX) and hippocampus (HP) by qPCR. Data are representative of one experiment; N = 3 mice per genotype. *p ≤ 0.05 (two-way ANOVA with Sidak multicomparison post hoc test). G, Representative immunofluorescence images of anti-c-Fos (green), and anti-NeuN (red) immunolabeling in the P60 cortex (CX) and in the hippocampus (DG, CA1, CA3) of 2-month-old Irf8+/+ and Irf8−/− brains. Scale bars, 20 µm. Quantification of c-Fos immunofluorescence is shown next to the representative images, demonstrating an increase in Irf8−/− brains. Data are representative of three independent experiments; N = 3 mice per genotype. *p ≤ 0.05; **p ≤ 0.01; Student's t test.
Irf8−/− mice have heightened susceptibility to more severe seizures
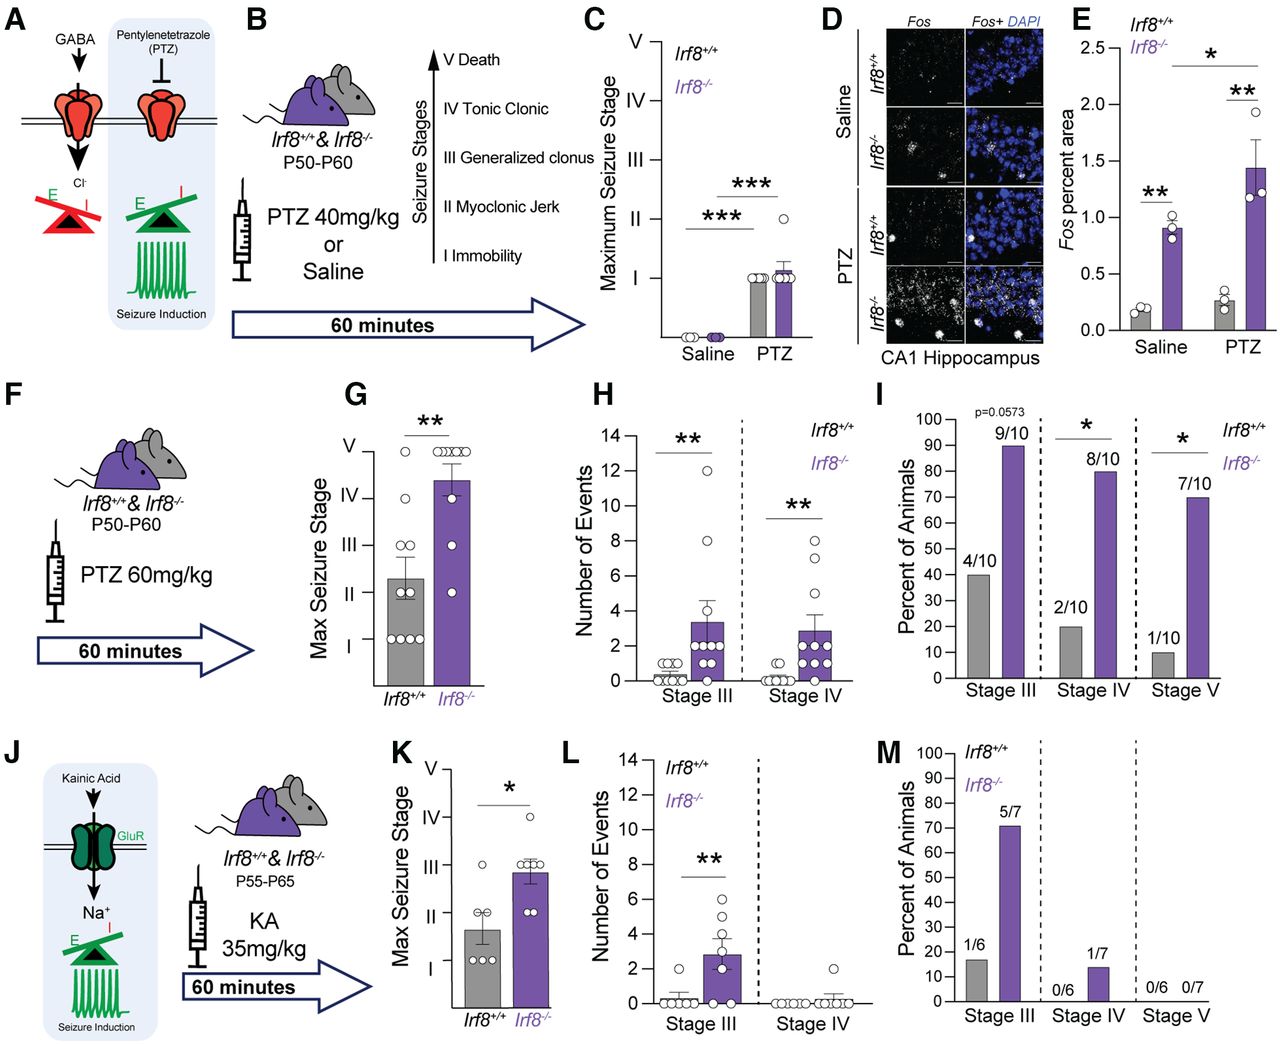
We next explored the functional significance of alterations in genes associated with regulation of neural circuit activity in Irf8−/− brains in vivo by assessing seizures. First, P50-P60 Irf8+/+ and Irf8−/− mice were challenged with the GABAA receptor antagonist PTZ (Fig. 2A). Seizure severity score was then evaluated over 60 min (Fig. 2B). Stage I and II seizures are least severe and include lethargy and myoclonic jerks, respectively. Stage III and IV are generalized events and include generalized clonus and tonic-clonic events, respectively. Stage V is the most severe and results in death. Upon administration of 40 mg/kg PTZ, Irf8−/− mice did not display differences in seizures compared with their Irf8+/+ littermates (Fig. 2C). However, when we harvested brain tissue from animals 60 min after receiving PTZ, Irf8−/− mice showed significantly increased Fos mRNA in the hippocampus relative to littermates, which was also observed basally (Fig. 2D,E). We next challenged P50-P60 Irf8−/− mice with a higher 60 mg/kg dose of PTZ (Fig. 2F). With this higher dose, Irf8−/− mice displayed significantly more severe seizures during the 60 min trial (Fig. 2G–I). This was evidenced by significantly higher max seizure stage scores (Fig. 2G), greater numbers of Stage III and IV seizures (Fig. 2H), and a higher percentage of animals with Stage IV and V seizures (Fig. 2I). Indeed, most Irf8−/− mice developed lethal tonic-clonic seizures within 60 min of receiving 60 mg/kg PTZ. Although less pronounced, susceptibility to more severe seizures was also observed in Irf8−/− mice on administration of the glutamate receptor agonist kainic acid (Fig. 2J–M). We also surgically implanted nonpenetrating EEG electrodes above the cortex and hippocampus (Fig. 3A) of 4-month-old mice to monitor basal activity over 24 hours and during PTZ-induced seizures. Consistent with no spontaneous seizures, Irf8−/− mice do not exhibit spontaneous epileptiform activity and spectral analysis revealed no differences in δ, theta, α, β, and γ power bands during the light or dark cycle periods (Fig. 3B). However, higher-frequency α, β, and γ power bands were significantly increased in Irf8−/− mice over littermate controls on administration of 60 mg/kg PTZ (Fig. 3C–E). This is consistent with other work supporting elevated seizure activity by EEG (Phelan et al., 2015; Lazzarotto et al., 2021). These in vivo seizure data were further supported by electrophysiology in P24-P44 hippocampal slices where application of the GABA receptor antagonist SR96631 (10 µm) resulted in a greater number of synchronous events in the first 15 min after being applied to Irf8−/− slices (Fig. 3F,G). Thus, IRF8 signaling is critical for regulating circuit stability and preventing lethal seizures on GABAergic blockade.

Elevated neuronal c-Fos and increased seizure severity in Irf8−/− mice. A, B, The GABAA receptor antagonist PTZ was given at 40 mg/kg, and seizure severity was subsequently scored over 60 min. C, Quantification of the maximum seizure stage reached in the 60 min trial in which P50-P60 Irf8+/+ and Irf8−/− animals injected with following 40 mg/kg PTZ (n = 6 animals per genotype) or saline (n = 3 animals per genotype). Data are representative of two experiments. ***p ≤ 0.001 (two-way ANOVA with Benjamini and Hochberg multiple-comparisons post hoc test). D, Representative images of RNAscope for Fos mRNA in the CA1 region of the hippocampus (D) of animals receiving 40 mg/kg PTZ or saline. Scale bar, 20 µm. E, Quantification of data in D, showing an increase in Fos in the CA1 in Irf8−/− mice in the absence and presence of PTZ. Data are representative of one experiment; N = 3 animals per genotype/condition, *p ≤ 0.05; **p ≤ 0.01; two-way ANOVA and Holm-Sidak's multiple-comparisons post hoc test. F, A higher dose of PTZ (60 mg/kg) was given, and then seizures were assessed over 60 min. G, I, Quantification of the maximum seizure stage (G), total number of events per seizure Stage III and IV (H), and percent of animals that reached each seizure Stage III-V (I) over the 60 min trial show increased susceptibility to more severe Stage III-V seizures in P50-P60 Irf8−/− animals compared with Irf8+/+ littermates. Data are representative of three independent experiments; N = 10 animals per genotype. G, ***p ≤ 0.001 (Student's t test). H, **p ≤ 0.01 (Mann–Whitney test). I, *p ≤ 0.05 (Fisher's exact test). Error bars indicate SEM. J, The glutamate receptor agonist kainic acid (KA, 35 mg/kg) was given, and the resulting seizure induction was assessed over 60 min in P55-P65 mice. K–M, Quantification of the maxium seizure stage (K), number of stage II and IV events (L) and percent of animals reaching stage III, IV, and V seizures (M) in the 60 min KA trial. Irf8−/− mice had significantly more severe seizures compared to littermate controls. Data are representative of one experiment; N = 6–7 mice per genotype. *p < 0.01, **p < 0.01 (Student's t test). Error bars indicate SEM.

Elevated activity of neurons on blockade of GABAergic transmission in Irf8−/− mice. A, Location of nonpenetrating EEG electrodes over the 4-month-old cortex and hippocampus. B, Over a 24 h baseline, there is no significant change in the fraction of total power in the light and dark cycles for the δ (0.5-3.5 Hz) theta (3.5-7.5 Hz), α (7.5-12.5 Hz), β (12.5-30 Hz), and γ (30-50 Hz) power bands. C, Representative EEG traces from 4-month-old Irf8+/+ and Irf8−/− animals in response to 60 mg/kg PTZ. Red dotted line indicates when PTZ was injected. A lethal seizure is noted in a Irf8−/−. D, The fraction of total power for δ, theta, α, β, and γ power bands in 1 min bins for Irf8+/+ (top) and Irf8−/− (bottom) animals before and after PTZ injection (black dotted line). E, Quantification reveals an increase in α, β, and γ power bands relative to Irf8+/+ littermate controls in response to PTZ. Data are representative of one experiment; N = 4 mice per genotype. **p ≤ 0.01 (two-way ANOVA with two-stage linear step-up procedure of Benjamini, Krieger, and Yekutieli multiple comparison post hoc test). Error bars indicate SEM. F, Whole-cell recordings from CA1 neurons (P24-P44). After 5 min baseline, the GABAA receptor antagonist (SR95531, 10 μm) was bath-applied to Irf8+/+ and Irf8−/− brain slices for 15 min. Bottom, Traces with synchronized activities. G, Quantification of the median number of synchronized events per animal. A greater number of synchronized events occurred in Irf8−/− versus Irf8+/+ slices. Data are mean ± SEM. Data are representative of 6 experiments/genotype; N = 6 or 7 animals per genotype. **p ≤ 0.01 (Mann–Whitney test).
Basal neurotransmission and synapse density are normal in Irf8−/− mice
Given the increase in c-Fos and seizures in Irf8−/− mice, we next tested whether basal neurotransmission was altered by whole-cell recordings in P21-P30 CA1 neurons. Surprisingly, we found no difference in resting membrane potential, membrane time constant, inward spontaneous postsynaptic current frequency or amplitude, action potential frequency following current injection in Irf8−/− CA1 (Fig. 4A–F). mIPSC and mEPSC amplitudes and frequencies were also unchanged in Irf8−/− CA1 (Fig. 4G–J). There was, however, a subtle but signficant shift in mEPSC amplitude cumulative probability in the Irf8−/− slices (Fig. 4K). Together with heightened excitability on GABAR blockade (Fig. 3F,G), it is possible that increased glutamatergic tone may be an underlying mechanism for the hyperexcitability phenotype in Irf8−/− mice.

Irf8−/− hippocampal CA1 slices display relatively normal basal glutamatergic transmission. A, B, Quantification of inward spontaneous PSC (sPSC) frequency (median Hz) (A) and amplitude (pA) (B). N = 11 Irf8+/+ and 12 Irf8−/− CA1 cells (A,B). C-E, Quantification of CA1 neuron intrinsic properties: resting membrane potential (median mV) (C), time constant (median ms) (D), and input resistance (median mΩ,) (E). N = 12 Irf+/+ and 12 Irf8−/− CA1 cells (C-E). F, Action potential frequency measurements as a function of increasing current. N = 12 Irf8+/+ and 12 Irf8−/− CA1 cells (F). G-J, Quantification of mIPSC and mEPSC frequency (G,I) and amplitude (H,J). N = 16 Irf8+/+ and N = 18 Irf8−/− CA1 cells (G,H). N = 17 Irf8+/+ and N = 16 Irf8−/− CA1 cells (I,J). K, The cumulative probability of the mEPSC amplitudes (pooled individual events from all the cells in J. N = 1321 events from 17 Irf8+/+ and 1171 events from 16 Irf8−/− CA1 cells (K). Mann–Whitney test (A-F,H,I), two-way ANOVA (G), Kolmogorov–Smirnov test (D) (J). p values are provided on each graph. All data are representative of three independent experiments/genotype. Error bars indicate SEM.
Another possible underpinning of heightened c-Fos and seizures in Irf8−/− mice is alterations in structural synaptic connectivity and, perhaps, increased excitatory synapses and/or decreased inhibitory synapses. We thus measured excitatory and inhibitory synapse density in the P50 somatosensory cortex and hippocampus of Irf8−/− mice compared with Irf8+/+ littermate controls. Using antibodies against vesicular glutamate transporters 1 and 2 (VGLUT1 and VGLUT2) to label excitatory presynaptic terminals and anti-HOMER1 to label excitatory postsynaptic membranes, we found no difference in synapse density (colocalized VGLUT1/HOMER1 or VLGUT2/HOMER1) in cortical layers 2/3, 4, or 5/6 of the Irf8−/− somatosensory cortex (Fig. 5A,B, top row, D,E). We also found no difference in excitatory synapse density within the DG, CA1, or CA3 regions of the Irf8−/− hippocampus (Fig. 5A,B, bottom row, D,E). Similarly, there was no change in inhibitory synapse density in Irf8−/− mice compared with Irf8+/+ littermate controls (Fig. 5C,F). These results indicate that there is no significant change in synapse density in Irf8−/− cortex or hippocampus. They also suggest that microglia-mediated synapse pruning, a function for microglia in the developing brain to regulate synapse numbers (Hong et al., 2016; Faust et al., 2021), proceeds normally in Irf8−/− mice. This is consistent with Irf8−/− transcriptomes, which retain expression of phagocytic genes (Fig. 1) (Hagemeyer et al., 2016) and previous work showing that Irf8−/− macrophages phagocytose normally (Minten et al., 2012).

IRF8-dependent microglial maturation is dispensable for developmental synapse pruning. A-C, Representative immunofluorescence images of excitatory (A,B) or inhibitory synapses (C) in the P50 somatosensory cortex (top) or CA3 region of the hippocampus (bottom). A, B, Excitatory synapses were immunolabeled with the presynaptic marker anti-VGLUT1 (left, green), anti-VGLUT2 (middle, green), and the postsynaptic marker Homer1 (red). C, Inhibitory synapses were immunolabeled with the presynaptic marker anti-VGAT. Scale bars, 10 μm. D-F, Quantification of the percent area VGLUT1 colocalized with Homer1 (D), VGLUT2 colocalized with Homer1 (E), and percent area VGAT (F) in cortical layers 2/3, 4, and 5/6 of somatosensory cortex and CA1, CA3, and DG regions of hippocampus. Data are representative of two independent experiments; N = 4 mice per genotype. NS, Not significant by two-way ANOVA and Sidak post hoc test. Error bars indicate SEM.
TNF-α is elevated in microglia in the Irf8−/− brain
As there was no change in basal neurotransmission or synapse density in Irf8−/− hippocampi and cortices, we performed further GO analysis on our RNAseq dataset (Fig. 6A–F) and assessed all the DEGs across all cell types from the cortex, hippocampus, and combined cortex/hippocampus datasets. One of the top GO terms in Irf8−/− cortical and hippocampal transcriptomes was TNF production (Fig. 6A–C,G). Tnf, the gene encoding for TNF-α, was particularly intriguing as it has been shown to regulate synaptic scaling (Stellwagen and Malenka, 2006; Pribiag and Stellwagen, 2013; Lewitus et al., 2016), TNF-α derived from microglia underlies heightened neural excitability on inflammation in the cerebellum (Yamamoto et al., 2019), and it has been implicated in regulating astrocytic-mediated regulation of neural excitability in the hippocampus (Habbas et al., 2015). We thus validated that Tnf expression was elevated in Irf8−/− cortex and hippocampus by qPCR (Fig. 6H) and TNF-α was elevated at the protein level in both Irf8−/− cortex and hippocampus using an ELISA-based assay (Fig. 6I). Interestingly, other neuroactive cytokines Il1b and Il6 were also elevated in our transcriptomic dataset, but IL-1β protein was only elevated in the Irf8−/− cortex and not the hippocampus (Fig. 6J). IL-6 protein was unchanged in the Irf8−/− cortex and hippocampus relative to Irf8+/+ littermate controls (Fig. 6K). These data identify that, among other pro-inflammatory cytokines that are changed in Irf8−/− brain transcriptomes, TNF-α protein is the most significantly elevated across multiple brain regions.

TNF-α is elevated in Irf8−/− brains. A-F, GO Biological process on up (A-C) and down (D-F) DEGs in cortex, hippocampus, and combined cortex and hippocampus. G, Heatmap of z scores for genes in the TNF-α production pathway (GO:0032640). H, Quantification of relative Tnf by qPCR from mRNA isolated from bulk cortex and hippocampus. Data are representative of one experiment; N = 3 animals per genotype. **p ≤ 0.01 (Student's t test). I, There is a significant increase in total TNF-α protein levels in the P60 cortex (CX) and hippocampus (HP) of Irf8−/− mice as measured by multiplex immunoassay. J, K, Concentrations of neuroactive cytokines IL-1β (J) and IL-6 (K) from P60 Irf8+/+ and Irf8−/− cortex (CX) and hippocampus (HP) protein lysates. Data are representative of one experiment; N = 3-5 animals per genotype. *p ≤ 0.05; **p ≤ 0.01; ***p ≤ 0.001; Student's t test. Error bars indicate SEM.
As our bulk sequencing was from whole hippocampus and cortex, we next sought to identify the cellular source of elevated TNF-α in Irf8−/− brains by spatial transcriptomics. For these analyses, we performed MERFISH (Chen et al., 2015) (Fig. 7). In our probe library, we included RNA probes for all major CNS cell type identity genes, and we identified each cell type was localized to the appropriate brain regions (Fig. 7B,C,E) and bio replicates were equally distributed across cell clusters for each genotype (Fig. 7D). We further included MERFISH probes against Irf8 and Tnf, the genes encoding for IRF8 and TNF-α, in our library. After assessing Irf8 and Tnf expression across all CNS cell types in Irf8−/− versus Irf8+/+, we confirmed that Irf8 expression was specific to microglia (Fig. 7E, red text). In contrast, Tnf is expressed by multiple CNS cell types in both genotypes. However, Tnf is only increased in microglia in the Irf8−/− brain (Fig. 7F,G). We further validated this finding by showing that Tnf mRNA is increased in microglia isolated from the Irf8−/− brains (Fig. 7H). At the protein level, cultured Irf8−/− microglia also release significantly more TNF-α compared with Irf8+/+ microglia cultures (Fig. 7I). Together, these data demonstrate that microglia are the likely cellular source for elevated TNF-α in Irf8−/− brains.

Spatial transcriptomics reveal that Tnf is increased in Irf8−/− microglia. A, Schematic of MERFISH technique. B, C, Spatial distribution across a representative Irf8+/+ brain section (B) and Uniform Manifold Approximation and Projection (UMAP, C) of all identified cell types in Irf8+/+ and Irf8−/−. Individual cells colored by cell type (shown in E). D, Distribution of all identified cells across biological replicates for Irf8+/+ (left) and Irf8-/(right) shows uniform distribution. E, Dot plot of canonical cell type markers across identified cell types. Irf8 (red) is specific to microglia. OPC, Oligodendrocyte precursor cells; NSC, neural stem cells; Inhib., inhibitory; N., neuron; MSNs, medium spiny neurons; Thal., thalamus; Hypothal., hypothalamus; Retic., reticular; L, layer; CX, cortex. F, Dot plot of Tnf expression across identified cell types in Irf8+/+ (top row) and Irf8−/− (bottom row) samples. Arrow indicates microglial Tnf expression. G, Graph of average Tnf expression/cell versus percentage of cells expressing Tnf for each cell type in Irf8+/+ (gray) versus Irf8−/− (purple) samples. Dotted lines connect Irf8+/+ and Irf8−/− data points for each cell type. Blue-shaded oval represents data points corresponding to microglia. MERFISH data are representative of three experiments; N = 3 mice per genotype. H, Tnf mRNA expression is elevated in microglia acutely isolated from Irf8−/− brains. Data are representative of three experiments/genotype; N = 3 mice per genotype. **p ≤ 0.01 (Student's t test). I, Basal TNF-α secretion was increased from cultured Irf8−/− microglia. Data are representative of two independent experiments; N = 3 mice per genotype. **p ≤ 0.01 (Student's t test). Error bars indicate SEM.
Elevated brain-derived TNF-α underlies lethal hyperexcitability in Irf8−/− mice
Following LPS-induced inflammation, TNF-α has been shown to drive hyperexcitability in the cerebellum (Yamamoto et al., 2019). Therefore, we next tested whether TNF-α was responsible for driving the hyperexcitability phenotype in Irf8−/− mice. We first crossed Irf8−/− mice to animals deficient in the TNF receptors 1 and 2 (Irf8−/−, Tnfrsfab−/−), which disrupts TNF-α signaling constitutively (Fig. 8A). Using the same PTZ-induced seizure model, we found a striking attenuation of Stage V lethal seizures when TNFR signaling was eliminated from Irf8−/− mice (Irf8−/−; Tnfrsab−/−) (Fig. 8D,E). To assess whether these effects were developmental in origin or because of acute exposure to elevated TNF-α, we next took a pharmacological approach and acutely blocked TNF-α using a BBB-permeable TNF-α inhibitor (Fig. 8B) (Chang et al., 2017). Following a 24 h pretreatment with the TNF-α inhibitor, we performed the same PTZ-induced seizure paradigm. Similar to Irf8−/−; Tnfrsfab−/− mice, we found significant protection from Stage V lethal seizures on acute TNF-α inhibition (Fig. 8F,G). As another cytokine that was elevated in Irf8−/− mice was IL-1β, we also tested the role of this cytokine in elevated seizures in the Irf8−/− mice. However, pharmacological inhibition of IL-1β signaling with a BBB-permeable interleukin 1 receptor antagonist (IL-1Ra, Fig. 8C) did not attenuate seizures in Irf8−/− mice (Fig. 8H,I). Finally, it is still possible that elevated TNF-α in Irf8−/− is from the periphery. Arguing against this, we found no evidence of fibrinogen deposition, an indicator of BBB integrity, in the CNS parenchyma (Fig. 9A) (Davalos et al., 2012; Ryu et al., 2015; Mendiola et al., 2016; Petersen et al., 2018; Merlini et al., 2019). We then injected a separate cohort of mice with a BBB-impermeable TNF-α inhibitor etanercept, which is known to inhibit peripheral TNF-α in mice (Fig. 9B) (Boado et al., 2010; Karamita et al., 2017) and found no attenuation of seizures in Irf8−/− mice (Fig. 9C,D). These results indicate the following: (1) TNF-α is the underlying mechanism leading to elevated lethal seizures in Irf8−/− mice; (2) effects of elevated TNF-α on circuit excitability are acute and not developmental; and (3) TNF-α from the CNS, and not the periphery, is leading to heightened seizures.

TNF-α within neural circuits underlies the PTZ-induced seizure lethality in Irf8−/− mice. A-D, The strategy for blocking TNF-α and IL-1β. TNF receptor 1 and 2 KOs (Tnfrsfab−/−) were crossed to Irf8−/− mice (A), a BBB-permeable TNF-α inhibitor (cTfRMAb-TNFR fusion protein, TNFi) (B), or the interleukin-1 receptor antagonist (IL-1Ra) anakinra (C) was injected 24 h before PTZ. All animals were injected with PTZ and assessed for seizure behavior over a 60 min trial. D-I, Quantification of the maximum seizure stage reached by each animal (D,F,H), and the frequency distribution of each seizure stage (E,G,I) on 60 mg/kg PTZ injection to P50-P60. Irf8−/− mice lacking TNF receptors (Irf8−/−; Tnfrsfab−/−) (A,D,E) and mice that received a BBB-permeable TNFi 24 h before PTZ (B,F,G) were significantly protected from lethal Stage V seizures. Data are representative of three experiments; N = 10-14 animals per genotype for D, E and N = 8-10 for F, G. *p ≤ 0.05; **p ≤ 0.01; two-way ANOVA with Benjamini and Hochberg multiple-comparisons post hoc test. C, H, I, In contrast, mice that received an IL-1Ra 24 h before PTZ were not protected from lethal Stage V seizures. Data are representative of two independent experiments; N = 8-10 animals per genotype. NS=Not significant; ***p ≤ 0.001; ****p ≤ 0.0001; two-way ANOVA with Benjamini and Hochberg post hoc test (F,H). Error bars indicate SEM.

Peripheral TNF-α does not attenuate PTZ-induced seizure lethality in Irf8−/−. A, Representative immunofluorescence images of fibrinogen (red) immunostaining in the cortex and hippocampus of Irf8+/+ and Irf8−/− animals injected with saline or PTZ. Scale bar, 100 µm. Data are representative of one experiment; N = 3 animals. B, The strategy for blocking peripheral TNF-α with the BBB-impermeable inhibitor (Periph.) etanercept injected 24 h before PTZ. C, D, Quantification of the maximum seizure stage reached by each animal (C), and the frequency distribution of each seizure stage (D). Injection of the BBB-impermeable TNF inhibitor (TNFi) did not block Stage V seizures. Data are representative of two independent experiments. N = 5-9 animals per genotype. NS=Not significant; ***p ≤ 0.001; ****p ≤ 0.0001; two-way ANOVA with Benjamini and Hochberg post hoc test (C). Error bars indicate SEM.
Discussion
IRF8 is known to regulate the homeostatic and inflammatory phenotypes of microglia. But the impact of loss of IRF8 signaling in either microglia or other CNS cell types on neuronal function is unknown. This becomes increasingly important as mutations in IRF8 have been identified in MS and lupus (De Jager et al., 2009, 2011; Cunninghame Graham et al., 2011) and downregulation of IRF8 has now been shown in schizophrenia (Snijders et al., 2021). Here, we identify that IRF8 is critical to achieve neural circuit homeostasis. While basal neurotransmission and synapse numbers are normal, loss of IRF8 results in heightened excitability as evidenced by elevated neuronal c-Fos and heightened susceptibility to more severe seizures. The seizure phenotype is largely dependent on the neuroactive cytokine TNF-α, which could have profound consequences for a variety of neurologic disorders with documented increases in TNF-α and seizures (Frankola et al., 2011; Cheng et al., 2014; Theoharides et al., 2016; Jung et al., 2019; Heir and Stellwagen, 2020).
Elevated c-Fos and seizures in Irf8−/− mice
One of the most striking phenotypes in Irf8−/− mice was heightened sensitivity to more severe seizures on injection of chemoconvulsants. EEG recordings during PTZ-induced seizures show that Irf8−/− mice show elevated high-frequency power, which results in continuous epileptiform activity over the observed period (Phelan et al., 2015; Maheshwari et al., 2016; Lazzarotto et al., 2021) compared with Irf8+/+ mice. This points to a critical role for IRF8 signaling in maintaining circuit stability and preventing seizure progression. This seizure phenotype was coincident with a significant elevation in Fos mRNA and c-Fos protein in Irf8−/− hippocampi and cortices. Despite these changes, basal synaptic transmission was relatively normal in Irf8−/− mice. Also, Irf8−/− mice did not display spontaneous seizures by EEG. These data indicate that Irf8−/− neural circuits exist in a state that is more susceptible to lethal hyperexcitability on an excitatory stimulus. While there was a subtle but significant shift in mEPSC amplitude cumulative probability in Irf8−/− CA1 hippocampal slices and on GABAR blockade, there is elevated activity in Irf8−/− brains. This suggests dysregulation of glutamatergic signaling. But it is also important to consider that GABAergic signaling could also be dysfunctional and the electrophysiological underpinnings of heightened basal c-Fos remain to be fully deciphered. It is possible that, similar to LPS in the cerebellum (Yamamoto et al., 2019), SK channels are affected, although our RNAseq data suggest otherwise. Alternatively, the elevated c-Fos may not result from increased synaptic transmission but a parallel activation pathway, such as cell stress. In addition, all of our electrophysiological recordings were performed in the CA1 region of the hippocampus. Therefore, changes in basal neurotransmission and synapse numbers could be detected elsewhere in the brain (e.g., striatum or cortex), which we did not measure. A shift in homeostatic scaling is also a likely possibility as this is a known function for TNF-α (Stellwagen and Malenka, 2006; Heir and Stellwagen, 2020).
TNF-α is a critical modulator of neural circuit excitability and seizures
Strikingly, we were able to rescue Irf8−/− mice from lethal seizures by targeting the neuroactive cytokine TNF-α with genetic ablation of TNFR1/2 or pharmacological inhibition with a BBB-permeable TNF-α inhibitor. This is consistent with previous work showing that elevated TNF-α induces hyperexcitability in the cerebellum following LPS administration. In contrast, there is other work suggesting that TNF-α can inhibit seizures on direct injection of TNF-α into the hippocampus (Balosso et al., 2005). However, this seems to depend on the TNFR. TNF-α binding to TNFR1 promotes seizure induction, while binding to TNFR2 does the opposite (Weinberg et al., 2013). We blocked both TNFRs in the current study. In light of this published work, it is likely through a TNFR1-dependent mechanism. In our model, it also remains to be determined precisely how TNF-α/TNFR signaling is driving these effects on hyperexcitability. One potential mechanism is through post-translational regulation of the trafficking of neurotransmitter receptors to and away from synapses to maintain stable circuit activity (i.e., homeostatic synaptic scaling). Previous studies found that TNF-α influences AMPA and GABA receptor trafficking in a brain region and context-dependent manner (Stellwagen and Malenka, 2006; Pribiag and Stellwagen, 2013; Lewitus et al., 2016). Basal glutamatergic neurotransmission was relatively normal, except for a modest shift in mEPSC amplitude cumulative probability. However, there may be changes in other brain regions that we did not record from. Another possibility is that TNF-α signals to astrocytes through TNF-α receptors. In turn, this induces astrocytes to modulate synaptic function. Indeed, previous work has shown that changes in TNF-α levels result in long-lasting increases in NMDAR-mediated neuronal excitability through astrocytic TNFR1 (Habbas et al., 2015). Also, while blocking TNF-α signaling attenuated lethal Stage V seizures, Stage IV seizures still developed. Therefore, it is also intriguing to consider the effects of other microglia-derived factors that are changed in the Irf8−/− brains, which could work in concert with TNF-α. Interestingly, while IL-1β has been implicated in regulating synaptic function and seizures (Liu and Quan, 2018; Soltani Khaboushan et al., 2022) and it is increased in Irf8−/− brains, IL-1β signaling blockade did not attenuate seizures in our experiments. Alternatively, Irf8−/− microglia also have significantly lower P2ry12 expression compared with WT littermates, and previous work has shown that ablating P2RY12, as well as inhibition of Gi-dependent microglial dynamics, increases neural excitability (Eyo et al., 2014; Mo et al., 2019; Badimon et al., 2020; Merlini et al., 2021). While reducing TNF-α may protect against lethality, aberrant purinergic signaling or other cytokines may drive the remaining Stage IV seizures in Irf8−/− mice.
IRF8 and TNF-α: important implications for disease
There is increasing evidence that cytokines act as neuromodulators in neural circuits and perturbations in cytokine levels are a common feature of neurologic diseases (Werneburg et al., 2017). Under conditions of excess TNF-α, our data demonstrate a predisposition toward increased neuronal excitability and more severe seizures. As seizures and elevated cytokines, including TNF-α, are common in many neurologic disorders from autism to Alzheimer's disease, these data have therapeutic implications (Frankola et al., 2011; Cheng et al., 2014; El Achkar and Spence, 2015; Theoharides et al., 2016; Spatola and Dalmau, 2017; Vossel et al., 2017; Asadollahi et al., 2019; Jung et al., 2019; Besag and Vasey, 2020; Heir and Stellwagen, 2020).
In addition to TNF-α, our data also identify that loss of IRF8 also impacts neuronal gene expression and function. This is likely indirect through microglia as Irf8 is enriched in microglia in the CNS. Genetic variants in Irf8 are known to confer genetic risk to developing MS and lupus (De Jager et al., 2009, 2011; Cunninghame Graham et al., 2011). While these effects likely involve IRF8-dependent regulation of peripheral immune cells (Yoshida et al., 2014), it is intriguing to consider additional effects on circuits through changes in IRF8 function in microglia and/or other resident CNS cell types. It is also important to consider that microglial genes found in pathologic conditions, particularly neurodevelopmental disorders, may not only result from homoeostatic microglia shifting toward a more pro-inflammatory state, they may also result from impaired maturation of microglia, such as in Irf8−/− mice. Indeed, this is supported by a recent study in schizophrenia showing that many genes regulating microglial maturation, including Irf8, are decreased in microglia in schizophrenia brains (Snijders et al., 2021).
In conclusion, we show that IRF8 deletion results in a profound elevation in neural circuit excitability and seizure severity via elevated TNF-α within neural circuits, which is likely largely microglia-derived. This adds to the current body of literature that TNF-α, as well as other neuroactive cytokines, act as neuromodulators and impact circuit function. Our data further lay the important groundwork for understanding how IRF8 signaling impacts neural circuits more directly in a variety of neurologic diseases where IRF8 and TNF-α have been implicated and changes in these molecules occur concomitant with heightened seizures.
Footnotes
This work was supported by National Institute of Mental Health R01MH113743 to D.P.S., National Institute on Aging RF1AG068281 to D.P.S., Massachusetts Life Sciences Center to D.P.S., Brain and Behavior Research Foundation National Alliance for Research on Schizophrenia and Depression to D.P.S.; Autism Speaks Weatherstone Predoctoral Fellowship 11779 to P.A.F.; National Institute on Aging R01AG062840 to R.K.S. and National Institute on Aging R01AG072896 to R.K.S.; R01NS119597 to C.A., National Institute of Mental Health MH103399 to C.A., Coins for Alzheimer's Disease Research to C.A., Citizens United for Research in Epilepsy to C.A., and BrightFocus Foundation A2020321S to C.A.; and Natural Sciences and Engineering Research Council of Canada to D.S. We thank Dr. Marco Prinz for sending us the Irf8–/– mice, which were originally made by Holtschke et al. (1996).
The authors declare no competing financial interests.
- Correspondence should be addressed to Dorothy P. Schafer at dorothy.schafer{at}umassmed.edu


