

Abstract
Neuronal coherence is thought to be a fundamental mechanism of communication in the brain, where synchronized field potentials coordinate synaptic and spiking events to support plasticity and learning. Although the spread of field potentials has garnered great interest, little is known about the spatial reach of phase synchronization, or neuronal coherence. Functional connectivity between different brain regions is known to occur across long distances, but the locality of synchronization across the neocortex is understudied. Here we used simultaneous recordings from electrocorticography (ECoG) grids and high-density microelectrode arrays to estimate the spatial reach of neuronal coherence and spike-field coherence (SFC) across frontal, temporal, and occipital cortices during cognitive tasks in humans. We observed the strongest coherence within a 2–3 cm distance from the microelectrode arrays, potentially defining an effective range for local communication. This range was relatively consistent across brain regions, spectral frequencies, and cognitive tasks. The magnitude of coherence showed power law decay with increasing distance from the microelectrode arrays, where the highest coherence occurred between ECoG contacts, followed by coherence between ECoG and deep cortical local field potential (LFP), and then SFC (i.e., ECoG > LFP > SFC). The spectral frequency of coherence also affected its magnitude. Alpha coherence (8–14 Hz) was generally higher than other frequencies for signals nearest the microelectrode arrays, whereas delta coherence (1–3 Hz) was higher for signals that were farther away. Action potentials in all brain regions were most coherent with the phase of alpha oscillations, which suggests that alpha waves could play a larger, more spatially local role in spike timing than other frequencies. These findings provide a deeper understanding of the spatial and spectral dynamics of neuronal synchronization, further advancing knowledge about how activity propagates across the human brain.
SIGNIFICANCE STATEMENT Coherence is theorized to facilitate information transfer across cerebral space by providing a convenient electrophysiological mechanism to modulate membrane potentials in spatiotemporally complex patterns. Our work uses a multiscale approach to evaluate the spatial reach of phase coherence and spike-field coherence during cognitive tasks in humans. Locally, coherence can reach up to 3 cm around a given area of neocortex. The spectral properties of coherence revealed that alpha phase-field and spike-field coherence were higher within ranges <2 cm, whereas lower-frequency delta coherence was higher for contacts farther away. Spatiotemporally shared information (i.e., coherence) across neocortex seems to reach farther than field potentials alone.
Introduction
The human brain can remarkably extract rich sensory information from the outside world and quickly integrate it with higher-order cognitive processes. Abilities such as controlled decision-making, speech perception, and social interaction all require interactions between spatially distributed action potentials and neural oscillations across the brain (Meunier et al., 2009; Perlovsky, 2013; Smith et al., 2019). Field potentials (FPs) are the electric fields of the brain, reflecting transmembrane currents within neural tissue (Eccles, 1951; Mitzdorf, 1985; Womelsdorf et al., 2007; Galindo-Leon and Liu, 2010; Buzsáki et al., 2012; Kajikawa and Schroeder, 2015). The spatial spread of FPs has become of great interest in neuroscience because of its fundamental influence on neural computations and behavior (Katzner et al., 2009; Xing et al., 2009; Kajikawa and Schroeder, 2011; Lindén et al., 2011). FPs can be measured with surface electrodes or intraparenchymal probes, but the material, spacing, and impedance of the electrodes can potentially affect the estimated spatial extent (Lee et al., 2005; Buzsáki et al., 2012; Dubey and Ray, 2019). Previous studies have shown that FPs can be confined to very small domains (200–400 µm) under tightly controlled conditions, such as when stimuli are confined to single-unit receptive fields in anesthetized monkeys (Xing et al., 2009). When stimuli are embedded in complex naturalistic scenes that excite ensembles of neurons in awake monkeys, FPs can reach many millimeters and even centimeters from a current source (Kajikawa and Schroeder, 2011; Dubey and Ray, 2019). During epileptic seizures, multiunit spiking activity can organize into low-frequency oscillations detectable within 10 cm from the onset zone (Eissa et al., 2017). Thus, there is evidence to suggest that FPs may reach much farther than would normally be considered “local.” Empirical and computational models suggest that spatial reach can also vary with frequency, synaptic distribution, and neuronal morphology (Rasch et al., 2008; Lindén et al., 2011; Leski et al., 2013; Kajikawa and Schroeder, 2015; Dubey and Ray, 2016).
The phase of FPs has been linked to cognitive processes such as perception, attention, and decision-making (Lakatos et al., 2005, 2007; Womelsdorf and Fries, 2006; Busch et al., 2009; Mathewson et al., 2009; Bosman et al., 2012; Neuling et al., 2012; Solomon et al., 2017; Leszczynski and Schroeder, 2019; Tal et al., 2020). Coherent FPs can facilitate the transfer of information across shorter and longer distances (Lachaux et al., 1999; Rodriguez et al., 1999; Varela et al., 2001; Fries, 2005; Liebe et al., 2012; Helfrich and Knight, 2016). Neuronal coherence has been shown to support higher-order cognitive processes (Lachaux et al., 1999; Rodriguez et al., 1999; Varela et al., 2001; Benchenane et al., 2010; Oehrn et al., 2014; Fries, 2015). Therefore, measuring the spatial reach of coherence is an important step toward understanding the nature of rhythmic information flow across the brain.
We had a rare opportunity to measure both superficial and deep cortical FPs from simultaneous electrocorticography (ECoG) and microelectrode array (MEA) recordings in three human neurosurgical patients undergoing intracranial epilepsy monitoring. The MEAs allowed us to measure action potentials from nearly 500 neurons, most likely located in layers 4/5 (Schevon et al., 2012). Our primary goal was to estimate the spatial reach of surface and depth FP coherence and spike-field coherence (SFC) in the human neocortex. Another key goal was to determine how the properties of coherence might change based on oscillatory frequency and distance from the MEA. We hypothesized that coherence would decrease with distance from the point of origin, and that the frequencies of highest coherence would vary with tissue depth (i.e., superficial ECoG vs intracortical FP).
Materials and Methods
Subjects.
Three neurosurgical patients (three males; mean age, 28 years of age) with medically refractory epilepsy underwent craniotomies for the placement of subdural ECoG grids in frontocentral cortex (subject A), middle temporal cortex (subject B), and posterior temporal cortex (subject C). Decisions regarding the location and coverage of the ECoG arrays were based solely on clinical criteria. A 96-channel Utah MEA (UMA) was placed underneath the ECoG grid for the purpose of recording seizures. The Columbia University Medical Center Institutional Review Board approved the placement of these Food and Drug Administration-approved research electrodes in regions that are likely to be part of the eventual resection (IRB-AAAB6324). All patients provided informed consent before participating in the study.
Electrophysiological recordings and preprocessing.
The ECoG and the UMA data were recorded from the frontal cortex, the middle temporal cortex, and posterior temporal cortex. A neural signal processor (Blackrock Microsystems) simultaneously acquired the ECoG and UMA data, which were amplified, bandpass filtered (0.3 Hz–7.5 kHz), and digitized at 2 and 30 kHz, respectively. All ECoG data were rereferenced into a bipolar montage. Similarly, bipolar derivations from the UMA were used as a representation of deep cortical field potentials. Behavioral trials that contained epileptiform discharges were removed based on visual inspection and/or aberrant voltage deflections (in microvolts) >5 SDs across trials.
Time–frequency decomposition and neuronal coherence.
Field potential spectra were computed via fast Fourier transform with a Hanning window taper (window size, 256 ms) using EEGLAB functions and custom code written in MATLAB (Delorme and Makeig, 2004). The frequency bands of interest were delta (1–3 Hz), theta (4–7 Hz), alpha (8–14 Hz), beta (15–30 Hz), and gamma (31–50 Hz) signals. Instantaneous FP phase was extracted by taking the angle between the real and imaginary components of the spectral decompositions. As a measure of neuronal coherence, we used the phase lag index (PLI), which represents the consistency of nonzero phase-angle differences between two time series (Stam et al., 2007). The PLI is computed as
Action potential sorting.
Single-unit activity data were thresholded at less than four times the root mean square of the high-pass-filtered signal (>250 Hz). The action potential waveforms were then separated based on t-distribution expectation maximization computed on a feature space composed of the first three principal components (Shoham et al., 2003), using Offline Sorter (Plexon). Spike sorting yielded well isolated neurons from the frontocentral cortex (n = 100), middle temporal cortex (n = 191), and posterior temporal cortex (n = 206).
Spike-field coherence.
SFC was computed via multitaper approach using the Chronux toolbox for MATLAB (Mitra and Pesaran, 1999). The SFC computation included a 10 ms step size, a time–bandwidth product of five, and a sequence of nine discrete prolate spheroidal tapers. Multitaper approaches have been shown to improve consecutive spectral estimates, which is useful for SFC analyses (Hoogenboom et al., 2006). The multitaper estimate of the spectrum of a spike train can be calculated as
Spatial distance modeling.
Coherence (PLI or SFC) was modeled as a function of Euclidean distance (in millimeters) between the ECoG contact closest to the MEA and all other ECoG contacts on the grid. The MEA location was chosen as the origin point for the distance calculations because it allowed for comparing the lateral spread of ECoG-field, deep cortical-field, and spike-field coherence across the same geometric space. The three-dimensional coordinates for all contacts were extracted via coregistration of preoperative structural MRI with postoperative computed tomography images using the Statistical Parametric Mapping (SPM) Toolbox. A single power function was fit to the mean coherence values for the distance from the origin of each channel. The general form of the function is given by,
Cognitive control task.
The first subject (A) had frontocentral ECoG coverage and performed three sessions of the multisource interference task (MSIT; Bush and Shin, 2006). MSIT combines two different types of conflict associated with cognitive control, known as “spatial” and “distractor” conflict. Each trial began with a 500 ms visual fixation period, followed by a cue that consisted of three numbers that ranged from 0 to 3 (white color, black background). The “target” number was one of the three numbers that was different from the other two distractor numbers. Patient 1 used a three-button response pad to indicate which number was the target (number 1, left-hand button; number 2, middle button; number 3, right-hand button). Spatial conflict occurred if the target number was in a different position than its representation on the response pad (e.g., “3 0 0”; the target is in the left-hand position, but the right-hand button is the correct choice). Distractor conflict occurred if the distractor numbers were possible button choices (e.g., “1 3 1,” where “1” corresponds to a possible button choice). Some trials contained neither type of conflict (e.g., “0 2 0”), whereas others contained both conflict types (e.g., “2 1 1”). After the patient responded on each trial, the cue disappeared, and feedback appeared with variable delay (300–800 ms). In blocks of 10 trials, the feedback consisted of the target number in a different color (green for correct, red for incorrect), alternating with neutral feedback that was blue, regardless of accuracy. The intertrial interval varied uniformly randomly between 1000 and 1500 ms. Across three sessions, patient 1 performed 713 trials. To maintain the simultaneity of the single-unit recordings across patients, SFC data were used only for the first session, which was composed of 295 trials. All neural data for this task were epoched from 500 ms before until 1500 ms after the time of cue onset.
Speech perception task.
Subject B had middle temporal ECoG coverage and listened to a series of audio clips of male and female voice actors, where both voice actors read different stories at the same time. The audio clips were played from a single device in front of the subject (SoundLink Mini, Bose). The task was split into four blocks, where the subject was asked to attend to either the male or female speaker, alternating between each block. During intermittent pauses, the subject was asked to repeat the last sentence of the attended speaker. The neural data were epoched from 1000 ms before until 5000 ms after the time of stimulus onset.
Social cognition task.
Subject C had posterior temporal ECoG coverage and watched several repetitions of 18 unique video clips from popular films (e.g., “Girls Trip,” “Split,” “Get Out,” and “The Hours”) in which a salient emotion was displayed, and a full sentence was spoken (e.g., “the chores have become my sanctuary”). Each trial began with a visual fixation period (500 ms), followed by the video clip. The neural data were epoched from 1000 ms before until 5000 ms after the time of video onset.
Quantification and statistical analysis.
All curve-fitting procedures were performed in MATLAB (MathWorks). All group-level statistical analyses were performed in SPSS (IBM). Mixed ANOVAs were used throughout, which used a 3 (subject: A, B, C) × 2 (distance: proximal, distal) × 3 (depth: surface, surface depth, SFC) × 5 (frequency: delta, theta, alpha, beta, gamma) design. Bonferroni correction was used to correct for multiple comparisons, and the Greenhouse–Geiser method was used to adjust the degrees of freedom when sphericity assumptions were violated. Violin plots represent probability density estimates of coherence for each frequency band. Probability density was estimated using kernel density estimation via the “ksdensity” function in MATLAB. Correlations between neuronal coherence and spectral power were computed using Pearson's r. Statistical tests used in this study are also described in the figure legends.
Results
We measured neural synchronization between field potentials using data from three neurosurgical patients who underwent seizure monitoring for drug-resistant epilepsy. Each patient had subdural ECoG grids placed in a different brain region, along with a Utah microelectrode array to simultaneously record action potentials from a total of 497 neurons, as well as deep cortical FPs. The brain regions covered were the frontocentral cortex (8 × 8 contacts, 0.5 cm spacing; 100 single units), middle temporal cortex (8 × 8 contacts, 1 cm spacing; 191 single units), and posterior temporal/occipital cortex (8 × 3 contacts, 1 cm spacing; 206 single units; Figs. 1, 2). The subject with frontocentral grid coverage (subject A) performed a controlled decision-making task, the subject with middle/superior temporal coverage (subject B) performed a speech perception task, and the subject with posterior temporal/occipital coverage (subject C) performed a social cognition task. Each task was intended to evoke some degree of region-specific activity (for task descriptions, see Materials and Methods).

ECoG Grids and microelectrode arrays. A–C, Each subject had a subdural ECoG grid placed in the frontocentral (A; subject A), middle temporal (B; subject B), or posterior temporal cortex (C; subject C), respectively. Each subject was also implanted with an MEA (magenta arrows) that allowed recording of deep cortical FP and action potentials from single neurons. The location of the ECoG channel closet to the MEA (blue) was treated as the spatial origin for computing distances across the grid.
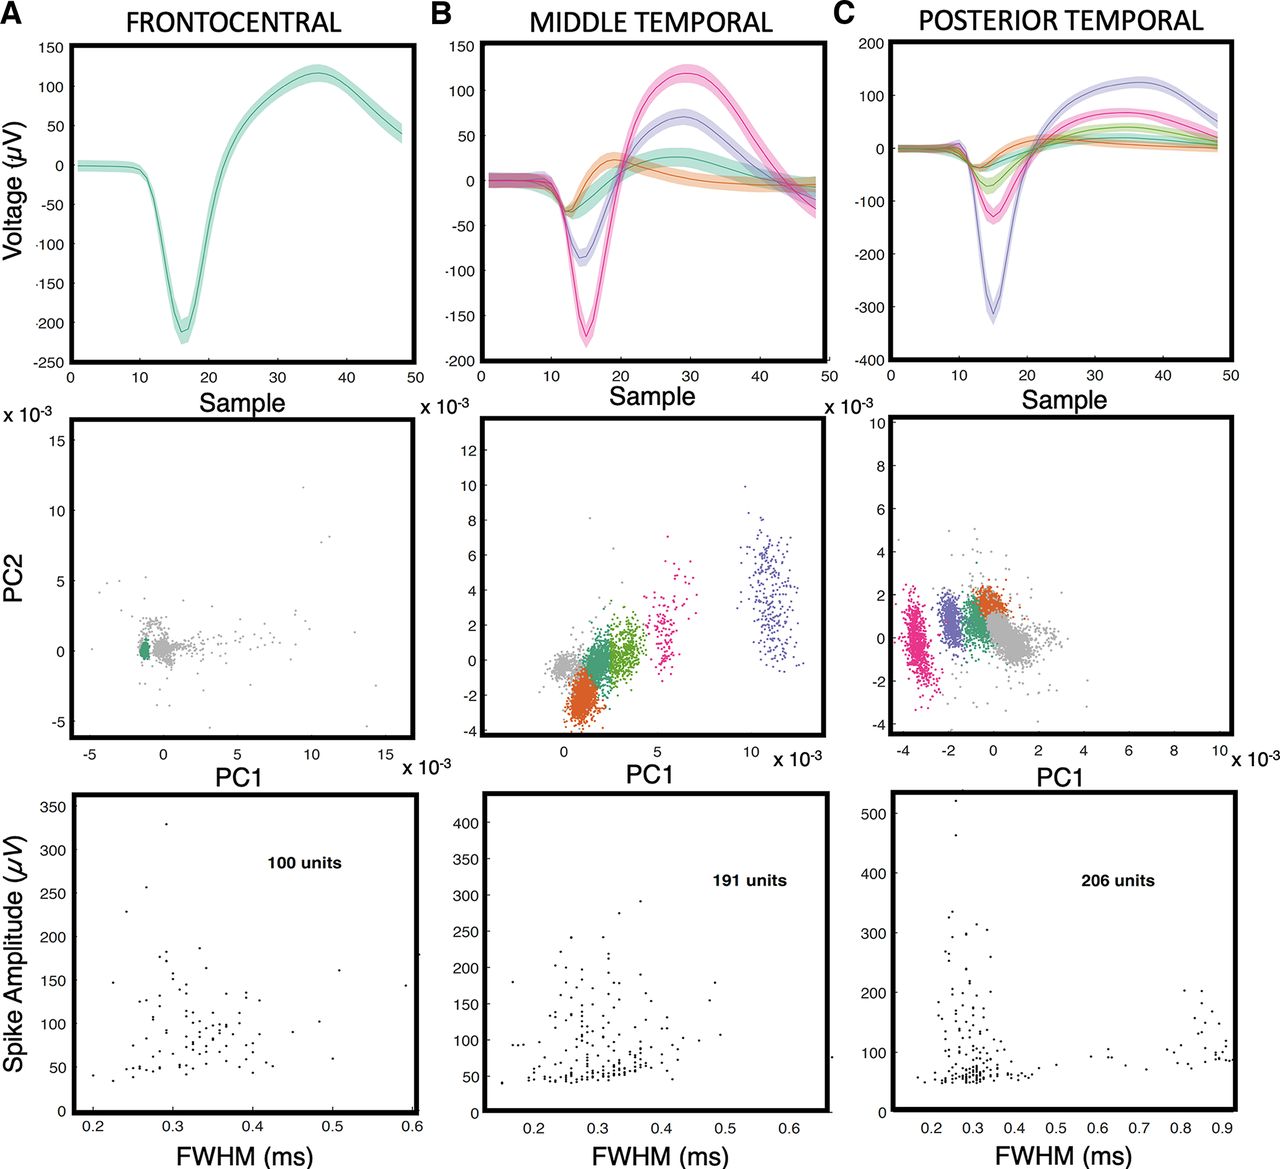
Single units from microelectrode arrays. A–C, Each subject had an MEA placed in the frontocentral cortex (A; subject A), middle temporal cortex (B; subject B), or posterior temporal cortex (C; subject C), respectively. The top row shows the mean and SD of all spike waveforms in an example channel. The middle row shows clusters of the corresponding spike waveforms and their separation from a noise cluster in principal component (PC) space. The bottom row contains scatter plots of the full-width at half-maximum (FWHM) of the spike waveform widths versus amplitudes for all units.
Coherence is inversely proportional to distance across the neocortex
The estimated spatial reach of coherence across the cortical surface was computed by first modeling coherence as a function of Euclidean distance (in millimeters) from the MEA in each brain region. CPD was used to estimate spatial reach by finding the distance at which variance in the magnitude of coherence changed significantly (for CPD description, see Materials and Methods). The propagation of neural signals across the cortical mantle is thought to conform to power law dynamics, where the sum or magnitude of neural signals are inversely proportional to the distance from their origin (Miller et al., 2009; Klaus et al., 2011). We found that coherence decreased as a power function of distance from the microelectrode arrays (Fig. 3). To investigate interaction effects between distance and oscillatory frequency, we computed a median split across all contacts based on the median distance from the MEA (2.29 cm). The term “proximal coherence” refers to coherence with signals within the median distance from the MEA (<2.29 cm). “Distal coherence” refers to coherence with contacts farther away from the MEA (>2.29 cm). All r2 values will indicate the goodness-of-fit and significance of the correlations between the raw and model-predicted values of coherence as a function of distance. We used a mixed 3 (subject: A, B, C) × 2 (distance: proximal, distal) × 3 (depth: ECoG, MEA, SFC) × 5 (frequency: delta, theta, alpha, beta, gamma) ANOVA to test how distance, depth, and frequency affected the magnitude of coherence.

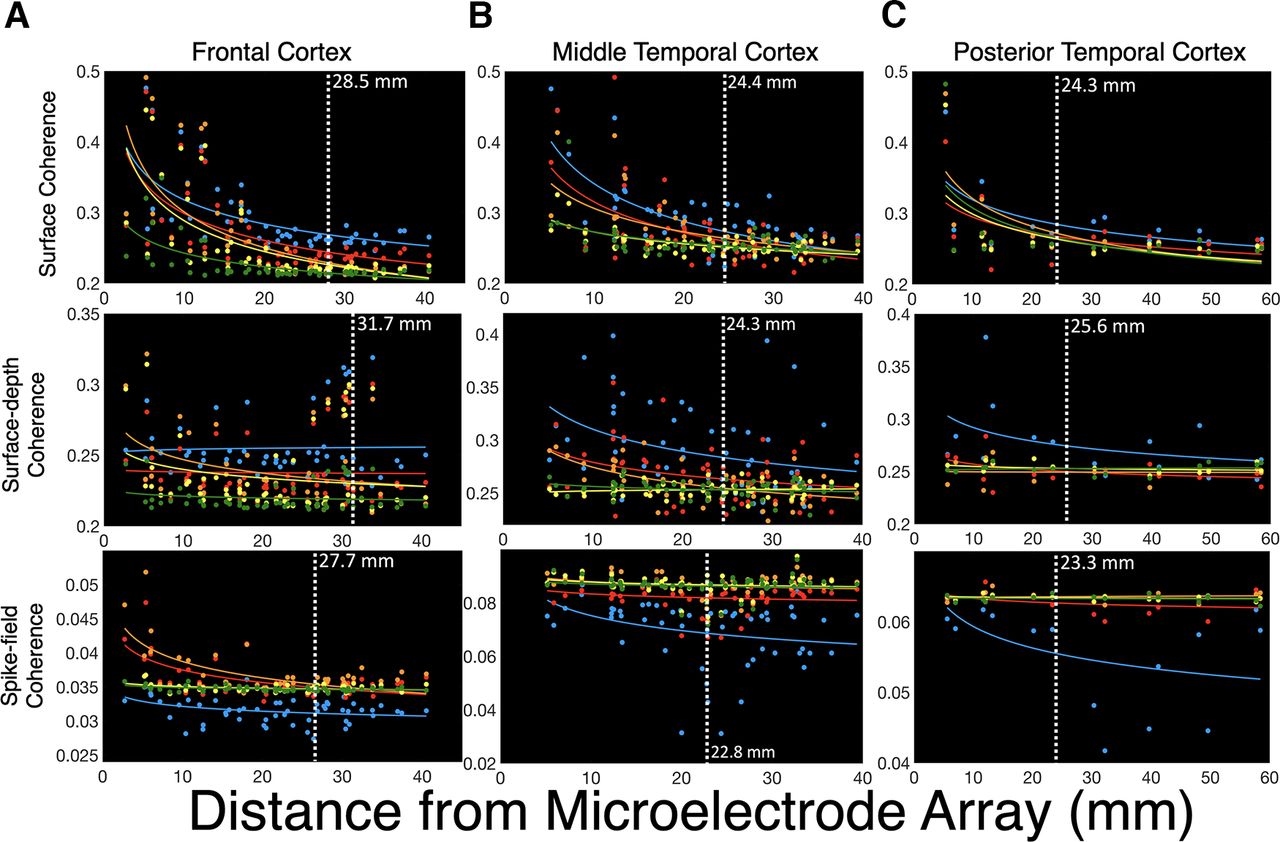
Coherence across brain regions decreases as a function of distance. A, Across frontal and temporal cortices, neuronal coherence between ECoG contacts decreased with distance. Power law decay of surface coherence occurred in delta, theta, alpha, beta, and gamma frequency bands (p < 0.001). B, Neuronal coherence between surface (ECoG) and deep cortical field potentials (MEA) also decreased with distance for alpha (p < 0.001), beta (p < 0.001), and gamma (p < 0.001) frequencies. C, SFC between action potentials and superficial FPs (ECoG) showed a similar pattern of power law decay for delta (p = 0.003), theta (p < 0.001), and alpha (p < 0.001) frequencies. Vertical white lines depict the spatial reach of coherence, which was estimated using changepoint detection on the coherence × distance data across all brain regions. D, Violin plots represent probability density estimates of coherence magnitude for each frequency band. E, Proximal coherence refers to ECoG contacts that were within the median distance of the microelectrode array (2.29 cm), whereas distal coherence refers to contacts that were beyond that range. The magnitude of surface coherence was greater for proximal contacts, especially for alpha signals (p < 0.001). Delta and theta coherence between superficial ECoG and intracortical field potentials did not decrease significantly with distance. F, Effect size statistics (r2) for the models in A, B, and C. Surface (ECoG-to-ECoG) coherence had the highest power law decay (p < 0.05). The results reported in A, B, and C were computed by fitting a power function to the median-centered coherence data as a function of distance from the microelectrode arrays. White vertical lines indicate the estimated spatial reach based on CPD. The p-values indicate the significance of correlation between the raw and predicted values of coherence as a function of distance. Values above the black horizontal lines in D and E represent channels where coherence was greater than the mean value. The results shown in D and E were tested with a mixed 3 (subject: A, B, C) × 2 (distance: proximal, distal) × 3 (depth: ECoG, MEA, SFC) × 5 (frequency: delta, theta, alpha, beta, gamma) ANOVAs.
Surface coherence
We examined 125 ECoG signals from frontocentral (n = 55), middle temporal (n = 55), and temporo-occipital cortices (n = 15). Across all brain regions, synchronization between ECoG contacts, or surface coherence, decreased with distance from the microelectrode arrays. CPD estimated that the spatial reach of surface coherence was 2.32 cm. Significant power law decay of surface coherence was observed for delta (1–3 Hz; r2 = 0.286, p < 0.001), theta (4–7 Hz; r2 = 0.25, p < 0.001), alpha (8–14 Hz; r2 = 0.32, p < 0.001), beta (15–30 Hz; r2 = 0.30, p < 0.001), and gamma (31–50 Hz; r2 = 0.24, p < 0.001; Fig. 3A) bands. A main effect of distance showed that surface coherence was greater for contacts <2.29 cm median distance from the MEA (F(1,119) = 24.36, p < 0.001, η2 = 0.17). Surface coherence in the alpha band (8–14 Hz) was higher than all other frequencies (F(4,116) = 4.09, p = 0.004, η2 = 0.12). However, a distance × frequency interaction showed that alpha coherence was only highest for signals within the median distance (F(4,116) = 6.94, p < 0.001, η2 = 0.19). Gamma coherence was higher for ECoG channels outside the median distance (p < 0.001; Fig. 3D,E). These findings suggest that the synchronization of superficial FPs involves specialized frequencies that reach multiple centimeters across the cortical mantle. Higher gamma coherence may indicate temporally aligned inputs to superficial cortical layers (Buzsáki and Schomburg, 2015).
Surface-depth coherence
Coherence between superficial (ECoG) and deep intracortical FPs recorded from the MEA will be referred to as surface-depth coherence. CPD estimated that the spatial reach of surface-depth coherence was 2.62 cm from the MEAs, which is ∼3 mm farther than surface coherence. Surface-depth coherence showed power law decay with distance for alpha (r2 = 0.17, p < 0.001), beta (r2 = 0.08, p < 0.001), and gamma (r2 = 0.09, p < 0.001) frequency bands. Delta (p = 0.054) and theta (p = 0.0502) surface-depth coherence did not show power law decay across a distance (Fig. 3B). The magnitude of surface-depth coherence also did not decrease beyond the median distance from the MEA (p = 0.102). Delta (1–3 Hz) and beta (15–30 Hz) surface-depth coherence overshadowed other frequencies (F(4,116) = 3.87, p = 0.006, η2 = 0.12). These results converge with previous research emphasizing the importance of delta and beta oscillations for cross-laminar communication (Sotero et al., 2015; Bastos et al., 2018; Fig. 3B).
Spike-field coherence
SFC between action potential spike trains and ECoG was averaged across 497 simultaneously recorded neurons. SFC reached ∼2.21 cm from the MEAs, which was the shortest distance among all types of coherence that we measured (Fig. 3C). We observed significant power law decay for delta (r2 = 0.07, p = 0.003), theta (r2 = 0.12, p = 0.001), and alpha (r2 = 0.20, p < 0.001) SFC. Beta SFC (p = 0.056) and gamma SFC (p = 0.164) did not show power law decay. A main effect of frequency indicated that alpha was the primary frequency band for SFC (F(4,116) = 3.48, p = 0.010, η2 = 0.12). A distance × frequency interaction revealed that alpha SFC was higher for proximal signals, whereas beta SFC was higher for distal signals (F(4,116) = 3.32, p = 0.013, η2 = 0.10; Fig. 3D,E).
Across all types of coherence (i.e., surface, surface depth, SFC), a main effect of depth showed that surface coherence was higher than surface depth and SFC (F(2,118) = 13.01, p < 0.001, η2 = 0.18; Fig. 3D–F). This result implies that greater synchronization exists among neurons within layers than across layers. Intriguingly, surface-depth coherence was higher than surface coherence for signals beyond the median distance, which is convergent with the slightly higher estimates of spatial reach (23 mm vs 26 cm; F(2,118) = 12.17, p < 0.001, η2 = 0.17; Fig. 3B). These results suggest that coherence involving deeper, intracortical signals has the potential to reach even greater distances than superficial synchronization. A depth × frequency interaction showed distinct frequency profiles for each type of coherence, where surface coherence was highest in the alpha band and surface-depth coherence was highest in the delta band (F(8,112) = 12.17, p < 0.001, η2 = 0.25). Overall, across all types of coherence, alpha coherence was higher than that of other bands (η2 = 0.09, p = 0.022). The prominence of alpha synchrony may relate to its specialized role in corticocortical communication (Chapeton et al., 2019).
Individual brain effects
Subject A had ECoG grid coverage (n = 55 signals) across the frontocentral cortex, including the middle frontal gyrus (MFG), precentral gyrus, and postcentral gyrus (Figs. 1A, 3). These brain regions play important roles in cognitive control and response selection. Subject A performed the MSIT, which is a controlled decision-making task with two dimensions of decision conflict (Sheth et al., 2012; Smith et al., 2019; for task descriptions, see Materials and Methods). The microelectrode array was placed on the posterior MFG. Across frontocentral cortex, surface coherence reached an estimated 2.85 cm. Surface-depth coherence reached 3.67 cm, and SFC was estimated at 2.77 cm. A main effect of depth showed that surface coherence was at a higher magnitude than surface-depth coherence and SFC (F(2,26) = 4040.99, p < 0.001, η2 = 0.99). However, a distance × depth interaction revealed that beyond the median distance, surface-depth coherence was greater than surface coherence in frontal cortex [F(2,26) = 10.10, p = 0.001, η2 = 0.44; Fig. 4 (see also Fig. 6)]. A main effect of frequency showed that delta and theta coherence were highest among all types of coherence in frontocentral cortex (F(4,24) = 292.86, p < 0.001, η2 = 0.98), but a depth × frequency interaction suggests that the dominant frequency bands are unique to each depth (F(8,20) = 451.84, p < 0.001, η2 = 0.99). Delta and theta coherence were more prominent for surface (ECoG-to-ECoG) coherence, whereas surface-depth coherence (MEA-to-ECoG) was dominated by delta and alpha frequencies. Theta and alpha frequencies had the highest SFC in this region.

Frontocentral cortical coherence. The spatial spread of surface coherence (ECoG-to-ECoG), surface-depth coherence (ECoG-to-FP), and SFC across frontal cortex. The ECoG channel closest to the microelectrode array (blue) was treated as the spatial origin point for distance computations. The data in this figure were maximum–minimum normalized (0–1) to highlight the spatial patterns of each frequency band and type of coherence. Legend in the lower left corner defines the superior (S) and anterior (A) axes.
Subject B had ECoG coverage across the temporal cortex, including the middle, superior, and inferior temporal gyri, and the supramarginal gyrus. These regions are known to play important roles in auditory perception and attention. The participant completed a speech perception task in which they listened to two speakers (male and female) talking at the same time. The goal was to attend to either the male or female speaker in alternating blocked trials (O'Sullivan et al., 2019; for task descriptions, see Materials and Methods). The microelectrode array was placed on the middle temporal gyrus (MTG). Surface coherence reached ∼2.44 cm, showing power law decay for delta (r2 = 0.48, p < 0.001), theta (r2 = 0.33, p < 0.001), alpha (r2 = 0.38, p < 0.001), beta (r2 = 0.48, p < 0.001), and gamma (r2 = 0.21, p < 0.001) signals (see Fig. 7B). A main effect of distance showed significant reductions in surface coherence beyond the median distance of 2.29 cm (F(4,24) = 14.79, p = 0.001, η2 = 0.35). Delta coherence was most prominent across the surface of temporal cortex (F(4,23) = 4.305, p = 0.010, η2 = 0.428; see Fig. 7B). Across all types of coherence in MTG/superior temporal gyrus (STG) cortices, surface coherence was higher than surface-depth coherence and SFC (F(2,26) = 6723.41, p < 0.001, η2 = 0.99; see Fig. 7B). However, for signals outside the median distance, surface-depth coherence was higher than other forms of coherence (F(2,26) = 9.10, p = 0.001, η2 = 0.42; see Fig. 7B). This finding aligned with the results from subject A (Figs. 4, 5). Lower frequency (delta to theta) coherence was most prominent for both surface and surface-depth types, and SFC was greater for higher frequencies (alpha, beta, gamma; F(8,20) = 26.99, p < 0.001, η2 = 0.915). Coherence across the temporal cortex had a slower rhythm (1–7 Hz), while the time courses of action potentials were more aligned with higher frequency bands (8–50 Hz).

Posterior temporal and occipital coherence. The spatial spread of surface coherence, surface-depth coherence, and SFC across posterior temporal cortex. The ECoG channel closest to the microelectrode array (blue) was treated as the spatial origin point for distance computations. The data in this figure were maximum–minimum normalized (0–1) to highlight the spatial patterns of each frequency band and type of coherence. The legend in the lower left corner defines the superior (S) and anterior (A) axes.
Subject C had ECoG coverage across temporal and occipital cortices, including the MTG and STG, and the inferior, middle, and superior occipital gyri (Fig. 1C). These brain areas are important for memory and visual perception. The participant completed a social cognition task where they watched short video clips from popular movies before answering questions about the semantic and emotional content of the videos (for task descriptions, see Materials and Methods). The microelectrode array was placed in posterior temporal cortex. Surface coherence reached ∼2.32 cm and did not decrease significantly beyond the median distance of 3.03 cm (p = 0.254). Across all types of coherence in posterior temporal/occipital cortex, surface coherence was of a higher magnitude than surface-depth coherence and SFC (F(2,14) = 256.54, p < 0.001, η2 = 0.97; Fig. 6C). Although surface coherence retained similar magnitudes across distance, we showed power law decay for delta (r2 = 0.35, p = 0.020), theta (r2 = 0.28, p = 0.043), alpha (r2 = 0.50, p = 0.003), beta (r2 = 0.31, p = 0.031), and gamma (r2 = 0.33, p = 0.025) coherence. Delta and alpha were the primary rhythms of coherence in posterior temporo-occipital cortex (F(4,28) = 5.80, p = 0.002, η2 = 0.453). Surface-depth coherence reached an estimated 2.61 cm and showed no power law decay with distance from the MEA (p > 0.08). Delta (1–3 Hz) was the most prominent rhythm of surface-depth coherence (F(4,28) = 7.36, p < 0.001, η2 = 0.51; Figs. 6C, 7C). SFC was averaged across 206 simultaneously recorded neurons recorded in posterior temporal cortex, reaching an estimated 2.21 cm. SFC did not show significant power law decay in this region (p > 0.05). A marginally significant effect of distance showed lower SFC for signals beyond the median distance of 3.03 cm (p = 0.067, η2 < 0.40). A main effect of frequency indicated that spikes were most coherent with alpha oscillations, which was consistent with the effects observed in subjects A and B (F(4,28) = 40.37, p < 0.001, η2 = 0.85).

Proximal versus distal coherence for frontal and temporal cortices. Across the frontocentral cortex, alpha signals had the highest magnitude of surface coherence, particularly for proximal channels (p < 0.001). Delta surface coherence was higher for distal channels (p = 0.037). Alpha signals in frontocentral cortex showed the highest surface-depth coherence (p < 0.001) and SFC as well (p < 0.001). Across the middle temporal cortex, the magnitude of surface coherence was highest for delta and theta coherence (p = 0.010). Delta surface-depth coherence had the highest magnitude (p = 0.001), but delta SFC was the lowest magnitude. Across the posterior temporal cortex, alpha surface coherence was highest for proximal channels, and delta coherence was highest for distal channels (p = 0.033). Theta surface-depth coherence was highest for distal channels (p < 0.001), and the magnitude of delta SFC fell off significantly with distance across posterior temporal/occipital regions (p = 0.024). These results were computed using 2 (distance: proximal, distal) × 3 (depth: surface, surface depth, SFC) × 5 (frequency: delta, theta, alpha, beta, gamma) ANOVAs.
Spatial reach is similar across brain regions. A, Across frontocentral cortex, surface coherence reached 2.84 cm, showing significant power law decay for delta (p < 0.001), theta (p < 0.001), alpha (p < 0.001), beta (p < 0.001), and gamma (p < 0.001) signals. Surface-depth coherence reached 3.17 cm across frontocentral cortex and showed decay for only alpha signals (p = 0.027). SFC reached an estimated 2.77 cm across the frontocentral cortex. Power law decay was observed for delta (p = 0.011), theta (p < 0.001), alpha (p < 0.001), beta (p = 0.003), and gamma (p = 0.001) SFC. B, Across middle temporal cortex, surface coherence reached ∼2.44 cm, showing decay for delta (p < 0.001), theta (p < 0.001), alpha (p < 0.001), beta (p < 0.001), and gamma (p < 0.001) signals. Surface-depth coherence reached 2.43 cm across middle temporal cortex, showing decay for delta (p = 0.008), theta (p = 0.022), and alpha (p < 0.001) signals. SFC across the middle temporal cortex reached an estimated 2.27 cm across temporal cortex, showing decay was observed for delta (p = 0.005), theta (p = 0.004), alpha (p = 0.001), beta (p = 0.001), and gamma (p = 0.001) SFC. C, Across posterior temporal cortex, surface coherence reached 2.43 cm and showed decay for delta (p = 0.020), theta (p = 0.043), alpha (p = 0.043), beta (p = 0.031), and gamma (p = 0.025) frequencies. Surface-depth coherence reached 2.56 cm and showed no power law decay across posterior temporal cortex. SFC reached an estimated 2.21 cm. There was no significant decay for SFC in this region, and only delta signals showed a trend (p = 0.087).
Discussion
The fundamental relationship among field potentials, single-unit activity, and behavior has evoked much curiosity about the spatial reach of the FP signal (Katzner et al., 2009; Xing et al., 2009; Kajikawa and Schroeder, 2011, 2015; Lindén et al., 2011; Leszczyński et al., 2020). Previous studies on the spatial reach of FPs focused on brain regions with unique cytoarchitecture such as visual (Katzner et al., 2009) or auditory cortex in nonhuman primate models (Kajikawa and Schroeder, 2011, 2015; Smith et al., 2013). There remains a significant gap in our knowledge about the spatial properties of FPs in the human brain. We used simultaneous ECoG and high-density UMA recordings to estimate the spatial reach of neuronal coherence and SFC across the human neocortical surface. Our methods provide insight about the distance that neuronal coherence might reach across a given brain region. Across frontocentral and temporal cortices in humans, coherence reached 2–3 cm. Our findings were consistent with evidence showing that FPs are detectable across several millimeters (Kajikawa and Schroeder, 2011). By studying coherence specifically, we have quantified the spatial reach of phase alignment itself, which seems to be directly involved in neuronal communication because phase synchronization can facilitate coordinated neuronal activity (Lachaux et al., 1999; Fries, 2015). The spatial reach of coherence was similar across brain regions and tasks, which suggests that these findings may generalize to biophysical principles. Understanding these spatial properties may shed light on the nature of local neuronal communication and the spread of synchronous activity across the neocortex.
Previous reports have shown that the tips of UMA electrodes (1.5 mm) can record from layers 4/5 of the cortex (Schevon et al., 2012), which reinforced our confidence in exploring the lateral spread of surface-depth coherence. The oscillatory and single-unit responses to different stimulus inputs are known to vary within brain regions. For example, neurons in layer 4 of auditory cortex will respond in classic feedforward fashion to auditory stimuli, but tactile stimuli elicit responses in the more superficial, supragranular layer (Lakatos et al., 2007). A related physiological mechanism could be thalamocortical calbindin-positive matrix neurons, which begin in the thalamus and project to superficial cortical layers (Jones, 2001). These matrix neurons could play a key role in corticocortical coherence (Schroeder and Lakatos, 2009; Müller et al., 2020). Our results may link to these previous observations, implying that longer-range corticocortical synchrony can spread via deeper cortical layers. Surface-depth coherence was greater for distances beyond 2.3 cm, peaking for delta and theta signals.
Across all brain regions, the magnitude of SFC was greatest for alpha signals (8–14 Hz), which could highlight a nascent link between alpha and local spike timing in neocortex. Some theorize that alpha oscillations play a specific role in excitatory–inhibitory balance (Klimesch et al., 2007; Mathewson et al., 2011; Chapeton et al., 2019). Oscillatory timing of neuronal activity allows for complex coding schemes such as “temporal coding,” where neural populations synchronize to process complex stimuli (Engel et al., 1991; Panzeri et al., 2002, 2010), encode memories (Robinson et al., 2017), or manage decision conflicts (Smith et al., 2019). The most well known neural coding scheme is the single-unit firing rate (Gerstner et al., 1997), or “rate coding,” which is studied extensively to determine how firing rates support important functions such as perception (Andrei et al., 2019) and motor control (Kline and De Luca, 2016). Rate coding and temporal coding are potentially independent mechanisms that can occur within the same region (Gerstner et al., 1997; Andrei et al., 2019), but both are affected by the oscillating FP (Rasch et al., 2008; Buzsáki et al., 2012). The SFC results suggest that distant field potentials occurring several millimeters away can be weakly coupled to local spike timing in the human neocortex. Our findings are consistent with previous work showing that local unit activity can be coherent with low-frequency oscillations measured at a distance (Benchenane et al., 2010; Eissa et al., 2017).
This research expands our knowledge on the effective range of phase coherence and spike-field coupling across the cortical mantle. The spatial reach of coherence seems similar across brain regions, but it is likely that more complex spatial patterns of coherence exist when examined across different cortical and subcortical structures. We encourage the use of simultaneous ECoG, depth electrode, and/or MEA recordings to further advance our knowledge of the spread of information through cerebral space. With these ideas in mind, future studies can include more subjects and more brain regions, and increase focus on brain state or task-related changes.
Footnotes
This study was supported by National Institutes of Health Grant R01-MH-106700 (S.A.S.), the Dana Foundation (S.A.S.), the McNair Foundation (S.A.S.), and the Brain & Behavior Research Foundation (Grant 26706; E.H.S.).
The authors declare no competing financial interests.
- Correspondence should be addressed to John C. Myers at john.myers{at}bcm.edu


