

Abstract
It is clear that humans can extract statistical information from streams of visual input, yet how our brain processes sequential images into the abstract representation of the mean feature value remains poorly explored. Using multivariate pattern analyses of electroencephalography recorded while human observers viewed 10 sequentially presented Gabors of different orientations to estimate their mean orientation at the end, we investigated sequential averaging mechanism by tracking the quality of individual and mean orientation as a function of sequential position. Critically, we varied the sequential variance of Gabor orientations to understand the neural basis of perceptual mean errors occurring during a sequential averaging task. We found that the mean-orientation representation emerged at specific delays from each sequential stimulus onset and became increasingly accurate as additional Gabors were viewed. Especially in frontocentral electrodes, the neural representation of mean orientation improved more rapidly and to a greater degree in less volatile environments, whereas individual orientation information was encoded precisely regardless of environmental volatility. The computational analysis of behavioral data also showed that perceptual mean errors arise from the cumulative construction of the mean orientation rather than the low-level encoding of individual stimulus orientation. Thus, our findings provide neural mechanisms to differentially accumulate increasingly abstract features from a concrete piece of information across the cortical hierarchy depending on environmental volatility.
SIGNIFICANCE STATEMENT The visual system extracts behaviorally relevant summary statistical representation by exploiting statistical regularity of the visual stream over time. However, how the neural representation of the abstract mean feature value develops in a temporally changing environment remains poorly identified. Here, we directly recover the mean orientation information of sequentially delivered Gabor stimuli with different orientations as a function of their positions in time. The mean orientation representation, which is regularly updated, becomes increasingly accurate with increasing sequential position especially in the frontocentral region. Further, perceptual mean errors arise from the cumulative process rather than the low-level stimulus encoding. Overall, our study reveals a role of higher cortical areas in integrating stimulus-specific information into increasingly abstract task-oriented information.
- electroencephalography
- multivariate pattern analysis
- sequential perceptual averaging
- summary statistical representation
Introduction
Understanding how humans effectively interact with the dynamic and complex sensory environment is of central importance in the behavioral, cognitive, and neural sciences. Growing evidence shows that the perceptual system extracts behaviorally relevant information from complex dynamic sensory signals by summarizing them with their central tendency—the mean—through the exploitation of statistical regularities of sensory data over space (Chong and Treisman, 2005; Greenwood et al., 2009; Alvarez, 2011; de Gardelle and Summerfield, 2011; Whitney and Yamanashi Leib, 2018) or time (Haberman et al., 2009; Albrecht et al., 2012; Piazza et al., 2013; Gorea et al., 2014; Hubert-Wallander and Boynton, 2015). How does the perceptual system compute the mean of sensory features and construct an abstract representation? Although much is known about spatial averaging (e.g., via progressively larger receptive fields in the visual system; Dumoulin and Wandell, 2008; Freeman and Simoncelli, 2011), less is known about temporal averaging (Navajas et al., 2017; McWalter and McDermott, 2018). Particularly, the neural mechanism of sequential perceptual averaging is not well defined. Although neuroimaging studies have shown that the brain simultaneously represents multiple successive images and their changes at each instant (Marti and Dehaene, 2017; King and Wyart, 2019), it is unclear how the abstract representation of the mean feature value develops in this changing visual stream.
Extracting temporally stable information, such as temporal feature averages from dynamic sensory environments, helps optimize behavior by allowing the structure of the environment to be robustly grasped. Integration plays a fundamental role in this process (Navajas et al., 2017; McWalter and McDermott, 2018), but it is unclear whether the mean feature value is updated after each stimulus or multiple stimuli when stimuli are serially delivered. Additionally, it has been established that the precision of the extracted mean is not perfect and declines with increasing feature variability (Dakin, 1999; de Gardelle and Mamassian, 2015; Haberman et al., 2015; Navajas et al., 2017; McWalter and McDermott, 2018). What are the causes of this error when estimating the mean of a stimulus sequence? Does the error occur at the stage of encoding individual visual images or at the stage of integrating these continuously changing features over time? Does environmental volatility influence the low-level representation of individual visual images, the cumulative construction of the mean feature value, or both? To address these questions, we explored the dynamics of the sequential perceptual averaging using multivariate pattern analyses of electroencephalography (EEG) signals recorded from human observers while they estimated the mean orientation of 10 randomly oriented Gabor patches sequentially presented at the fovea. By using an inverted encoding model (IEM; Brouwer and Heeger, 2009; Garcia et al., 2013; Myers et al., 2015; Foster et al., 2017), we were able to investigate how individuals and their mean orientations were represented in multivariate EEG activity during the sequential averaging task. By manipulating the variance of the 10 Gabor orientations, we monitored how the neural representations of individual orientations and their means were modulated as a function of environmental volatility. The sequential averaging task encouraged observers to update the mean orientation on presentation of each Gabor stimulus. The multivariate EEG pattern analyses enabled us to assess the contributions of individual stimuli to perceived mean orientation. By estimating how the individual stimuli were weighted into the mean orientation, we probed the neural mechanisms of estimating the mean orientation.
We found that both individual and mean orientations were represented in the dynamically evolving multivariate EEG activities. Second, the representation of the mean orientation emerged at specific delays after each Gabor onset, and its accuracy increased gradually toward the end of the sequence especially in the frontocentral region. For sequences of high orientation variance, however, the weighting of the later sequential stimuli was decreased, which may account for poor behavioral performance of perceptual mean estimation.
Materials and Methods
Observers
Twenty-four human observers (9 females, 15 males) participated in this study. Two participants were excluded from the analysis because of excessive eye movements. All observers had normal or corrected-to-normal visual acuity, gave informed written consent to participate as paid volunteers, and were tested individually in a dark room. The study was approved by the Institutional Review Board of the Korea National Institute for Bioethics Policy.
Stimulus
Visual stimuli were generated and presented using Psychophysics Toolbox (Brainard, 1997; Pelli, 1997) along with custom scripts written in MATLAB (MathWorks). The 19-inch display CRT monitor (ViewSonic PF817) was set to a refresh rate of 100 Hz and a resolution of 800 × 600 pixels. The CRT monitor gamma tables were adjusted to ensure response linearity and a constant mean luminance of 59 cd/m2. Participants viewed the stimuli from a distance of 70 cm in a darkened room.
Each trial consisted of a sequence of 10 randomly oriented Gabor patches, presented centrally for 100 ms, with an interstimulus interval of 500 ms to give observers enough time to encode and integrate sensory information across time. The orientation of each Gabor patch was one of 40 possible evenly spaced angles spanning 180°. Each sequence was preceded and followed by a blank period. All Gabor patches had identical parameters (contrast, 50%; diameter, 8° visual angle; spatial frequency, 1.25 cycles/degree, Gaussian envelope SD, 2° visual angle), except for their orientation.
Experimental procedure
The observer initiated each trial by pressing the space button. A central fixation cue appeared for 500 ms. During the subsequent 6 s, observers viewed a sequence of 10 tilted Gabor patches against a midgray background, followed by a blank period of 700 ms (Fig. 1a). During this entire period, observers were instructed to maintain fixation on the center of the screen and attempt to withhold eyeblinks. After the sequence, a circularly bounded red probe bar appeared in the center of the screen. The observers' task was to estimate the mean orientation of 10 Gabor patches by rotating the red probe bar counterclockwise or clockwise using the left- or right-arrow key and pressing the down-arrow key when the adjusted orientation seemed to match the mean orientation. The probe display remained until the observers responded.
For experiments, there were 16 trial types: eight mean orientations (11.25°, 33.75°, 56.25°, 78.75°, 101.25°, 123.75°, 146.25°, and 168.75°) and two variances. There were two experimental conditions that differed in the orientation variance of the sequence. For the low-variance condition, the sequence comprised ±4.5°-, ±9°-, ±13.5°-, ±18°-, and ±22.5°-oriented Gabor patches relative to the mean orientation. For the high-variance condition, the sequence consisted of ±9°-, ±18°-, ±27°-, ±36°-, and ±45°-oriented Gabor patches relative to the mean orientation. Ten orientations of every sequence were randomly shuffled to define the presentation order. Eight possible mean orientations were used for both conditions. The Gabor patch with the mean orientation of the sequence never appeared in the stream of 10 Gabor patches. Because this manipulation of the orientation variability alone made the sequential averaging task difficult enough, we did not further manipulate temporal regularity in the streams of Gabor patches. As previous studies have shown that any perturbation of temporally regular stimulation impedes both perceptual sensitivity and reaction time (Schroeder and Lakatos, 2009; Cravo et al., 2013; Morillon et al., 2016), we used the same periodic stimulation in low- and high-variance conditions.
We tested each observer for 320 trials in eight blocks of 40 trials each. In each block, a sequence with one of eight possible mean orientations was repeated five times with 10 randomly shuffled orientations. Two variance conditions alternated in a block-design manner, and the order of conditions was counterbalanced across observers. We gave the observers breaks within and between blocks as necessary.
EEG signal acquisition and preprocessing
The EEG data were collected with 128-sensor HydroCel Sensor Nets (Electrical Geodesics) at a sampling rate of 500 Hz and were bandpass filtered from 2 Hz to 200 Hz. The raw data were then epoched between −150 ms and 6700 ms relative to the first stimulus onset. We used the Fully Automated Statistical Thresholding for EEG Artifact Rejection (Nolan et al., 2010) package to reject artifacts and interpolation of noisy EEG sensors. Finally, the EEG was rereferenced to the common average of all the sensors. All analyses were performed with 111 EEG channels, excluding 17 channels vulnerable to movement artifacts including electrodes around the ears and on the face. The elimination of these nuisance channels did not change the results of the analyses that used 128 EEG channels.
Behavioral data analysis
First, we performed linear regression analysis to quantify the relative influence of each sequential position on the observers' reported perceptual mean orientation (Juni et al., 2012; Hubert-Wallander and Boynton, 2015) as follows,
To examine the effect of sequence variance on how the perceptual mean is computed during a sequential averaging task, the observers' behavioral data were fit to the sequential update model (Navajas et al., 2017). This model is based on the assumption that observers keep track of the mean orientation and update it after each stimulus presentation. In this model, observers combine a noisy estimate of the current stimulus with their previous estimate of the mean as follows:
Inverted encoding model
To reconstruct the orientation information from the spatially distributed pattern of the EEG signals, we used an IEM (Brouwer and Heeger, 2009; Garcia et al., 2013; Myers et al., 2015; Foster et al., 2017), where each orientation is represented using weights from a linear basis set of population tuning curves. Forty hypothetical channel tuning functions were centered at 40 orientations used in trials, evenly spaced from 0° to 180° in steps of 4.5°; each basis function was a half-sinusoidal function raised to the fifth power. The epoched signals were baseline corrected using the average signal from −150 to −50 ms relative to the onset of the first Gabor patch presented in the sequence of each trial. We focused all our IEM analyses on the EEG signals above 2 Hz. The main reason was to minimize the effect of the physically driven oscillatory waveform [steady-state visual evoked potential (SSVEP)] at the stimulus presentation rate of 100 ms ON to 500 ms OFF on the representational dynamics, although the periodic stimulation still elicited higher harmonic SSVEP responses in EEG. Also, the current research was aimed at investigating whether the EEG activity pattern dynamics directly represent the stimulus and the mean information during a sequential averaging task rather than confirming the role of the specific frequency band activity in rhythmically modulating the gain of information processing because various frequency band activities are already known to be involved in sensory and cognitive information processing (Maris and Oostenveld, 2007; Busch et al., 2009; Busch and VanRullen, 2010; Landau and Fries, 2012; Fiebelkorn et al., 2013; Landau et al., 2015; Fiebelkorn et al., 2018; Helfrich et al., 2018) regardless of external stimuli being presented at a rate of particular frequency in the range of delta (Schroeder and Lakatos, 2009; Wyart et al., 2012; Cravo et al., 2013) or theta (Hanslmayr et al., 2013; Fiebelkorn et al., 2018; Helfrich et al., 2018; Zhang et al., 2018) band.
Recovering physical orientation during the sequence presentation period
To recover stimulus orientations, the stimulus-evoked activities of all the sequentially presented Gabor patches labeled with their physical orientations were trained and tested in the leave-one-trial-out (i.e., leave 10 samples out) fashion. Throughout this article, a sample is simply a multivariate EEG activity evoked by an individual-oriented Gabor patch. Specifically, 10 Gabor patches in each sequence from both variance conditions were independently epoched between −100 ms and 700 ms relative to each Gabor patch onset and labeled with their physical orientations. Of the 3200 samples across both variance conditions (80 samples per 1 of 40 orientations), 10 samples from one test trial were tested with the inverted encoding model weight matrix trained on the remaining 3190 samples. For each sample, the channel tuning function was zero centered relative to the presented orientation. This procedure was repeated for each time point in the stimulus epoch before moving to the next iteration in the leave-one-trial-out procedure. Zero-centered orientation-selective tuning functions were then separated into each experimental condition (1600 samples per variance condition) and averaged across trials for each condition.
We constructed the inverted encoding model as follows:
We estimated the population orientation response
To summarize the tuning-curve slope as a function of time, we calculated the linear slope of the zero-centered tuning curve from −90° to 0° at each time point in the epoch (Myers et al., 2015). We averaged the zero-centered tuning curves that were equidistant from 0° (i.e., +4.5° and −4.5°, +22.5°, and −22.5°). The resulting orientation channel time course was smoothed with a Gaussian kernel (σ = 30 ms; see Figs. 3c,d, 4b, 5a, 6a). We then fit a linear slope across the orientation channels from −90° to 0°, separately for each time point, variance condition, and observer. Tuning-curve slope was evaluated using one-sample t tests (against zero). In doing so, zero tuning-curve slope corresponded to no orientation selectivity, whereas higher tuning-curve slope corresponded to greater orientation selectivity. Multiple comparisons across time points were corrected using nonparametric cluster-based permutation testing (Maris and Oostenveld, 2007; 5000 permutations).
Recovering mean orientation during the sequence presentation period
We performed another IEM analysis to determine the mean orientation represented in each of the stimulus-evoked activity patterns of Gabor patches presented in the trial. This analysis had two purposes. The first was to examine how sequential variability influences the accuracy of the mean information represented in the EEG activity patterns during the sequence presentation period. Thus, we checked whether the difference in behavioral performance between the two conditions correlated with the difference in the representational quality of the mean information. The second purpose was to examine whether observers used the sequential update strategy to extract the mean orientation over the sequence. Specifically, we examined whether the neural representation of the mean orientation becomes increasingly more precise as a function of sequential position.
To recover the mean orientation, we trained the same inverted encoding model as described above with 3190 stimulus-evoked activity patterns epoched between −100 ms and 700 ms relative to each Gabor patch onset, except for 10 stimulus-evoked activity patterns from one test trial. Both training (3190 samples) and test data (10 samples from one trial) were labeled with their mean orientation of the corresponding trials. The population tuning curve was recovered by applying the weight matrix to the left-out samples of the trial. For each test sample, the population tuning curve was zero centered relative to the mean orientation. This procedure was repeated for each time point in the stimulus epoch before moving to the next iteration in the leave-one-trial-out (i.e., leave 10 samples out) fashion.
To investigate whether observers could keep track of the mean orientation after each stimulus presentation, we hypothesized that the mean orientation tuning-curve slope gradually increases as a function of sequential position if successive samples of sensory evidence are accumulated across sequential positions. We collapsed data across the low-variance and high-variance conditions and then performed a linear regression analysis on 10 tuning-curve slopes across sequential positions (see Figs. 4–6). This linear regression analysis was repeated at every time point from −100 ms to 700 ms after each Gabor patch onset. These output slopes were used to find the time clusters where regression slopes were significantly higher than zero, using a nonparametric cluster-based permutation testing (Maris and Oostenveld, 2007; 5000 permutations). Only when significant time clusters were found through the repeated linear regression analysis, tuning-curve slopes at each sequential position were averaged within a significant time cluster. The averaged 10 tuning-curve slopes were then used for testing the hypothesis of the linearly increasing trend of tuning-curve slopes of mean orientation across sequential positions. Specifically, we calculated the linear regression slope of the averaged tuning-curve slopes over sequential positions and compared the steepness between the low-variance and high-variance conditions. It would be worse for the encoding model of mean orientation to include all samples, even those belonging to the early sequential positions, because mean orientation cannot be precisely estimated with only a small portion of sequential stimuli. However, it is difficult to make an assumption about the sequential position where mean orientation starts to be precisely extracted. Therefore, to avoid selection problems and maximize statistical power, we used all samples and labeled them with their mean orientation of a trial. If there are samples where the mean orientation is represented, these data would be more influential when training the tuning-curve weight matrix; where the mean information is not represented, marginal influence is exerted on computing the weight matrix.
We split 111 electrodes in three clusters to examine the role of frontoparietal region in a sequential perceptual averaging process. In anterior, middle, and posterior electrode clusters, we performed the same linear regression analysis to find time points where the linear regression slopes across sequential positions were significantly positive.
Cross-temporal generalization of the IEM
When we performed the cross-temporal generalization analysis, we estimated the weight matrix using EEG data at each time point and applied the weight for the estimations of the channel responses across all time points. Specifically, we trained a weight matrix from the training set at time t and applied the estimated weight matrix to the test set at time t′. This procedure was repeated so that the weight matrices at every time point had been used to calculate the slope of the population tuning curves (tuning-curve slope) at every time point, thereby creating a two-dimensional temporal generalization matrix of the population tuning-curve slopes (see Figs. 3e, 4a). All other aspects (e.g., leave-one-trial-out, leave-10-samples-out) were identical to the inverted encoding model procedure explained above. Multiple comparisons across train-test time point pairs were corrected for using nonparametric cluster-based permutation testing (Maris and Oostenveld, 2007; 5000 permutations) to identify the significant train-test time pair where the tuning-curve slope was larger than 0 based on one-sample t test.
Results
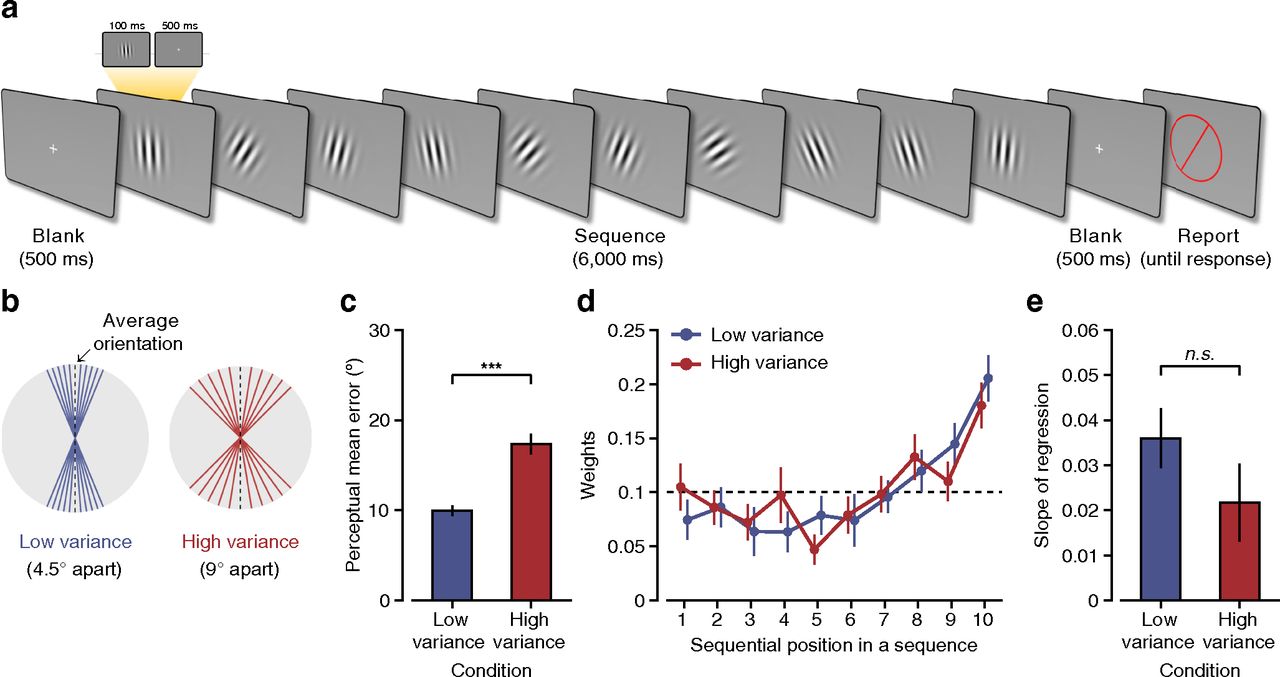
We analyzed scalp EEG signals from 22 human observers as they performed a sequential averaging task. Observers viewed 10 randomly oriented Gabor patches sequentially. The Gabor patch with the mean orientation was not presented to examine the internally generated representations of the mean. Following each sequence, observers were instructed to report the mean orientation by adjusting a red probe bar, preceded by a 700 ms blank period (Fig. 1a). The high- and low-variance sequences were presented in separate blocks (Fig. 1b; see above, Materials and Methods).

Stimuli and trial sequence, experimental conditions, and behavioral data analysis. a, Trial sequence. After a fixation period, 10 randomly oriented Gabor patches were sequentially presented, and the participants were instructed to report the mean orientation of the sequence by adjusting a red probe bar at the end of the sequence. b, Experimental conditions. Each trial had either low (4.5°) or high (9°) interstimulus orientation variance of 10 sequential Gabor patches. c, Behavioral performance in the low-variance and high-variance sequences. d, Mean weights (regression coefficients) as a function of sequential position. The x-axis indicates the sequential order of the presented Gabor patches on each trial. The y-axis indicates the relative influence of each stimulus on the participants' responses in the task. The dashed line indicates the expected weights when all sequential stimuli have the equal amount of influence on participants' responses. e, Linear slope of regression coefficients across sequential positions. n.s., Not significant. Error bars indicate ±1 SEM (c–e).
Modeling of sequential averaging process
The perceptual mean error was larger in the high-variance condition than in the low-variance condition (t(21) = −8.63, p < 10−7; Fig. 1c,d). To examine the relative influence of individual stimulus orientation on the perceived mean orientation, we first performed linear regression analysis (Juni et al., 2012; Hubert-Wallander and Boynton, 2015; see above, Materials and Methods). The behavioral data fit well to this weighted average model in both low-variance (r2 = 0.94 ± 0.04) and high-variance conditions (r2 = 0.82 ± 0.01), and the model showed significantly higher r2 value in the low- than in the high-variance condition (t(21) = 6.51, p < 10−5). We found that there was a significant recency effect (positive slopes); later stimuli had a greater influence on the perceived mean orientation than earlier ones in both low-variance (t(21) = 5.43, p < 10−4) and high-variance sequences (t(21) = 2.50, p < 0.05). There was no significant difference in the recency effect between the two variance conditions (t(21) = 1.64, p > 0.05; Fig. 1e). This result is in contrast to that of a previous study, which showed that recent stimuli had a greater influence on the perceptual mean orientation for the low- than the high-variance sequence (Navajas et al., 2017). This contrasting result may be partly because of the difference in sequence lengths; Navajas et al.'s (2017) sequence contained 30 stimuli, whereas ours contained only 10. We speculate that shorter sequences have advantages over longer sequences for remembering the earlier part of the sequence, so that even in the high-variance sequence, observers were able to estimate the mean of the sequence, leading to the same recency effect. Furthermore, low- and high-variance conditions were equivalent to the top two high-variance conditions in the study by Navajas et al. (2017), and the effect of environmental volatility on recency effect might be similar in our task.
Next, we fitted a variant of a leaky integrator model, called the sequential update model (Navajas et al., 2017), to the behavioral data. Because observers were required to report the mean orientation of each sequence, we assume that they updated their estimate of the mean after each stimulus presentation by combining a noisy estimate of the current stimulus with their previous estimate of the mean (see above, Materials and Methods) as in the following:
The model fitted the behavioral data well in both variance conditions (low-variance sequence: r2 = 0.93 ± 0.04; high-variance sequence: r2 = 0.80 ± 0.10), being significantly better for the low-variance than the high-variance condition (t(21) = 6.81, p < 10−6). The model predicted that the leak constant λ, the relative weighting of recent versus more distant stimuli, did not differ between the two variance conditions (t(21) = 0.21, p > 0.8; Fig. 2a). This result is consistent with the preceding analysis using the weighted average model showing that the recency effect was comparable across both conditions (Fig. 1e). In both low- and high-variance conditions, the recency effect was well captured by the leak constant λ that correlated positively with the regression slope of the average weights at 10 sequential positions in Figure 1d (r = 0.60, p = 0.003 for low variance; r = 0.56, p = 0.007 for high-variance condition; Fig. 2c,d). We also found that stimuli have a larger amount of multiplicative noise (γ) in high variance than in the low-variance condition (t(21) = −3.83, p < 0.001; Fig. 2b). This indicates that the process of updating mean orientation was noisier in the high-variance condition, leading to accurate representations of mean orientation at the end of the sequence.

Model fitting of behavioral data. a, b, Two best-fitting free parameters (λ and γ) that minimize the sum of squared differences between the output orientation of the model and the subjectively judged orientation by the observers. n.s., Not significant. **p < 0.01. c, d, Correlation between the recency effect value and best-fitting parameter λ. The recency effect value is defined as a slope of regression weights (see above, Materials and Methods; Fig. 1d). Each dot represents each subject.
Probing the neural mechanisms of sequential averaging in the presence of variability
To probe the neural bases of sequential averaging, we used an inverted encoding model (IEM) to recover information about the individual stimulus orientations and the mean orientation from the full EEG signals (Brouwer and Heeger, 2009; Garcia et al., 2013; Myers et al., 2015; Foster et al., 2017; see above, Materials and Methods). We characterized the effect of sequential variability on both the neural encoding of individual orientations and the neural integration of orientation by directly visualizing the temporal dynamics of orientation representation. Consistent with the model-fitting of the behavioral data suggesting greater integration noise in the high-variance condition, the IEM analysis confirmed that the process of sequentially integrating individual orientations to update the mean was degraded in the high-variance condition.
Recovering the individual stimulus orientation
First, we investigated whether a more variable sequence caused the individual stimulus orientation to be encoded less precisely in the EEG signals despite the presentation of the same physical stimuli in both sequences. To recover the individual stimulus orientation of the sequence, we applied an inverted encoding model to stimulus-evoked EEG signals. Forty idealized tuning curves, equally spaced between 0° and 180°, were used as basis functions (Fig. 3a). Each epoched data were labeled with the presented stimulus orientations, and those data were used to train and test the inverted encoding model in the leave-one-sequence-out cross-validation procedure (see above, Materials and Methods). Consequently, we obtained population tuning curves as a function of time for the presented stimulus orientations for both sequences. The reconstructed population tuning curves averaged from 0 ms to 200 ms poststimulus onset showed distinct peaks at 40 different stimulus orientations (Fig. 3b). When the population tuning curves were zero centered relative to their presented orientations, they revealed that the stimulus orientations were represented in multivariate EEG activity for almost the entire period after each stimulus onset (Fig. 3c; 0–510 ms relative to stimulus onset, cluster corrected, p < 0.001 for low variance; 10–550 ms relative to stimulus onset, cluster-corrected, p < 0.001 for high variance). Orientation-specific coding accuracies measured by the linear slopes of the tuning curves (see above, Materials and Methods) were not significantly different between the two conditions (Fig. 3d; cluster-based permutation test). We additionally performed a paired t test on the tuning-curve slopes averaged across time periods that showed significantly positive tuning-curve slopes (from 100 ms to 450 ms relative to stimulus onset). The difference between the two variance conditions was not significant (t(21) = 1.75, p = 0.094). These findings show that although individual orientations are encoded in the dynamically changing EEG patterns in both variance conditions, it is not a better encoding of individual orientation that explains better perceptual averaging in the low-variance sequence (Fig. 3e).

Temporal dynamics of the reconstructed tuning curves of stimulus orientation. The encoding model was trained and tested on stimulus-evoked activities from −100 to 700 ms after stimulus onset, with respect to their physical orientations. a, Hypothetical tuning curve (basis functions). Each color corresponds to 1 of 40 different orientations. b, Reconstructed stimulus orientation tuning curves (averaged from 100 to 200 ms after stimulus onset). Color coding is same as a. c, Time-resolved tuning curves. Tuning curves were zero centered and were averaged across trials separately for both variance conditions (left, low variance; right, high variance). d, Tuning-curve slope for both variance conditions. Top bars, The time period when the tuning-curve slope is significantly greater than zero (p < 0.05, based on cluster extent). Shaded areas indicate ±1 SEM. Right, Bar graphs indicate tuning-curve slopes averaged from 100 ms to 450 ms after stimulus onset for the comparison between the two variance conditions. Error bars indicate ±1 SEM. n.s., Not significant. c–d, Gray bars represent the time period when the stimulus was presented. e, Cross-temporal generalization of tuning-curve slope of stimulus orientation. The tuning-curve slope of physical orientation for low-variance (left) and high-variance (right) conditions was estimated by training weights on one time point in the training data and applying them to all time points in the test data. The transparency mask highlights the significant clusters where tuning-curve slopes are >0 (one tailed, p < 0.05, based on cluster extent).
Recovering the mean orientation
Next, we investigated whether a more variable sequence caused the mean orientation to be less precisely encoded in the EEG signals. The sequential update modeling of behavioral data predicted that the updated mean representation becomes more accurate toward the end of the sequence. Therefore, we examined whether the EEG signals reflected increasingly precise mean orientation representations. Because the integration noise parameter γ was significantly larger in the high-variance than in the low-variance condition (Fig. 2b), we also investigated whether the low-variance condition allowed observers to more precisely update the mean orientation. For this analysis, we assumed that each presentation of a Gabor, the visual evoked response pattern includes the neural representations of both the current stimulus orientation and the updated mean orientation. To isolate the latter, we trained the weight matrix to the mean orientation of the sequence and aligned the recovered orientation tuning curves to the mean orientation of the sequence at every time point after each stimulus onset (see above, Materials and Methods). Our rationale for labeling sequential samples as their mean orientation was that if the encoding model learns 10 samples in each trial as the same mean orientation instead of their own physical orientations, it would discard differences among individual Gabor orientations to only keep the internally integrated orientation that should be close to the mean orientation. This method allowed us to track the internal abstract representation of the mean orientation regardless of the physically presented orientation. It also enabled us to interpret the tuning-curve slope at each sequential position as the distance between the currently represented mean orientation and the actual mean orientation of the whole sequence.
We first checked whether the neural representation of the mean orientation indeed existed in stimulus-evoked multivariate EEG activity. The mean orientation selective tuning-curve slopes averaged across 10 sequential positions show that the mean orientations were well represented in the dynamically evolving EEG activity pattern for both sequences (Fig. 4a). In the low-variance condition, the two off-diagonal significant clusters indicate that the current and the next mean representations encoded in the dynamically changing stimulus-evoked EEG patterns correspond in the earliest period (training time, 600–690 ms, test time, 0–100 ms, cluster, p = 0.007; and training time, 0–120 ms, test time, 620–690 ms, cluster, p = 0.003; Fig. 4a, left). The diagonals in Figure 4a show that the mean orientation information emerges shortly after each Gabor onset (Fig. 4b, blue lines; −20 to 420 ms relative to stimulus onset, cluster-corrected, p < 0.001, and 510–690 ms relative to stimulus onset, cluster-corrected, p = 0.009 for low variance; Fig. 4b, red lines; 50–340 ms relative to stimulus onset, cluster-corrected, p = 0.001 for high variance). The neural representations of the mean orientation were more precise in the low-variance condition than in the high-variance condition (Fig. 4b, orange lines; −70 to 150 ms relative to stimulus onset, cluster-corrected, p = 0.005; 230–380 ms relative to stimulus onset, cluster-corrected, p = 0.015, and 480–680 ms relative to stimulus onset, cluster-corrected, p = 0.029). Figure 4c shows the accuracy of representing the mean orientation as a function of sequential position at every time point after each stimulus onset in the low-variance and high-variance conditions, respectively. We collapsed these data across both variance conditions and performed a linear regression analysis on 10 tuning-curve slope values at each time point to track the sequential evolution of the mean orientation represented in the EEG signals. We found two significant clusters of time points at which the mean orientation representation became increasingly precise across the 10 sequential positions (140–180 ms and 270–320 ms relative to stimulus onset, cluster-corrected, p = 0.026 and p = 0.029, respectively, for each cluster; these time periods are depicted in Fig. 4c using transparency mask highlights). These time points were later than the time points at which the representational accuracy of the presented orientation maximized as shown in Figure 3d. These results are summarized by averaging the mean tuning-curve slopes across time points of the two significant clusters separately for each condition (Fig. 4d).

Temporal dynamics of the reconstructed tuning curves of mean orientation. The encoding model was trained and tested on stimulus-evoked activities from −100 to 700 ms after stimulus onset, with respect to their mean orientation in each trial. a, Cross-temporal generalization of tuning-curve slope of mean orientation. The tuning-curve slope of mean orientation for low-variance (left) and high-variance (right) conditions was estimated by training weights on one time point in the training data and applying them to all time points in the test data. The transparency mask highlights the significant clusters where tuning-curve slopes are >0 (one tailed, p < 0.05, based on cluster extent). b, Time-resolved tuning-curve (T.C.) slopes with respect to the mean orientation (left). Right, Red and blue bars represent the time period when tuning-curve slope is significantly >0 (one tailed, p < 0.05, based on cluster extent; red, high variance; blue, low variance). The orange bar indicates the time period when tuning-curve slope is significantly different between the two variance conditions. c, Time-resolved tuning-curve slopes with respect to the mean orientation at 10 sequential positions for low-variance (left) and high-variance (right) conditions. Color represents tuning-curve slope. The transparency mask highlights the significant clusters where linear slopes across sequential positions are positively significant for all trials, regardless of their variance conditions. (see above, Materials and Methods). Gray bars represent the time period when the stimulus was presented. d, Tuning-curve slope bars as a function of sequential positions averaged across time on the significant clusters in b. e, The linear regression slope of tuning-curve slopes across sequential positions for the same time period as d. f, Average tuning-curve slope of the first half stimuli (from the 1st to 5th stimuli, left) and second half stimuli (from the 6th to 10th stimuli; right) in a sequence for the same period as d. n.s., Not significant. Error bars in indicate ±1 SEM (d–f); *p < 0.05, **p < 0.01, ***p < 0.001, ****p < 0.0001.
Because a large noise constant γ indicates a noisy integration of individual stimulus orientation information, we checked whether the updated mean orientation information became less precise as more stimulus orientations were integrated into a more variable environment. For each sequence, we calculated the linear regression slope of tuning-curve slopes of mean orientation at 10 sequential positions. We found a steeper regression slope of tuning-curve slopes of mean orientation across the 10 sequential positions in the low-variance condition than in the high-variance condition (t(21) = 2.88, p = 0.009; Fig. 4e). This difference was mainly because of the higher tuning-curve slope values in the later part of the low-variance sequence. The tuning-curve slope value averaged from the 6th to the 10th stimuli was higher in the low-variance condition than in the high-variance condition (t(21) = 2.30, p = 0.032; Fig. 4f), whereas there was no difference in the tuning-curve slope averaged from the first to the fifth stimuli between the two conditions (t(21) = 0.13, p > 0.8; Fig. 4f). For the more variable sequence, the less precise representation of the mean orientation indicated by the shallow regression slope was consistent with the significantly larger noise constant predicted by the sequential update model (Fig. 2b), which may lead to a poor behavioral performance in judging the perceptual mean (Fig. 1c). Although the behavioral data in the high-variance condition were well fit by the sequential update model (r2 = 0.80 ± 0.10; Fig. 2), the linear regression analysis of the 10 slope values showed a smaller Pearson correlation coefficient in the high-variance condition than in the low-variance condition (r = 0.29 ± 0.06 for low variance, r = 0.13 ± 0.06 for high variance, and t(21) = 2.22, p = 0.04). This suggests that the tuning-curve slope of mean orientation as a function of sequential position is less consistent with the linearly increasing trend in the high-variance condition. This is also in line with the fact that the sequential update model fits the behavioral data in the low-variance condition better than in the high-variance condition (t(21) = 6.81, p < 10−6; Fig. 2). Thus, we cannot rule out the possibility that the observers might have used different strategies for computing the mean orientation other than the sequential updating in a more variable environment.
When we performed the same linear regression analyses on the accuracy of the representations of individual stimulus orientations recovered from labeling the stimulus-evoked activities as their physical orientations as in Figure 3, we did not find gradual increases in the accuracy of neural representation over sequential positions in either condition (Fig. 5). The absence of a positive linear trend of the stimulus-coding accuracy suggests that the gradual increase in the mean-coding accuracy is not simply because of the increase in the signal-to-noise ratio with increasing sequential positions. Together, our results indicate that the positive linear trend of the mean-coding accuracy is because of the sequential updating of the mean orientation information after each stimulus onset.

Temporal dynamics of the reconstructed tuning curves of physical orientation. The encoding model was trained and tested on stimulus-evoked activities from −100 to 700 ms after stimulus onset, with respect to their individual physical orientations. a, Left, Time-resolved tuning-curve (T.C.) slopes with respect to the physical orientation. Right, Red and blue bars represent the time period when tuning-curve slope is significantly greater than zero (one tailed, p < 0.05, based on cluster extent; red, high variance; blue, low variance). b, Time-resolved tuning-curve slopes with respect to the physical orientation at 10 sequential positions for low-variance (left) and high-variance (right) conditions. Color represents tuning-curve slope. The transparency mask highlights the significant clusters where linear regression slopes across sequential positions are positively significant for all trials, regardless of their variance conditions (see above, Materials and Methods). In this analysis with physical orientation, there was no significant cluster in both variance conditions. Gray bars represent the time period when stimulus was presented. c, Tuning-curve slope bars as a function of a sequential position averaged across all time points in the significant clusters of Figure 4b. d, Linear regression slope of tuning-curve slopes across sequential positions for the same time period as in c. e, Average tuning-curve slope of the first half stimuli (from the 1st to 5th stimuli, left) and second-half stimuli (from the 6th to 10th stimuli, right) in a sequence for the same period as c. n.s., Not significant. Error bars indicate ±1 SEM (c–e); *p < 0.05, **p < 0.01, ***p < 0.001, ****p < 0.0001, *****p < 0.00001.
The role of frontoparietal region in sequential perceptual averaging
Despite the limitation of low spatial resolution of EEG, we investigated where the sequential update was processed in the brain by splitting total electrodes into three electrode clusters (36 anterior, 37 middle, and 37 posterior). We performed the same linear regression analysis to search for the time points where the regression slope of tuning-curve slope values over sequence was significantly positive (see above, Materials and Methods). Only when the significant time cluster was found, tuning-curve slope values at each sequential position were averaged within the significant time cluster. The linearly increasing trend of mean-coding accuracy was not identified in the posterior region cluster (Fig. 6a), although the neural representation of the mean orientation gradually became more precise as a function of sequential position in the anterior and central regions (Fig. 6b,c). Specifically in the anterior electrode cluster, the update of the mean orientation occurred every 0.16 s after each sequential stimulus onset as shown in the highlighted time cluster in Figure 6c. This indicates that the mean orientation is updated regularly in frontal region. On the other hand, the sequential update process occurred at two separate highlighted time clusters ∼0.16 s and 0.3 s in the middle electrode cluster (Fig. 6b). This suggests that the rate of evidence accumulation is not fixed in the parietal region. Note that no bar graphs were plotted in the posterior electrode cluster because there was not a single time point where the regression slope of tuning-curve slope values over sequence was significantly positive in both variance conditions. These results are in line with previous studies showing that prefrontal and parietal cortex encode task-general information as well as task-specific information (Swaminathan and Freedman, 2012; Ester et al., 2015; Sarma et al., 2016; Kim et al., 2017; Oh et al., 2019).
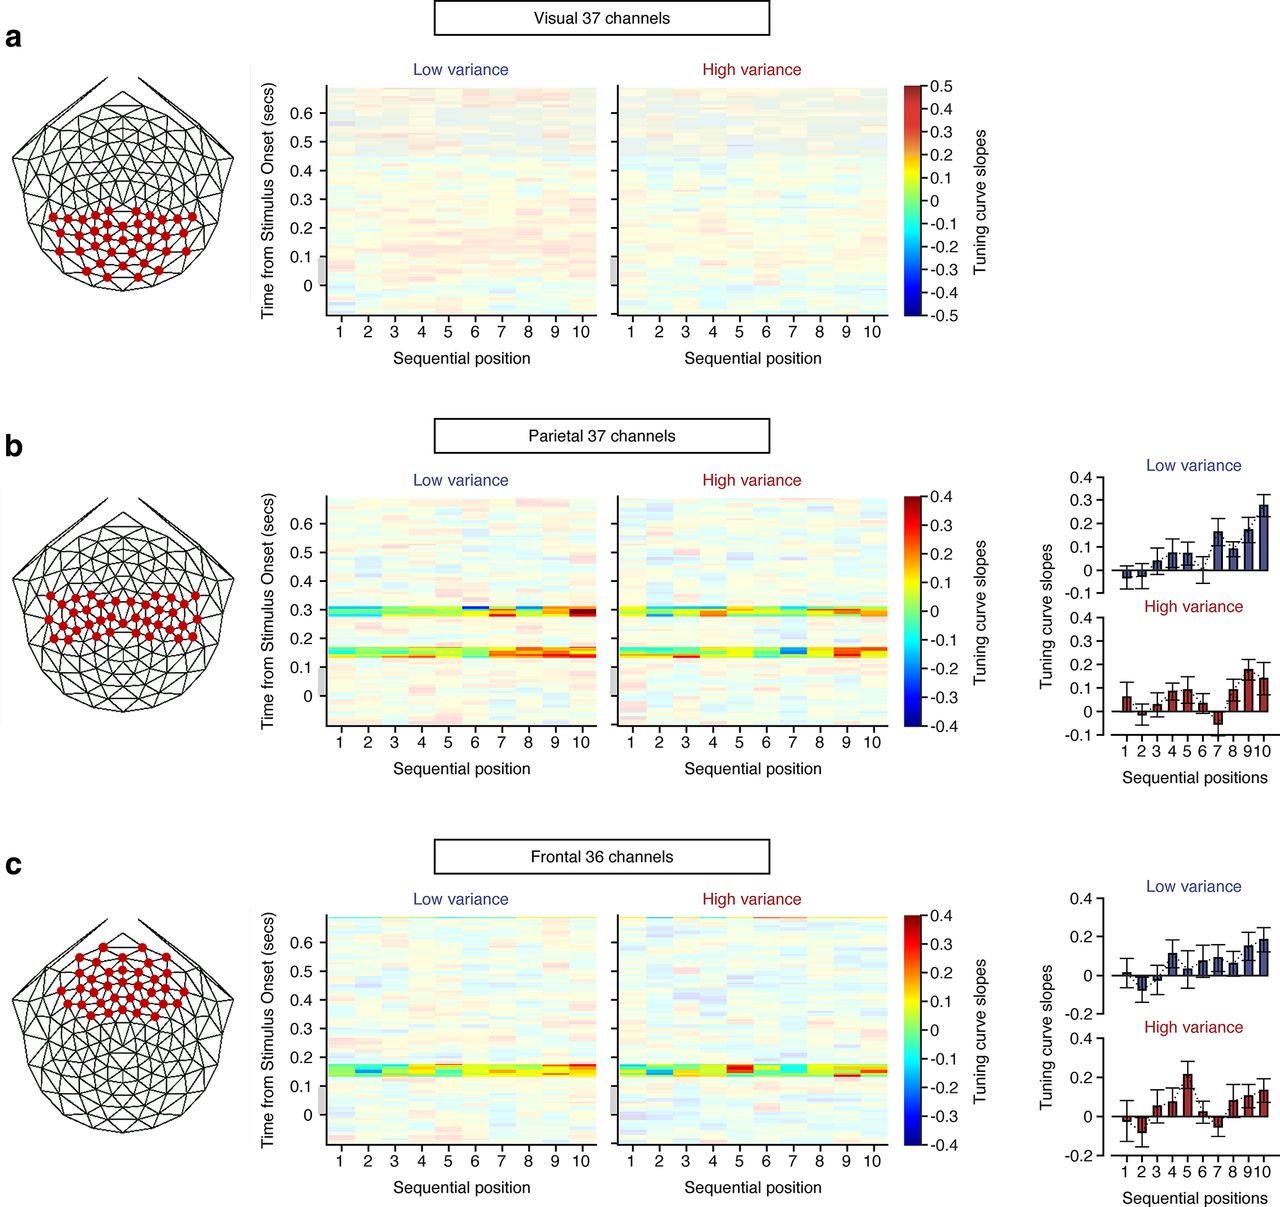
Temporal dynamics of the reconstructed tuning curves of mean orientation for visual, parietal, and frontal electrode clusters indicated by red dots (a–c, left). a, Middle, The time-resolved tuning-curve slopes with respect to the mean orientation at 10 sequential positions in the visual region for low-variance and high-variance conditions, respectively. The transparency mask highlights the time clusters where linear regression slopes across sequential positions are significantly positive for all trials, regardless of their variance conditions (see above, Materials and Methods). Note that there is no significant time cluster in the visual region. Gray bars represent the time period when stimulus was presented. b, Middle, The time-resolved tuning-curve slopes with respect to the mean orientation at 10 sequential positions in the parietal region for low-variance and high-variance conditions, respectively. There are two significant time clusters in the parietal region. Right, Top and bottom graphs indicate tuning-curve slope bars as a function of a sequential position averaged across all time points in the two significant time clusters, for low-variance and high-variance conditions, respectively. c, Midde, The time-resolved tuning-curve slopes with respect to the mean orientation at 10 sequential positions in the frontal region for low-variance and high-variance conditions, respectively. There is one significant time cluster in the frontal region. Right, Top and bottom graphs indicate tuning-curve slope bars as a function of a sequential position averaged across all time points in the significant time cluster for low-variance and high-variance conditions, respectively. Error bars in indicate ±1 SEM (b, c).
Caution is necessary regarding the underlying neural sources of the sequential updates because we focused our analyses on the full EEG signals above 2 Hz to minimize the effect of the physically driven SSVEP at the stimulus presentation frequency on the representational dynamics (see above, Materials and Methods). The analyzed multivariate EEG signals above 2 Hz are still a mixture of exogenous higher harmonic SSVEPs and endogenous oscillatory signals that cannot be completely disentangled from each other. Especially the strong stimulus-driven SSVEP harmonics appeared in the posterior electrode cluster not in the middle and anterior electrode clusters. In light of these points, the fact that the linearly increasing trend of mean-coding accuracy was not identified in the posterior electrode cluster strongly suggests that the widespread endogenous rather than exogenous dynamic network activity underlies the sequential averaging process especially in frontoparietal region. The fact that the mean-coding accuracy extracted from the EEG signals including low-frequency activity (<2 Hz) did not linearly increase across sequential positions (data not shown) also suggests that the sequential integration is not because of the high signal-to-noise ratio of SSVEP at physically driven stimulation frequency, although this SSVEP component may still play a role in resetting the update time points. Prior neurophysiological studies suggest that large-scale dynamic network interactions that span multiple brain regions are involved in various perceptual and cognitive processes (Donner et al., 2007; Pesaran et al., 2008; Siegel et al., 2012; Zhang et al., 2018).
Discussion
To probe the mechanisms of sequential averaging, we combined computational modeling of behavioral data with a multivariate pattern analysis that visualized how the neural representation of the mean orientation developed while viewing a sequence of differently oriented Gabor stimuli. The pattern analysis revealed that the dynamically evolving patterns of the stimulus-evoked EEG activities encoded the mean orientation as well as the stimulus orientation (Figs. 3e, 4a). Regardless of whether the variance of the individual stimulus orientations was low or high, the neural representations of individual stimulus orientations were equally precise (Fig. 3d), and the tuning-curve slope of the mean orientation increased gradually across the 10 sequential positions (Fig. 4c,d). This linearly increasing trend was steeper in the low-variance than in the high-variance condition (Fig. 4e). These results are consistent with the sequential update model, which predicted that multiple stimuli would be sequentially integrated regardless of stimulus variance, but high stimulus variance would make the updating noisier (Fig. 2a,b). Together, these findings suggest that environmental volatility mainly influences the noisiness in integrating sequential stimuli and the encoding quality of the mean information toward the end of the sequence, leading to behavioral difference in perceptual mean judgment between the low- and high-variance conditions.
Our results have a number of implications for understanding sequential averaging mechanisms. First, the manner of sequential information processing may depend on the demand of the behavioral task. The present study required observers to integrate a series of briefly presented multiple stimuli, which is likely to make the task more challenging in the high-variance condition than in the low-variance condition. This demanding task under time pressure may not allow observers to spend more time integrating the current stimulus with the previous stimulus, eventually leading to less precise mean information in the high-variance condition. This is in line with previous studies demonstrating the detrimental effects of time pressure on overall decision quality, with the general finding that individuals perform significantly worse under time pressure (Payne et al., 1988; Sutter et al., 2003; Kocher and Sutter, 2006; Ahituv et al., 1998). However, when the task is to integrate information on the continuously changing single-target stimulus rather than across different successive stimuli as in the current study, observers change the perceptual integration time scale during the perceptual discrimination task (Burr and Santoro, 2001; Kiani et al., 2008). A study on sound texture perception revealed an obligatory multisecond averaging process whose duration could not be controlled at will and was much longer for highly variable textures (McWalter and McDermott, 2018). In another perceptual decision-making study, where one of the two concurrently presented streams of luminance changing disks showed a brief increment against the mean luminance of the visual stream, observers used an integration time scale adapted to the target signal duration (Ossmy et al., 2013). Unlike these studies that revealed the time required for a single-target signal integration, the current study revealed the time required for each sequential stimulus to be integrated with the following stimulus. On the other hand, when the task is to categorize or identify the current stimulus instead of integrating the serially presented stimuli, human observers rely on their working memory capacity to remember a few recent stimuli in a volatile environment rather than a sequential update strategy (Summerfield et al., 2011; Fischer and Whitney, 2014; Laquitaine and Gardner, 2018). In this case, the sequential updating may not be efficient because it runs the risk of pooling stimuli with distinct statistical properties. In contrast, when estimating the mean orientation of the visual stream as accurately as possible, it may be advantageous to keep track of every single stimulus regardless of variability. Thus, previous studies and our results indicate that the task demand adaptively shapes the evidence integration computation even under the same volatile environment. In our case, volatility did not change the integration time scale but only added uncertainty to the sequential update process shaped by the task goal of extracting the mean across time.
The appearance of the increasingly precise mean information at specific delays after each stimulus onset (Figs. 4c, 6b,c) indicated that the integration of successive stimuli occurred regularly. In frontal region, the update of the mean orientation occurred every 0.16 s after each sequential stimulus onset (Fig. 6c, highlighted time cluster). In parietal region (Fig. 6b) and all electrodes (Fig. 4c), the sequential update process occurred at two separate highlighted time clusters of ∼0.16 s and 0.3 s. These results suggest that the sequential update arises with either a shorter latency in the anterior brain area than in the middle brain area or an equal latency in both brain areas. In any case, the updated mean orientation was encoded in the anterior brain area no later than in the middle brain area, suggesting either an early or simultaneous involvement of the anterior brain area in the sequential perceptual averaging process. A study on binary perceptual motion categorization similarly showed that prefrontal cortex leads the decision process when a monkey determines whether sequentially presented stimuli belong to the same motion category during a delayed match-to-category task (Zhou et al., 2021). This neurophysiological study found that neurons in both prefrontal and parietal cortex are involved in categorical encodings of individual stimuli, but the prefrontal cortex appears more directly involved than the parietal cortex in transforming categorical encoding into the abstract match/nonmatch decision by integrating the previously presented stimulus with the currently visible stimulus. In the current study, the shorter latency of regular update in the anterior brain area may imply a flow of sequentially integrated information from the anterior brain area to other brain areas. Because observers used the same integration time scale in both variance conditions at the expense of the precise integration of highly variable stimuli, our findings provide neural mechanisms to differentially accumulate increasingly abstract features from a concrete piece of information across the cortical hierarchy depending on environmental volatility.
Our findings also shed light on whether all individual stimuli are encoded during sequential averaging. Previous behavioral studies on sequential averaging indicate that observers use only a subset of stimuli to accomplish mean representation without explicitly encoding every individual stimulus (Corbett and Oriet, 2011; Gorea et al., 2014). However, our finding that spatially distributed EEG activities encoded individual stimulus orientations in both variance conditions with an equivalent precision suggests the robust encoding of individual stimuli during a sequential averaging task. Thus, one possibility for the difference between our results and those of other behavioral studies is that although individual orientations are transiently encoded in the visual system, observers do not form robust memories of individual orientations so they cannot be reported or recognized later after the sequence. The gradually increasing mean-coding accuracy across sequential positions also suggests that each stimulus is sequentially integrated in both variance conditions (Fig. 4c,d). This overall trend of approximately linear improvement in the mean representation over sequence is in line with neuroimaging and behavioral studies based on the sequential update model framework (Cheadle et al., 2014; Navajas et al., 2017). From the perspective of the sequential update model, the subsampling strategy can be regarded as a special case of the weighted whole-set averaging strategy (Juni et al., 2012; Hubert-Wallander and Boynton, 2015), when some of the encoded stimuli are integrated with no weight for computing the mean of the sequence. Nevertheless, it is unlikely that only a subset of the encoded stimuli is integrated to accomplish mean representation because all stimuli in the sequence had positive weights (Fig. 1d). In fact, this regression bias toward the mean of the stimulus distribution is one of the most robust empirical regularities in studies of human perceptual judgment across various perceptual domains (Hollingworth, 1910; Stevens and Greenbaum, 1966; Oh et al., 2019; Xiang et al., 2021). Especially in Oh et al.'s (2019) work on visual working memory, the neural representation of mean orientation emerges, although there was no task requirement of judging perceptual mean orientation of concurrently presented oriented bars, leading to the participant's biased judgment on target orientation toward the ensemble mean orientation. Additionally, many previous studies reported bias effects of recent stimulation history on perceptual process such as serial dependence (Summerfield et al., 2011; Kiyonaga et al., 2017; Pascucci et al., 2019). Thus, it is highly likely that both the regression effect and the recent history effect make it challenging for observers to perceive and maintain the stimulus attribute as it is. The perceptual distortion of individual stimuli because of these bias effects is another possible factor for contributing to the incorrect or failed report of a single item after the sequence in previous behavioral studies (Corbett and Oriet, 2011; Gorea et al., 2014).
Finally, future work on sequential information processing will benefit from characterizing the representational dynamics of the sequential averaging process by systematically manipulating temporal regularity. Such studies could exploit heterochronous streams of events to clarify whether the sequentially updated mean information is reflected in exogenous or endogenous oscillatory signals. This manipulation will allow us to characterize electrophysiological signatures of the sequential averaging mechanism by measuring whether the mean-coding accuracy gradually increases or fluctuates along sequential positions. When observers maintain the sequential update strategy, one can probe whether their integration time scale adaptively changes with temporal regularity and environmental volatility. Further, it is important to examine whether the mean information develops automatically over sequence as a function of task. For example, by changing both orientations and spatial frequencies in the stream of Gabor patches and asking observers to report the mean orientation or the mean spatial frequency or one particular item's spatial frequency, one can examine the task dependency of the sequential averaging process.
In summary, stimulus-specific coding is regularly transformed into a brief coding of the integrated information that becomes closer to the sequential mean toward the end of the sequence for the appropriate behavioral response during a sequential averaging task. Therefore, the sequential averaging process can be best characterized as perceptual dynamics that swings back and forth between evidence sampling and integration for the perceptual judgment of the mean at the end of the sequence. Finally, the steeper linear trend of the mean tuning-curve slope across sequential positions in the low- rather than in the high-variance condition suggests that the multivariate activity pattern dynamics underlie the differential sequential averaging process depending on environmental variability.
Footnotes
This work was supported by the Institute of Basic Science Grants IBS-R001-D2-a00, IBS-R001-D2-a01, and IBS-R015-D1. We thank Prof. Satoru Suzuki for comments on earlier versions of this manuscript.
The authors declare no competing financial interests.
- Correspondence should be addressed to Yee-Joon Kim at joon{at}ibs.re.kr


