

Abstract
We investigated the relationship between neurochemical and hemodynamic responses as a function of image contrast in the human primary visual cortex (V1). Simultaneously acquired BOLD-fMRI and single voxel proton MR spectroscopy signals were measured in V1 of 24 healthy human participants of either sex at 7 tesla field strength, in response to presentations (64 s blocks) of different levels of image contrast (3%, 12.5%, 50%, 100%). Our results suggest that complementary measures of neurotransmission and energy metabolism are in partial agreement: BOLD and glutamate signals were linear with image contrast; however, a significant increase in glutamate concentration was evident only at the highest intensity level. In contrast, GABA signals were steady across all intensity levels. These results suggest that neurochemical concentrations are maintained at lower ranges of contrast levels, which match the statistics of natural vision, and that high stimulus intensity may be critical to increase sensitivity to visually modulated glutamate signals in the early visual cortex using MR spectroscopy.
SIGNIFICANCE STATEMENT Glutamate and GABA are the major excitatory and inhibitory neurotransmitters of the brain. To better understand the relationship between MRS-visible neurochemicals, the BOLD signal change, and stimulus intensity, we measured combined neurochemical and BOLD signals (combined fMRI-MRS) to different image contrasts in human V1 at 7 tesla. While a linear change to contrast was present for both signals, the increase in glutamate was significant only at the highest stimulus intensity. These results suggest that hemodynamic and neurochemical signals reflect common metabolic markers of neural activity, whereas the mismatch at lower contrast levels may indicate a sensitivity threshold for detecting neurochemical changes during visual processing. Our results highlight the challenge and importance of reconciling cellular and metabolic measures of neural activity in the human brain.
Introduction
Image contrast is a fundamental component of the visual world. Contrast is defined by the difference between the bright and dark parts of an image, relative to mean luminance. Increasing contrast makes objects more visible, yet the distribution of contrasts present in our daily visual diet is skewed: low and medium contrast levels dominate with only rare occurrences of high contrasts (Brady and Field, 2000). Single-unit recordings have demonstrated that the activity of V1 neurons increases monotonically with contrast and saturates at higher contrasts (Albrecht and Hamilton, 1982). In the human visual cortex, the contrast response function has been used to confirm that cortical responses increase with contrast (Boynton et al., 1996; Kastner et al., 2004), and to study the physiological signals contributing to the BOLD response (Logothetis et al., 2001).
The BOLD response is a complex measure of blood flow, blood volume, and oxygen demand that occurs as a consequence of change in energy demand due to neuronal activity. Although much work has been done in quantifying properties of the hemodynamic response (Hall et al., 2016), many fundamental questions remain, limiting the interpretability of the BOLD signal. In particular, both excitatory and inhibitory signaling consumes energy, causing increases in local BOLD signal (Logothetis and Wandell, 2004; Vazquez et al., 2018). Concomitant measurement of glutamate and GABA, respectively, the major excitatory and inhibitory transmitters in the brain, could disambiguate the cellular events underlying the hemodynamic response to specific functional states (Ip et al., 2017). Glutamate and GABA can be measured noninvasively and in vivo using magnetic resonance spectroscopy (MRS). While it is tempting to directly relate neuronal excitation and inhibition neurotransmission to MRS-measured glutamate and GABA, care has to be taken in their interpretation. The MRS-visible signal is composed of the total pool of neurochemicals in cortical tissue; for glutamate, this means that the signal reflects both glutamate used for neurotransmission as well as glutamate involved in energy metabolism (Hyder et al., 2006).
Functional MRS studies have shown that glutamate increases with controlled functional stimulation (Stanley and Raz, 2018). In the visual cortex, glutamate concentrations in V1 increase during sustained (Mangia et al., 2006; Lin et al., 2012; Schaller et al., 2013; Bednarík et al., 2015; Kurcyus et al., 2018) and short periods of visual stimulation (Apsvalka et al., 2015; Ip et al., 2017). However, dynamic signals are often elicited using high-intensity, prolonged presentations, such as high contrast flickering checkerboards (Mangia et al., 2006; Lin et al., 2012; Bednarík et al., 2015). While such stimulation evokes a reliable modulation of neural activity, little is understood about the relationship between the amplitude of neurochemical changes to more naturally occurring, intermediate, image contrast levels.
The primary goal of this study is to understand how neuronal signals reflect processing of graded image contrast levels, by looking at neurochemical as well as hemodynamic responses to functional stimulation in the human early visual cortex. We used short stimulus blocks (64 s) to probe neural responses on a time scale relevant to conventional fMRI experiments. To allow a close comparison of complementary measures of neural activity over a range of naturally occurring image contrasts, we used a combined fMRI-MRS sequence (Ip et al., 2017) that acquires BOLD fMRI and MR spectroscopy data within the same measurement period (4 s).
Materials and Methods
Participants.
Twenty-nine volunteers (11 females, mean age ± SD: 25.83 ± 6.04 years), including two of the authors, were recruited for the study. All were healthy normal participants who had normal or corrected-to-normal vision and were safe to go into the 7T MRI scanner. No additional screening for neurological or psychiatric illness was performed. Three participants were discarded because the shape of the occipital cortex required the voxel to be placed anteriorly to avoid being contaminated by the sagittal sinus, the tentorium, or the border of the brain. This anterior placement led to poor overlap with the region of BOLD activation evoked by the visual stimulation. Two participants were identified as outliers using the FWHM of the total creatine singlet at 3.03 ppm and the boxplot function in MATLAB (R2017b, The MathWorks; RRID:SCR_001622). The final dataset was composed of 24 participants. All 24 participants took part in experiments for contrast levels 3% and 100%, 18 of 24 participated in the 12.5% contrast, and 21 of 24 participated in the 50% contrast experiment. We were not able to measure all four contrast levels for all 24 participants due to time limitations during data collection. Participants were reimbursed for their time. All gave informed written consent, approved by the University of Oxford Research Ethics Committee (MSD-IDREC-C1-2014-146).
Magnetic resonance (MR) protocol.
MR data were acquired using a 7T whole-body (Siemens) MR scanner with a Nova Medical head coil (single transmit, 32 receive channels). A T1-weighted structural scan was acquired for each participant with a 1 mm isotropic resolution (MPRAGE, repetition time TR = 2.2 s, inversion time TI = 1.05 s, echo time TE = 2.82 ms, FOV = 192 × 192 × 176 mm, flip angle = 7°, total acquisition time = 171 s) to permit placement of the visual cortex voxel of interest. A 2 × 2 × 2 cm (8 cm3) MRS voxel of interest was positioned in the occipital lobe, centered on the calcarine sulcus and at the midline to include V1 in both hemispheres (Fig. 1A). fMRI and MRS data were acquired using a combined fMRI-MRS sequence (Ip et al., 2017), yielding a slab of EPI (3D EPI, resolution = 4.3 × 4.3 × 4.3 mm; flip angle = 5°, repetition time TRepi = 40 ms, TE = 25 ms, FOV = 240 mm, 16 slices) and an MR spectrum upon each TR. For each image contrast level, 128 spectral averages were acquired using short-echo semilocalization by adiabatic selective refocusing (semi-LASER) pulse sequence (TE = 36 ms, TRmrs = 4 s) with VAPOR water suppression and outer volume suppression (Oz and Tkác, 2011; van de Bank et al., 2015). Data were collected as a single free induction decay per excitation. A dielectric pad measuring 110 × 110 × 5 mm3 containing a suspension of barium titanate (BaTiO3) and deuterated water (mass-mass ratio of 3:1) was placed behind the occiput of each participant (Luo et al., 2013; Lemke et al., 2015) to increase the effective transmit field efficiency close to the pad (Teeuwisse et al., 2012).

Magnetic resonance spectroscopy (MRS) voxel location and visual stimulation paradigm. A, Representative 2 × 2 × 2 cm3 MRS voxel of interest (blue square) presented on a standard brain. B, Visual stimuli were shown in a block design, with each block lasting 64 s. Four alternations of baseline and stimulation were presented in each run (total time = 512 s). Stimulation conditions consisted of contrast-reversing flashing checkerboards (3%, 12.5%, 50%, 100%) displayed in separate runs and counterbalanced for order across participants. The baseline condition was a blank mid-gray screen with a fixation dot.
Task and procedure.
Visual stimuli were designed to modulate responses in the primary visual cortex, where the MRS voxel of interest was placed (Fig. 1A). Stimuli were generated on a Mac Book Pro workstation using MATLAB (RRID:SCR_001622) and Psychtoolbox-3 (Brainard, 1997) (RRID:SCR_002881) and displayed on a gamma-linearized Eiki LC-XL100 projector (resolution: 1024 × 768; refresh rate: 60 Hz). Participants viewed the stimuli through 45° angled mirrors on a back-projection screen (viewing distance: 60 cm). As shown in Figure 1B, visual stimuli were full-field checkerboards, contrast reversing at 8 Hz (stimulus size = 19.82° × 14.25°). Four contrast levels were used (3.125%, 12.5%, 50%, and 100%). The baseline condition was a blank mid-gray screen (528 cd/m2) with a fixation dot. Each run consisted of four alternations of baseline (64 s) followed by flashing checkerboards (64 s). Contrast levels were presented in separate runs and pseudo-randomized for order and carryover effects across participants. Michelson contrast was defined as (Lmax − Lmin)/(Lmax + Lmin) × 100, where Lmax indicates the maximum luminance value of the checkerboard and Lmin indicates the minimum value. A central fixation dot was displayed (white with black border, size = 0.75°) throughout the experiment. Participants were instructed to maintain fixation and press any button on an MRI-safe button box when the marker turned red (500 ms, ∼ once in every 3 s).
fMRI analysis.
fMRI data were analyzed using FEAT (FMRI Expert Analysis Tool) version 6.00, part of the FSL software distribution (FMRIB's Software Library, www.fmrib.ox.ac.uk/fsl; RRID:SCR_002823). Preprocessing included motion correction MCFLIRT (Jenkinson et al., 2002); nonbrain tissue extraction (Smith, 2002); and no spatial smoothing, grand-mean intensity normalization, and high pass temporal filtering (Gaussian-weighted least-squares straight line fitting, main experiment = 132 s). Registration of EPI to an initial 2 mm structural image used 6 degrees-of-freedom, followed by registration to the 1 mm isotropic T1-weighted structural image using boundary-based registration in FLIRT (Jenkinson and Smith, 2001; Jenkinson et al., 2002). BOLD change in the MRS voxel was calculated using Featquery.
Metabolite quantification.
Preprocessing for raw MRS data was performed in MRspa (https://www.cmrr.umn.edu/downloads/mrspa/; RRID:SCR_017292) and included eddy current correction, frequency alignment to the tNAA singlet at 2.01 ppm, and phase correction using a least-square algorithm. MR spectra for individual participants are shown in Figure 2. Metabolites within the chemical shift range of 0.5–4.5 were analyzed using LCModel (Provencher, 1993, 2001) (RRID:SCR_014455). Consistent with our previous paper (Ip et al., 2017), we excluded the first two time averages (2 TR = 8 s) of each block, under the assumption that metabolite measurements are unstable during the period where the BOLD signal is known to peak (Buxton et al., 2004). This made 56 spectral averages available for each participant and condition. Individual neurochemical responses were calculated as activation − baseline concentration across the 56 spectral averages. Group responses were the average across individual participant values. Metabolite levels were estimated using a basis set of alanine, ascorbate/vitamin C, aspartate, glycerophosphorylcholine, phosphorylcholine, creatine, phosphocreatine, GABA, glucose, glutamine, glutamate, glutathione, inositol, lactate, phosphoethanolamine, scyllo-inositol, taurine, N-acetyl-aspartate multiplet, N-acetyl-aspartate singlet, acetyl moiety of N-acetylaspartylglutamate, aspartyl moiety of NAAG, and glutamate moiety of NAAG. Metabolites with group average Cramér-Rao lower bounds > 30% were excluded from further analysis (alanine, aspartate, glycerophosphorylcholine, glucose, lactate, aspartyl moiety of NAAG, glutamate moiety of NAAG). Macromolecule inclusion procedures were performed as by Bednarík et al. (2015). The percentage of CSF in the MRS voxel was determined using automated tissue segmentation (FSL version 6.0 FAST) (Zhang et al., 2001) and custom-written scripts, and metabolite values were corrected for the amount of CSF using the equation: [Mcorr] = [M] × (1/[1 − fCSF]), where Mcorr is the corrected metabolite concentration, M is the metabolite concentration from LCModel, and fCSF is the CSF fraction (Deelchand et al., 2015; Lunghi et al., 2015). Metabolite concentrations were quantified relative to the unsuppressed water reference collected from the same volume of interest (Gasparovic et al., 2006; Provencher, 2013), and the response calculated as change relative to baseline (stimulation − baseline). All metabolite values are reported in institutional units (iu). Quantification of time courses was as follows: for each participant and experimental condition, a time course with a resolution of 16 s was generated by averaging across each four consecutive data points (32 data points/condition). Data were linearly detrended (highpass temporal filter = 128 s) to match the parameters used for BOLD-fMRI processing, z-normalized, and smoothed using a 3-point moving average (smooth.m, MATLAB R2012a). To generate BOLD signal time courses, data were averaged across four data points and then z-normalized.

Individual participants' raw MR spectra at different contrast levels. x axis indicates chemical shift axis in parts per million (ppm). The four different contrast levels are indicated by the position on the y axis, with image contrast decreasing from top to bottom.
MR metabolites are corrected for BOLD effects.
We identified the impact of BOLD effects in metabolite spectra by estimating the difference in total creatine (tCr) singlet (3.03 ppm) line width (ΔtCrLW) during stimulation and baseline blocks (Ip et al., 2017). We found a significant effect of line width narrowing across contrast levels (one-sample t test, t(23) = 4.869, p < 0.001). On average, visual stimulation narrowed ΔtCrLW by 0.098 Hz, equivalent to 0.956 ± 0.20%, compared with baseline periods (stimulation line width: 10.38 ± 0.18 Hz; baseline line width: 10.487 ± 0.18 Hz). To correct for the BOLD effect, metabolite spectra collected during each stimulation condition were line broadened by the ΔtCrLW. No linear relationship was present between ΔtCrLW and contrast levels (r = 0.60, p = 0.4), or ΔtCrLW and the BOLD response (r = 0.72, p = 0.28). Metabolite response data were highly correlated (glutamate, r = 0.90, p < 0.001; GABA, r = 0.872, p < 0.001) before and after BOLD correction. The overall effect of BOLD correction is a slight reduction in metabolite concentrations during stimulation (Mangia et al., 2006). Only BOLD-corrected metabolite levels are reported, accounting for T2*-induced line width changes in MRS spectra (Zhu and Chen, 2001; Bednarík et al., 2015; Ip et al., 2017).
Statistical analysis.
The Lilliefors test (lillietest.m, in MATLAB R2012a) was used to test the null hypothesis that group responses from %BOLD signal and neurochemical responses come from a normal distribution. The test did not reject the null hypothesis at the α = 0.05 significance level, so parametric tests were used. Correlations were quantified using Pearson's linear correlation coefficient r. The R package (R Core Team, 2017) (RRID:SCR_001905) and lme4 (Bates et al., 2015) (RRID:SCR_015654) were used to perform a linear mixed-model analysis for repeated measures of the relationship between signal change and image contrast (Winter, 2013). As fixed factors, we used “image contrast” (0.03, 0.125, 0.5, 1) and “gender” (female, male). As random factors, we entered “participant” to account for repeated measures within participants. A likelihood ratio test using the ANOVA function was used to compare the full model, including the effect of interest, with the null model, excluding the effect of interest. The threshold for statistical significance was set at α = 0.05.
Results
The flashing checkerboard evoked reliable BOLD responses in the occipital cortex, as shown in Figure 3A. Across the 24 participants, 94.08 ± 1.455% of the MRS voxel was within regions modulated by the highest image contrast. Compared with the response to mid-gray, the 100% flashing checkerboard increased the BOLD signal by 2.19 ± 0.224% inside the MRS voxel. All participants were tested at the 3% and 100% contrasts, whereas the intermediate contrasts were collected for a subset of participants (12.5%: n = 18; 50%: n = 21). Performance of the fixation task was on average 96.51 ± 2.30% correct across conditions, demonstrating that participants maintained high levels of alertness and attention to the fixation dot. There was no significant effect of contrast level on behavioral performance: χ2(1) = 0.0098, p = 0.921.

Each repetition time (TR) of the combined fMRI-MRS sequence provides a BOLD-fMRI image and an MRS spectrum. A, Representative V1 MRS-voxel (blue) presented on a standard brain with group response to a 100% contrast checkerboard > mid-gray baseline (z statistic > 3.1, corrected cluster significance threshold of p = 0.05). B, Representative simultaneously acquired MR spectrum with LCModel fits to individual metabolites.
Glutamate and BOLD-fMRI contrast response functions are linear
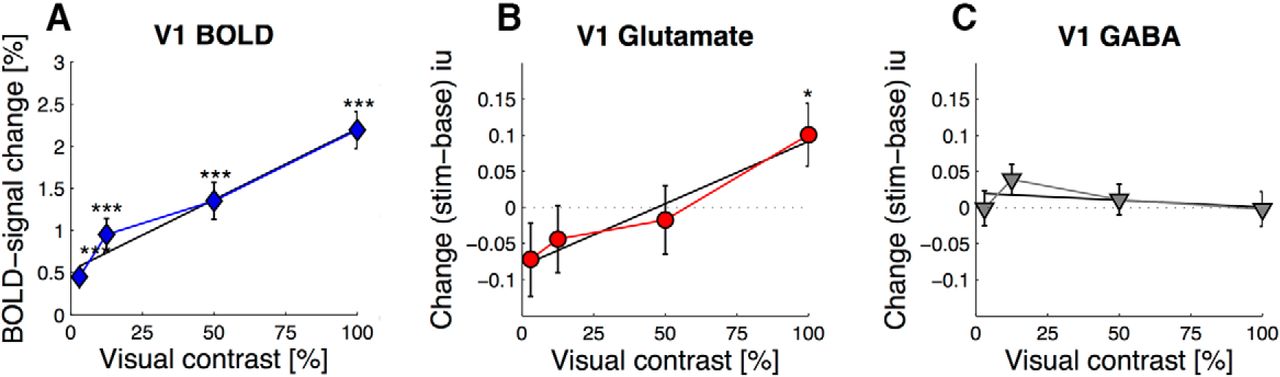
Glutamate and GABA across conditions were estimated at 7.35 ± 0.113 iu, 4.23 ± 0.109% CRLB and 0.79 ± 0.029 iu, 29.93 ± 1.298% CRLB, respectively. We expected to see that visual cortex BOLD changes scale monotonically with visual contrast levels (Boynton et al., 1996). To confirm this relationship, we plotted the average BOLD signal change as function of contrast levels, and fit a linear model to the data (Fig. 4A, blue diamonds). This analysis shows that the relationship between BOLD signal change and contrast is best described by a linear model (r = 0.98, p = 0.019). There was a significant difference in %BOLD signal change between contrast levels: χ2(1) = 87.054, p < 0.0001.

A, Group V1 %BOLD signal change (blue diamonds) from inside the MRS voxel plotted over visual contrast. B, BOLD-corrected Group V1 glutamate (red circles) and (C) GABA (gray triangles) contrast response functions. Solid black lines indicate best fitting linear model. Error bar indicates ± SEM across participants. One-sample t test against baseline: *p < 0.05; ***p < 0.001.
The same analysis was then applied to changes in visual cortex metabolites. First, changes in metabolite concentrations were calculated by subtracting metabolite baseline from stimulation levels. Changes were then plotted as a function of visual contrast. Figure 4B shows a linear relationship between ΔGlu (red circles) and visual contrast levels (r = 0.975, p = 0.024). ΔGlu for 100% contrast was significantly different from baseline (0.100 ± 0.044 iu, one-sample t test, t(23) = 2.278, p = 0.0323). Glutamate signal change was equivalent to 1.45 ± 0.603% from baseline. We found a significant effect of image contrast on ΔGlu: χ2(1) = 7.6045, p = 0.005822. These changes were not predicted by interindividual differences in baseline glutamate concentrations or the BOLD response within conditions. We found no linear relationship between image contrast and glutamate quality of model fit (Cramér-Rao lower bounds, r = 0.071, p = 0.929), demonstrating that the result was not due to differences in data quality between stimulation conditions. The result was highly specific to glutamate, as there was no linear relationship between Δ concentration and visual contrast for GABA (Fig. 4C, gray inverted triangles; r = −0.42, p = 0.58), or any of the other metabolites that were quantified.
Relationship between glutamate and the percentage BOLD signal change
To investigate further the relationship between ΔGlu and the %BOLD signal change, we performed correlation analyses on group and interindividual data. The average ΔGlu was significantly and positively correlated with %BOLD signal change amplitude (Fig. 5; r = 0.974, p = 0.025). There were no correlations between any other metabolite change and the %BOLD signal change. We did not find any correlations between interindividual ΔGlu and the %BOLD signal change. To investigate whether correlations between glutamate and the BOLD-fMRI signal time courses were present, we correlated the moment-to-moment variation in uncorrected glutamate concentrations at a resolution of 16 s with the BOLD-fMRI time course. While glutamate and BOLD response to 100% contrast covaried at the beginning of the experiment, the pattern decreased toward the end (data not shown), and the overall correlation across the entire scan did not reach statistical significance (r = 0.29, p = 0.107).

Group glutamate change is plotted over %BOLD-signal change. Solid line indicates best fitting linear model. Open circles represent group average data. Error bars indicate ± SEM.
Discussion
Here we have shown a clear increase in glutamate in response to visual stimulation with the highest contrast visual stimulus, whereas the BOLD signal increased continuously with image contrast. We show that these changes take place on a time scale similar to that of the BOLD response and that they are specific to glutamate. Lower contrast levels were associated with steady levels of glutamate. The contrast content of natural images rarely has components with 100% contrast (van der Schaaf and van Hateren, 1996). When high contrast changes occur in the image, they are generally associated with differences in local luminance of the scene, which are diminished by retinal gain control mechanisms. In that context, our measures suggest that the neurochemical response of the visual cortex is carefully maintained over the important range of ecologically relevant image contrasts.
Our results suggest that average levels of BOLD change and glutamate responses are in partial agreement. While we find increases in both measures of neuronal activity, the BOLD response is above baseline for all image contrasts, whereas glutamate increases only for the highest level. For lower image contrasts, glutamate is below baseline, although not significantly so. These changes are unlikely due to negative BOLD signal (Boillat et al., 2019), as BOLD responses were significantly higher than baseline at all contrast levels (Fig. 4A). While our previous study revealed a change of ∼2% using blocks of 64 s, the intermediate stimulus contrast may have revealed the sensitivity limits of how much glutamate change can be detected in human V1 using the current methods. Sustained stimulation protocols have shown glutamate changes on the order of ∼2%-4% (Mangia et al., 2006; Lin et al., 2012; Schaller et al., 2013; Bednarík et al., 2015) after several minutes of high-intensity visual stimulation. In terms of sensitivity, functional MRS is far behind the temporal and spatial resolution of BOLD-fMRI (Stanley and Raz, 2018). Signal pooled over a large amount of cortical tissue is needed to measure metabolites. A better understanding on what drives changes in neurochemicals, combined with MRS imaging sequences with increased spatial resolution, could be used in the future to study the basic properties of functional neurochemical signals. Our study suggests that strong stimulus intensity correlates with MRS-visible glutamate changes during visual processing.
Glutamate resides in different cellular compartments at widely different concentrations, and MRS cannot distinguish between different cellular compartments. This lack of specificity makes it difficult to establish whether dynamic changes in glutamate reflect metabolic or synaptic processes. Teasing these two apart is challenging, as glutamate pools are functionally coupled: there is a 1:1 relationship between glucose metabolism and the glutamate − glutamine cycle (Shen et al., 1999). Whereas the time scale of glutamate increase in the metabolic pool is slow, on the order of ∼20 min (Maddock et al., 2016), synaptic transmission occurs on the time scale of milliseconds. In previous work (Ip et al., 2017), we showed that MRS-visible modulation of glutamate takes place on a time scale of a few seconds, similar to that of BOLD.
Under normal conditions, glutamate is rapidly removed from the synapse by excitatory amino acid transporters to prevent excitotoxicity with glutamate concentration in the range of μm (Anderson and Swanson, 2000). Inside synaptic vesicles, glutamate reaches concentrations of ∼60 m (Burger et al., 1989). High-intensity visual stimulation could evoke simultaneous activation of a critical number of synapses, causing glutamate spillover (Kullmann et al., 1996; Yashiro et al., 2005) and a sudden increase in the ambient levels of extrasynaptic glutamate, in a process that renders glutamate more visible to MR measurements (Kauppinen and Williams, 1991; Apsvalka et al., 2015).
GABA signals remained constant across stimulus contrasts in our study. Our results are in line with recent findings showing that the average concentration of GABA during high contrast checkerboard stimulation was no different from a resting baseline (Kurcyus et al., 2018). Decreases in GABA with functional stimulation have been shown in the motor cortex using a sustained task (10 min hand clenching) and a GABA-edited sequence (Chen et al., 2017), whereas another study has found decreases in GABA in the visual cortex corresponding to a region of sustained negative BOLD response (Boillat et al., 2019). As GABAergic neurons represent 15%–30% of the total population (DeFelipe and Fariñas, 1992), sustained stimulation (Chen et al., 2017) and edited MRS sequences optimized for GABA, such as MEGA-PRESS (Mescher et al., 1998; Mullins et al., 2014), may be necessary to improve sensitivity to modulation of inhibitory activity in the early visual cortex.
While we found an increase in glutamate for 50% versus a black screen in our previous study (Ip et al., 2017), we did not find the same increase in the current study, where 50% image contrast was compared with a mid-gray screen. A mid-gray screen was used to match the average luminance between “stimulation” and “baseline” conditions, thereby isolating changes due to image contrast. Such differences in absolute luminance were present in previous studies, which have used black screens as baseline condition (Mangia et al., 2006; Lin et al., 2012; Schaller et al., 2013; Bednarík et al., 2015; Kurcyus et al., 2018). Neurons in the primary visual cortex may be differentially sensitive to changes in absolute luminance level and contrast: cells modulated by contrast can fail to respond to luminance changes and vice versa (Dai and Wang, 2012); and V1 neurons can respond faster to luminance than to contrast changes (Wang et al., 2015). It is possible that neural responses related to changes in absolute luminance between flashing checkerboard stimulation and black baseline blocks contributed to the dynamic neurochemical changes observed in previous studies (Mangia et al., 2006; Lin et al., 2012; Schaller et al., 2013; Bednarík et al., 2015; Ip et al., 2017; Kurcyus et al., 2018). Unlike most other fMRS studies, the stimulation period here was relatively short, presumably resulting in small amounts of glutamate release. It is possible that either prolonged stimulation or particularly intense stimulation can lead to this effect, but that more natural visual stimulation does not lead to significant changes in neurotransmitter concentrations in the normal brain. Our findings highlight the importance of the choice of stimulus intensity and baseline condition for functional MRS studies.
Unlike the hemodynamic signal, increases in glutamate neurotransmission are on the order of milliseconds and should in principle be detectable before any changes in blood flow and blood oxygenation. However, the noninvasive detection of metabolite changes using MRS is hampered by the low concentration of metabolites in cortical tissue, promoting the use of sustained stimulation protocols. These have demonstrated a slow peak in neurochemical response that occurs in the second half of 5 min blocks (Mangia et al., 2007; Schaller et al., 2013; Bednarík et al., 2015). Others find short-term increases in glutamate using special event-related designs: ∼300 ms (Apsvalka et al., 2015) or ∼1 s (Lally et al., 2014). Because we wanted to compare the BOLD-fMRI response with neurochemical changes, we made the assumption that the neurochemical response, like the BOLD-fMRI response, would be delayed in respect to stimulus onset. During the initial 8 s, the BOLD signal is known to exhibit an initial decrease followed by a transient increase (Hu and Yacoub, 2012) that is field strength-dependent (Yacoub et al., 2001). We therefore excluded the first 8 s of the neurochemical response a priori (Ip et al., 2017). However, as the block length in our study (64 s) is between event-related and sustained presentation designs, we also performed a control analysis of glutamate changes within the first 8 s of stimulus onset to look at short-term changes. No changes in glutamate were found in that initial 8 s period (p = 0.476). We also wanted to control for the possibility that the postprocessing (data reduction, line width broadening; see Materials and Methods) introduced changes into the data that were not present before. Hence, we analyzed our data with and without postprocessing steps. Results confirmed that glutamate increases to 100% visual contrast remained significant before and after the postprocessing steps (without, p = 0.009; vs with, p = 0.0323). Our results suggest that glutamate responses elicited using 64 s blocks of flashing checkerboards are delayed in respect to stimulus onset. Future studies may improve the sensitivity of functional MRS by accounting for the complexity of temporal dynamics using data-derived models.
In conclusion, our study demonstrates that levels of glutamate and GABA are robustly maintained across a range of naturally occurring image contrast levels in the visual cortex of healthy participants, and that the neurochemical response is not simply a reflection of the BOLD-fMRI response. The BOLD signal change increased monotonically with image contrast, whereas glutamate signals increased only for the strongest contrast. The mismatch in the sign and significance of complementary measures may indicate a sensitivity threshold for glutamate responses, pointing toward the challenge of reconciling cellular and metabolic signals of neural activity. These findings may be informative for future studies investigating glutamate and GABA neurotransmission in the healthy and diseased human brain.
Footnotes
This work was supported by Medical Research Council MR/K014382/1, Royal Society University Research Fellowship to H.B., and the Wellcome Trust. We thank two anonymous reviewers for the constructive comments in reading earlier versions of the manuscript.
The authors declare no competing financial interests.
- Correspondence should be addressed to I. Betina Ip at betina.ip{at}dpag.ox.ac.uk


