
Abstract
This functional magnetic resonance imaging study investigated the impact of early auditory deprivation and/or use of a visuospatial language [American sign language (ASL)] on the organization of neural systems important in visual motion processing by comparing hearing controls with deaf and hearing native signers. Participants monitored moving flowfields under different conditions of spatial and featural attention. Recruitment of the motion-selective area MT–MST in hearing controls was observed to be greater when attention was directed centrally and when the task was to detect motion features, confirming previous reports that the motion network is selectively modulated by different aspects of attention. More importantly, we observed marked differences in the recruitment of motion-related areas as a function of early experience. First, the lateralization of MT–MST was found to shift toward the left hemisphere in early signers, suggesting that early exposure to ASL leads to a greater reliance on the left MT–MST. Second, whereas the two hearing populations displayed more MT–MST activation under central than peripheral attention, the opposite pattern was observed in deaf signers, indicating enhanced recruitment of MT–MST during peripheral attention after early deafness. Third, deaf signers, but neither of the hearing populations, displayed increased activation of the posterior parietal cortex, supporting the view that parietal functions are modified after early auditory deprivation. Finally, only in deaf signers did attention to motion result in enhanced recruitment of the posterior superior temporal sulcus, establishing for the first time in humans that this polymodal area is modified after early sensory deprivation. Together these results highlight the functional and regional specificity of neuroplasticity in humans.
- motion
- visual attention
- fMRI
- plasticity
- deafness
- American sign language
This study focused on the effects of early deafness and early acquisition of American sign language (ASL), a visuospatial language, on the organization of the neural systems important in the perception of visual motion and in visual attention. Several factors may contribute to different developmental outcomes for these functions in congenitally deaf signers. First, in the absence of audition, deaf individuals must rely on vision to orient to new incoming information. This may result in an enhanced sensitivity of visual orienting mechanisms, such as those at work when one takes notice of a moving truck suddenly looming nearer at a crossroad. In accordance with this view, deaf signers appear to be faster at reorienting their attention compared with hearing controls (Parasnis and Samar, 1985). Second, in the absence of audition to monitor extrapersonal space, deaf individuals may devote greater processing resources to monitoring of the peripheral visual field. Accordingly, studies have reported enhanced neural responses under conditions of peripheral compared with central attention in congenitally deaf individuals compared with hearing controls (Neville and Lawson, 1987b;Bavelier et al., 2000). Third, motion processing itself is likely to be altered in deaf signers because abrupt motion onsets efficiently recruit orienting mechanisms and, in addition, ASL relies heavily on the analysis of hand motion. In this context, it has been surprising to find equivalent motion thresholds in deaf signers and hearing individuals (Bosworth and Dobkins, 1999). However, reliable relative differences in motion processing have been described, whereby the lateralization of motion processing differs in deaf signers and hearing controls, with a left hemisphere (LH)–right visual field advantage in the deaf and the opposite trend in the hearing (Neville and Lawson, 1987b; Bosworth and Dobkins, 1999). Interestingly, the same left hemisphere bias seen in deaf signers has been observed in hearing individuals who acquired American sign language early in life, suggesting that the left lateralization of motion processing in deaf signers arises with the acquisition of ASL rather than with deafness per se (Neville and Lawson, 1987c). It is plausible that the co-occurrence of analysis of motion (of the hands) and language processing leads to greater motion sensitivity in the language-dominant left hemisphere.
To summarize, three main aspects of motion processing and attention to motion may develop differently in deaf signers: the lateralization of motion processing as a result of early signing, peripheral visual attention, and orienting mechanisms as a result of early auditory deprivation. In this study, we capitalized on the high spatial resolution of the functional magnetic resonance imaging (fMRI) technique to characterize the brain areas that may mediate these changes. All stimuli required motion processing, allowing us to assess the lateralization of the different motion-related areas. The spatial distribution of attention was systematically manipulated from center to periphery to assess brain areas that participate in the peripheral visual attention enhancement noted previously in the deaf. Finally, orienting to visual changes in the environment was manipulated by comparing efficient orienting cues (motion velocity increase) with less efficient ones (luminance decrement). Hearing individuals born to deaf parents and who learned ASL as their first language were also included to separately assess the effects of deafness and of the acquisition of ASL.
MATERIALS AND METHODS
Using fMRI, deaf signers and hearing controls were compared as they processed a series of blocks of stimuli that alternated between static dots and moving flowfields (20 sec blocks). In one condition (luminance task), subjects were required to detect a transient dimming of the dots that occurred equally often during the moving and static alternations. In the other condition (velocity task), subjects were required to detect the same transient dimming during static alternations but a transient acceleration of the dots during the moving alternations (Fig. 1A). It is important to note that these tasks differed by the nature of the features subjects were asked to attend to and the efficacy these changes may have at capturing attention. For each task condition, three different levels of spatial attention were manipulated, because the changes to be monitored occurred in the center (0.4–1.73°), in the near periphery (6.66–8°), or over the full field (0.4–8°) (Fig.1B). Although the direction of attention varied, eye gaze was constant (central fixation) and the stimuli covered the same spatial extent in all three attention conditions (0.4–8°). However, abrupt changes occurred only centrally in the attend-center condition and only peripherally in the attend-periphery condition, producing small, occasional sensory differences between these two conditions. The contribution of sensory differences was minimized by keeping the number of abrupt changes extremely low (a mean of 1.3 changes per 20 sec blocks, with at most 3 changes over 20 sec). This design was chosen to manipulate both endogenous and exogenous attention and to compare their effects when directed centrally versus peripherally, because both types of attention may differ with eccentricity between deaf and hearing individuals.

A, Schematic representation of the alternations of motion and static blocks for the luminance task and for the velocity task in the full-field condition. At the end of each run, subjects were asked to report the number of blocks that contained three or more changes. B, Stimuli in the central and peripheral field conditions covered the same spatial extent as in the full-field condition, but were organized in three separate rings. In the central condition, the changes in luminance or velocity were restricted to the central ring. In the peripheral field condition, the changes in luminance or velocity only occurred in the most peripheral ring.
Alternations of static and moving stimuli such as those used in this study are known to recruit a network of areas in the posterior part of the brain. This network includes early visual areas V1–V2, the motion-selective area MT–MST (also known as V5+), area V3A, the posterior parietal cortex (PPC), and the posterior part of the superior temporal sulcus (post-STS) (Fig. 2) (Zeki et al., 1991; Dupont et al., 1994; Cheng et al., 1995; Tootell et al., 1995, 1997; Howard et al., 1996; Buchel et al., 1998; Cornette et al., 1998; Ahlfors et al., 1999; Sunaert et al., 1999). Activation in these predefined regions of interest (ROIs) was systematically compared across populations. In addition, activation in the frontal eye field was recorded to assess possible eye movement artifacts. The extent and intensity of activation (as measured by volume of activation and percentage of signal change, respectively) within each of these ROIs were assessed by fitting the time course of each voxel with a reference time series corresponding to the static-moving alternations of the stimuli corrected for the hemodynamic function (Friston et al., 1996). Between-subjects analyses were performed on the extent of activation and on the percentage of signal change separately, because neural changes as a function of experience can be manifested by an expansion of the area dedicated to the task or by a modulation of the sensitivity of the neurons available to perform the task (Recanzone et al., 1993;Crist et al., 2001).

Summary of the network of posterior regions recruited during motion processing in hearing controls; the frontal eye field (FEF) used to control for eye movement artifacts is also displayed.
Participants
Eleven hearing individuals participated, as well as eleven congenitally, genetically deaf individuals who acquired American sign language from their deaf parents since birth. All participants were right-handed. Deaf subjects had no history of neurological disorder and had a binaural hearing loss of >90 dB. Data from two of the deaf subjects were discarded because of excessive motion for one participant and a misunderstanding of the task for the other. Participants included in the analysis were between the ages of 18 and 27 (mean age of 23 years in each group); the hearing group included six females and five males and the deaf group included five females and four males.
The third population of participants consisted of eight hearing individuals born to deaf parents; these individuals acquired American sign language from their deaf parents since birth. They were all right-handed, although one subject had developed the ability to use his left hand after injury of his right hand. Data from three of these participants had to be discarded because of (1) excessive motion, (2) extensive distortion–magnetic resonance (MR) signal loss attributable to the wearing of glasses, and (3) a misunderstanding of the task. The five hearing signers included in the analysis were between the ages of 22 and 42 (mean age of 31 years) and were composed of three females and two males. All participants but one were interpreters for the deaf. When asked which language they were most comfortable with, one reported English, one ASL, and three rated ASL and English as equally comfortable.
Experimental design
Participants were scanned during seven runs, each of which lasted 4 min and 16 sec. Using a liquid-crystal display video projector, stimuli were videotaped and back-projected on a screen placed at the foot of the MR patient bed. Participants viewed the screen through a mirror fitted to the MR head coil. During each run, participants viewed 12 alternating blocks of static dots and motion flowfields while fixating on a central fixation point at all times. The displays were composed of ∼280 dots (0.2° per dot), and covered a circular field of view (FOV) of 16°. The dots could be either moving or static. On the motion blocks, the dots moved radially at a speed of 4.5°/sec. Half of the dots moved inward and the other half outward to avoid motion aftereffects and eye tracking. In the first run, subjects passively viewed an alternation of static and moving blocks. The experiment then counterbalanced two task conditions. In the luminance condition, participants were told to monitor the static blocks and the moving blocks for abrupt luminance changes. These changes consisted of a 65% decrease in luminance for a 1 sec period. These changes were not very frequent, with at most three changes occurring in a 20 sec period. Part of these data have been described byBavelier et al. (2000). In the velocity condition, participants were asked to monitor the motion blocks for abrupt and transient changes in velocity rather than luminance changes. The velocity changes consisted of a 70% increase in the velocity of the dots from their baseline speed for a 1 sec duration. To ensure equal attentional demands between moving and static blocks, participants still monitored the static blocks for luminance changes. At the end of each run, subjects reported the numbers of blocks that had three or more changes. Within a run, the changes could occur over the whole field (0.4–8°), in the center only (0.4–1.73°), or in the near periphery only (6.66–8°). Participants were informed before each run where in the visual field the changes would occur. The values of the luminance and velocity changes were selected so that the task could be performed equally well in the central and peripheral locations. The displays in the center and the near-periphery conditions were similar and consisted of three separate ring-shaped areas of dots: a central ring (0.4–1.73°), an intermediate ring (3.53–4.86°), and a near-periphery ring (6.66–8°) (Fig. 1B). In the full-field condition, the dots covered a circular area from 0.4 to 8°. Subjects were trained on the stimuli and tasks before the fMRI session. Once in the magnet, subjects were informed of the upcoming task condition before each run via text that appeared on the stimulus screen. They were also reminded to fixate the fixation point throughout the run. The first run of each imaging session was a passive viewing condition. After this run, we counterbalanced the order of the two task conditions, luminance and velocity, between subjects. There were three runs for each task condition: the full-field condition was always first, then the order of the central and peripheral conditions was counterbalanced across subjects.
Image acquisition and analysis
MR parameters
The experiment was performed at Georgetown University on a 1.5 T Magnetom Vision whole-body MRI system (Siemens, Erlangen, Germany) equipped with a head volume coil. Multislice T2*-weighted fMRI images were obtained with echo-planar imaging (EPI) using a tilted coronal orientation, which was chosen to align the slices parallel to the participant's calcarine fissure [echo time (TE) = 40 msec, 64 × 64; FOV = 224, 20 slices, 5 mm thickness with 10% gap (i.e., 3.5 × 3.5 × 5.5 mm3 voxel size); repetition time (TR) = 4 sec]. For each run, 64 time points were collected, with the first 4 time points corresponding to a blank screen to eliminate magnetic saturation effects. There were six stimulus cycles per run, with each cycle consisting of five time points of the static display and five time points of the motion display. Three-dimensional T1-weighted spoiled gradient-recalled echo (SPGR) volumes were acquired to allow for spatial normalization of the functional images as a preprocessing step for the common brain template analysis. In addition, anatomical images taken with the same slice prescription that was used to collect the EPIs, using a T2-weighted Turbo-Spin Echo sequence (TE = 99.0, 0.85 × 0.875 × 5 mm with 10% gap). To define the anatomical localization of the regions of interest for each individual subject, the T1-weighted volumes, non-normalized and coregistered to the EPIs, were used, except in two participants in which the T1-weighted volumes were not available; in these two instances, the T2-weighted volumes were then used.
ROI analyses and common brain template analyses were performed using statistical parametric mapping (SPM)96. Data from each run were realigned to the middle image and a mean image (T2*) was created for each realigned run. Data with motion artifact >1.5° in rotation or one-half the voxel size in translation were discarded (one deaf subject; one hearing native signer subject); the remaining data were corrected for motion (SPM96).
ROI analysis
No spatial smoothing was applied to the data because only voxel level inferences were of interest. ROI analysis was used in Results (Deaf signers versus hearing controls and Impact of signing: the case of hearing signers). Low-frequency confounds were removed using a high-pass filter and the data were temporally smoothed with a 2.8 sec Gaussian kernel. A voxel-wise analysis was then conducted for each subject's run by computing the temporal correlation between the MR signal and a reference function (two temporal basis functions in SPM96). As is standard in analyses using SPM, voxels that did not survive an initial probability threshold of p < 0.001 for the omnibus test (F ratio) were discarded from additional analyses. Voxels were considered active if they reached ap value of <0.01 (uncorrected) for the contrast of interest using the fixed-effect statistics of SPM96.
Activation was delineated for each participant using an interactive region definition program implemented in Matlab (Mathworks, Natick, MA). The program outputs the number of significantly active voxels included in the user-defined regions as well as their mean percentage of signal change and their mean phase (as determined by the fixed-effect statistics of SPM96; see above). ANOVAs with population as a between-subject factor and with hemisphere, task (luminance, velocity), and location of attention (full-field, central, peripheral) as within-subject factors were performed separately on the extent of the activation (number of significantly active voxels) and on the percentage of signal change. Separate analyses of these two variables were conducted because it is unclear which of these measures best indexes functional changes in fMRI, especially when assessing neuroplastic changes (Recanzone et al., 1993; Crist et al., 2001).
Following our previous fMRI studies as well as those of others, the regions of interest were defined for each participant on the basis of both anatomical and functional criteria. A first investigator delineated all areas in all subjects. These ROI boundaries were subsequently checked by a second investigator. For areas that led to population effects, a third investigator, blind to the choice of the first investigator, also delineated the area of interest. Although there were slight differences in delineating boundaries from one investigator to the other, the choice of ROI boundaries by the first and third investigator led to the same statistically significant effects in all cases. The criteria used to delineate each area are detailed below. The same criteria given by Bavelier et al. (2000) were used for MT–MST, V1–V2, the posterior parietal cortex, and the frontal eye field (Figs. 2 and 3).

Example of activations in motion-related areas for one deaf and one hearing participant.
V1–V2. In the absence of precise retinotopic mapping the V1–V2 border cannot be precisely identified; therefore, these areas were included in a single ROI. The calcarine fissure was first identified. Activation falling within the calcarine fissure as well as any activation within the area surrounding the retrocalcarine sulcus, if present, was included. Activation extending ventrally toward the lingual sulcus along the medial part of the lingual gyrus was also included. This region includes the V1–V2 border (Ship and Zeki, 1995;Tootell and Taylor, 1995).
V3A. V3A was defined according to the landmarks of Tootell et al. (1997), and Ship and Zeki (1995). The transverse occipital sulcus (TOS) was identified and activation falling in the TOS or slightly ventral to the TOS was included. This region primarily covers the superior medial end of V3A, which may have led to a greater emphasis on peripheral rather than central V3A (Tootell et al., 1997). This choice was determined by the lack of clear sulci delineations to determine the inferior boundary of V3A.
MT–MST. Activation from the passive viewing condition was used to identify the location of MT–MST by selecting the area of greatest activation in the inferior part of the lateral occipital lobe. As has been reported in previous studies, MT–MST was localized in most subjects at the temporo-occipital junction, and in particular near the intersection of the anterior occipital sulcus and the lateral occipital sulcus (Zeki et al., 1991; Watson et al., 1993). Although the exact location of MT–MST within these sulci varied across subjects, all subjects displayed the most robust motion-related activation in these sulci. The voxel with the highest activation at that lateral position was determined to be the center of MT–MST activation. The size of MT–MST activation was then determined by including all active voxels connected to that point of highest activity (as long as they fell within the boundaries of the anatomical definition of MT–MST). It is worth noting that these criteria yielded MT–MST activation that was spatially distinct from that of other visual areas in all but one subject (deaf). Although this may have resulted in a smaller MT–MST volume than that reported in other studies, it ensured that MT–MST activation was well circumscribed and minimally contaminated by other nearby visual areas.
Posterior parietal cortex. Activation falling within the intraparietal sulcus was included in this ROI. This area extended posteriorly but did not include the area surrounding the transverse occipital sulcus (Buchel et al., 1998). Activation falling in the superior parietal gyrus was included only when lateral and adjoining the intraparietal sulcus.
Posterior superior temporal sulcus. Several studies have now described a focus of activation during motion processing in the posterior section of the superior temporal sulcus (Howard et al., 1996;Ahlfors et al., 1999; Sunaert et al., 1999). Following these studies, an ROI was defined by first identifying the superior temporal sulcus and the ascending and horizontal branches of the parallel sulcus. Activation lying at the junction of these sulci and/or extending anteriorly within the posterior one-third of the superior temporal sulcus was included. This region is similar to that described for biological motion (Puce et al., 1998; Allison et al., 2000).
Frontal eye field. Recent investigations of saccadic eye movements and pursuit eye movements indicate that they result in reliable recruitment of the precentral gyrus, extending from the central sulcus to the precentral sulcus (Corbetta, 1998). In each subject, the central sulcus, superior frontal sulcus, and precentral sulcus were delineated, and any activation falling in gray matter within the region bounded by these sulci was recorded. Note that there was nearly no activation in this area at the analysis thresholds used for the other areas. To investigate possible artifacts from eye movements, activation in this area was measured by including in this analysis all the voxels that survived an initial probability threshold of p < 0.05 for the omnibus test (F ratio). Voxels were considered active if they reached a p value of <0.01 (uncorrected) for the contrast of interest using the fixed-effect statistics of SPM96.
Common brain template analysis
The high-resolution SPGR volume was coregistered to the mean images of each run (T2*, created during realignment) (see Results, Motion network in deaf signers). The images were then spatially normalized to a standard template. The data were smoothed using an 8 mm full-width at half-maximum isotropic Gaussian kernel and tested for activation effects within each population. Because the SPGR volumes could not be collected on two of the deaf subjects, this analysis was restricted to seven participants in the deaf population. A map of Z statistics was generated across all deaf subjects comparing moving with static stimuli to verify regions of interest for motion processing in our deaf subjects. Fixed-effect statistics were used to assess the significance of mean activation. This statistical model is effectively a case study and does not generalize to the whole population.
RESULTS
Analyses of the behavioral performance of participants are presented first. Differences between deaf and hearing controls in the recruitment of motion-processing areas are then considered by comparing the extent of activation and the percentage of signal change in the traced ROIs. Finally, the impact of early acquisition of a visuomanual language on the differences observed is assessed by comparing activation in hearing native signers with that of deaf signers and of hearing controls. In addition, a common brain template analysis was performed to test for the recruitment of additional areas during motion processing in deaf individuals.
Behavioral performance
At the end of each run, participants reported how many blocks (static or moving) contained three or more changes. Using the number of runs in which participants were correct as the dependent variable, we performed an ANOVA with population (hearing controls, deaf signers, and hearing signers), task (luminance and velocity), and location of attention (central, near-periphery, and full-field) as factors. This analysis revealed no significant effects (all p values >0.1; Table 1). However, an inspection of the data in Table 1 reveals an interesting trend in the behavioral data. Deaf subjects tended to show better performance than hearing controls and hearing signers in the peripheral condition, but the hearing groups tended to be better than deaf signers in the central condition. To assess the robustness of this population difference, a contrast analysis was performed on the difference between central and peripheral performance. In accordance with the hypothesis of better peripheral than central performance in the deaf population but the opposite pattern in the two hearing populations, a weight of −2 was assigned to the deaf signers and a weight of +1 was assigned to each of the hearing populations. This contrast was significant (F(1,22) = 7.41; p < 0.012). Thus, consistent with previous reports in the literature, deaf individuals displayed a bias for better performance in the peripheral field than the central field, whereas hearing controls and hearing signers displayed the opposite bias (Neville and Lawson, 1987a,b,c;Loke and Song, 1991). The lack of effects in the main ANOVA suggests, however, that this effect is subtle in the present data set. This is not surprising, because the tasks (detection of luminance or velocity changes) were designed to be easy and of equal difficulty across locations of attention. Although this choice allowed for a ceiling effect in the behavioral data, it ensured that any observed differences in brain activity could not be easily attributed to group differences in task difficulty.
Characteristics of the participants included in the analysis and their behavioral performance
Deaf signers versus hearing controls
The following analyses were conducted separately for each ROI (Figs. 2 and 3) and used a basic ANOVA model with task condition (luminance versus velocity), location of attention (center, near-periphery, and full-field), and hemisphere (left versus right) as within-subject factors and population as a between-subject factor. Any additional analyses are described below. The mean extent of activation and mean percentage of signal change observed in each ROI are presented for each population as a function of hemisphere in Table2, of location of attention in Table3, and of attentional task in Table 4. Before discussing each ROI of the motion network in turn, possible confounds attributable to eye movements are considered by looking at activation in the frontal eye field.
Activation within motion-related areas measured in spatial extent (in mm3) and percentage of signal change as a function of hemisphere 2-a
Activation within motion-related areas measured in mean spatial extent (in mm3) and mean percentage of signal change as a function of the eccentricity of attention 3-a
Activation within motion-related areas measured in spatial extent (in mm3) and percentage of signal change as a function of attentional task 4-a
Frontal eye field
Eye movements have been shown to recruit the MT–MST area (Petit and Haxby, 1999). To assess any contribution of eye movements to the pattern of findings observed in the motion network, we measured the amount of activation in the frontal eye fields, a main structure in charge of eye movement planning and control. Only sparse activation was observed when using the same thresholds as for the other ROIs. Even when using a more relaxed criterion (see Materials and Methods), no significant effect with population as a factor was observed in either analysis (all p values >0.2). Therefore, this analysis rules out a contribution of eye movements to the pattern of population differences described below.
V1–V2
Separate ANOVAs performed on extent of activation and on percentage of signal change revealed a main effect of location of attention, with greatest activation in the full-field, then the central, and finally the peripheral condition (extent:F(2,36) = 8.74, p < 0.001; full-field = 950 mm3; central = 660 mm3; peripheral = 593 mm3) (signal change:F(2, 36) = 3.56; p < 0.039; full-field = 2.25%; central = 2.1%; peripheral = 1.9%). This finding is consistent with the way central and peripheral vision are represented in early, retinotopically organized visual areas and is also consistent with the report of a similar retinotopic organization for visuospatial attention (Brefczynski and DeYoe, 1999). Importantly, at this early stage of processing, the activation appears to be lateralized similarly between deaf and hearing (all p values >0.6; Table 2) and appears to show the same sensitivity to the eccentricity of attention (all p values >0.2; Table 3).
Overall, early visual areas (V1–V2) display the typical over-representation of the central field previously documented in the literature and indicate comparable recruitment across populations, suggesting little contribution of these areas to the changes in motion processing and visual attention observed in the deaf population.
V3A
An ANOVA performed on extent of activation revealed no significant effect (all p values >0.055). However, there was a marginally significant interaction between population and hemisphere (F(1,18) = 4.22; p = 0.055), reflecting a stronger left than right hemisphere (RH) activation in the deaf population and the opposite trend, albeit smaller, in the hearing. This trend for opposite lateralization in the two populations will have to be further confirmed.
MT–MST
The ANOVA on the extent of activation revealed a main effect of task condition (F(1,18) = 11.2;p < 0.004) because of a larger recruitment of MT–MST in the velocity condition. This finding is consistent with previous reports in the literature showing an enhancement of MT–MST recruitment when the task is directed at motion features (Beauchamp et al., 1997;O'Craven et al., 1997). An interaction between population and hemisphere was also present (F(1,18) = 8.6; p < 0.009), revealing a different lateralization of motion processing in the two populations. Deaf individuals displayed a larger recruitment of left MT–MST than right MT–MST, whereas hearing individuals showed the opposite trend (Fig.4A and Table 2).

A, Extent of the activation in MT–MST for hearing controls and deaf signers in the LH and RH. Deaf signers displayed a greater recruitment in the LH, whereas hearing controls showed a greater recruitment in the RH (population × hemisphere: p < 0.009);B, Extent of the activation in MT–MST for hearing controls and deaf signers when attention was directed toward the center and the periphery. Deaf signers showed an enhanced recruitment under the peripheral attention condition compared with hearing controls, whereas the opposite trend was observed under central attention (population × attention location: p < 0.019).
A marginal effect of population by location of attention (F(2,36) = 2.1; p = 0.053) suggested different recruitment of MT–MST in the two populations as the location of attention varied between central, peripheral, and full-field locations. The ANOVA on the percentage of signal change revealed a similar trend (F(2,36) = 3.2; p = 0.053). To directly compare the effect of central and peripheral attention, we performed an additional ANOVA restricted to the center and near-periphery locations of attention. This analysis, when performed on extent of activation, revealed an interaction between population and location of attention confirming the larger MT–MST recruitment in the deaf compared with the hearing during peripheral attention, whereas MT–MST recruitment tended to be larger in the hearing compared with the deaf during central attention (F(1,18) = 6.6; p < 0.019) (Fig. 4B).
Posterior parietal cortex
This analysis revealed a significant population difference (F(1,18) = 4.78; p < 0.042) attributable to a larger percentage of signal change in deaf signers compared with hearing controls (Fig.5). This finding indicates more robust parietal recruitment in deaf signers and is consistent with previous reports of the involvement of the parietal cortex in crossmodal plasticity (Bavelier et al., 2000; Weeks et al., 2000).

Percentage of signal change in the PPC for hearing controls, deaf signers, and hearing signers. The greater activation observed in deaf signers compared with hearing controls and hearing signers suggests a heightened recruitment of this area after early deafness (contrast analysis: p < 0.009; see Results, Impact of signing: the case of hearing signers, Posterior parietal cortex section for details).
Posterior superior temporal sulcus
The ANOVA on extent of activation revealed a main effect of task condition that was attributable to greater activation during the velocity than the luminance task (F(1,18) = 8.4; p < 0.009). Importantly, a main effect of population was also present because of greater overall activation in the deaf population (F(1,18) = 7.3; p < 0.015). There was also an interaction between population and task condition, indicating a greater population difference in the velocity task condition than in the luminance task condition (i.e., deaf more than hearing in velocity; F(1,18) = 8.2; p < 0.01) and an interaction between population, task condition, and location of attention (F(1,18) = 3.6; p < 0.037). These interactions led us to perform separate analyses for each task condition.
There were no significant effects in the luminance task condition, and in particular no effects with population as a factor (all pvalues >0.11). In contrast, a significant effect of population was observed in the velocity task condition (F(1,18) = 8.9; p < 0.008) confirming larger post-STS recruitment in the deaf than in the hearing controls. These results are illustrated in Figure6A,B. There was also a main effect of location of attention attributable to greatest recruitment under central attention (F(1,18) = 3.7; p < 0.033) and an interaction between population and attention location (F(1,18) = 4.1; p < 0.025). This latter effect appeared to arise from a larger population difference under the central attention condition than under the other conditions. This observation led us to perform separate analyses for each attention location with population and hemisphere as factors. A population difference was observed in all attention locations (central attention, F(1,18) = 7.5,p < 0.013; near-periphery attention,F(1,18) = 7.4, p < 0.014; full-field condition, F(1,18) = 6.2, p < 0.023). Thus, the population difference was robust across all locations of attention. Overall these results demonstrate a larger recruitment of the post-STS in the deaf than in the hearing controls when the task required monitoring velocity changes. This enhancement was specific to the velocity task and was found under all locations of attention but if anything was greater for central attention.
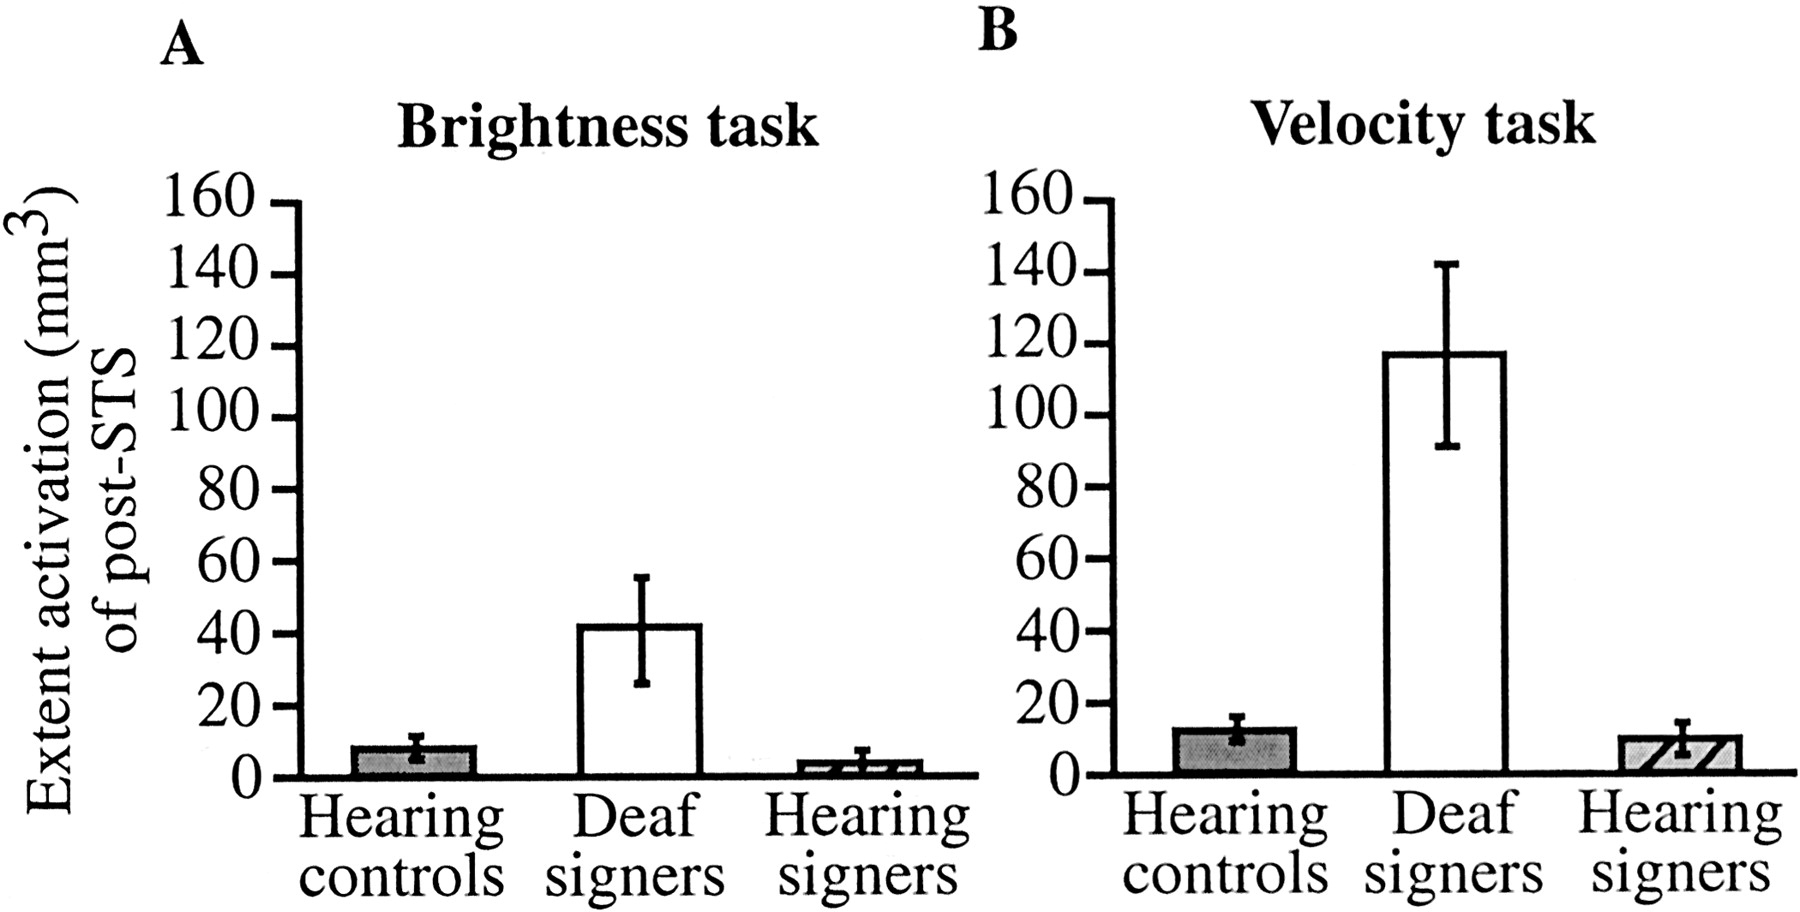
A, Extent of activation in the post-STS for hearing controls, deaf signers, and hearing signers when subjects were required to monitor the display for luminance changes.B, Extent of activation in the post-STS for hearing controls, deaf signers, and hearing signers when subjects were required to monitor the display for velocity changes. Although a tendency for greater activation was observed in deaf signers in the luminance task (A), statistical analyses indicated that this tendency was not reliable. In contrast, a robust increase in activation can be seen in deaf signers during the velocity task (B, contrast analysis: p < 0.002).
The analysis performed on percentage of signal change confirmed these findings. As in the analysis on extent of activation, there was a main effect of population (F(1,18) = 7.9;p < 0.012) and of task (F(1,18) = 7.5; p < 0.013) as well as an interaction between task and population (F(1,18) = 6.1; p < 0.02). Separate analyses for each task condition confirmed the lack of effects in the luminance task (all p values >0.1) and the significant population difference in the velocity task (F(1,18) = 8.6; p < 0.009).
Deaf signers versus hearing controls: summary
These results are in agreement with the hypothesis that three main types of changes occur in the recruitment of motion-related areas between deaf signers and hearing controls.
Lateralization of motion processing. A change in the lateralization of a number of areas was observed because of a left-hemisphere enhancement in the deaf, whereas hearing individuals tended to display a right-hemisphere bias. This change was most marked in the recruitment of area MT–MST as illustrated in Figure4A, but the same trend was observed in V3A and in the posterior parietal cortex. The observation of a change in the lateralization of a number of motion-related areas concurs with previous reports. The few behavioral studies of motion processing available in the literature indicate that hearing individuals perform better in the left visual field (RH) than the right visual field (LH), whereas deaf individuals show the opposite pattern. This lateralization difference has been observed with at least three different kinds of motion tasks: identification of the direction of motion of a single square (Neville and Lawson, 1987b), thresholds for motion direction (Bosworth and Dobkins, 1999), and thresholds for motion velocity (Brozinsky and Bavelier, 2001). In addition, using evoked potentials,Neville and Lawson (1987b) have reported lateral asymmetries in event-related potentials that matched those in behavior in a motion-direction detection task; in particular, these authors have observed evoked potentials of greater amplitude over left hemisphere sites in the deaf but over the right hemisphere sites in the hearing. The present study suggests V3A, the PPC, and MT–MST as possible loci for the source of these effects. In addition, the robust lateralization difference observed in MT–MST across populations, combined with the known participation of this area in various aspects of motion processing, suggests that changes within MT–MST may play the leading role in this difference across populations. Below we consider whether this effect is attributable to deafness or acquisition of ASL.
Peripheral versus central location of attention. A larger MT–MST recruitment was observed under peripheral attention in the deaf than in the hearing, whereas the opposite pattern was observed under central attention (Fig. 4B). Although inspection of Table 3 suggests the same trend in V3A and the PPC, statistical analyses failed to support this view, suggesting that this effect is rather restricted to MT–MST. Enhancement of peripheral processing in the deaf is not specific to our study but has been described in a few other studies. For example, as mentioned previously, when participants attended to the direction of motion of a small peripheral (but not central) square, faster reaction times and larger evoked potentials were observed in the deaf than in the hearing population (Neville and Lawson, 1987b). The changes observed in MT–MST in the present study may underlie these previously described effects. In addition, in a related fMRI study, we have recently observed the same enhanced recruitment of MT–MST in the deaf population under peripheral attention. Using structural equation modeling, we determined that this enhancement was mediated by a greater effective connectivity between MT–MST and the PPC, whereas no changes were observed between early visual areas and MT–MST (Bavelier et al., 2000). The present finding of similar V1–V2 recruitment across populations but a greater recruitment of the PPC in deaf individuals supports the view that the enhancement of peripheral attention in deaf individuals arises primarily within higher stages of visual processing.
Feature-specific attention. The recruitment of the post-STS was greater in deaf than in hearing subjects. Importantly, this effect was restricted to the task of monitoring motion velocity and was especially robust when attention was allocated centrally. This finding establishes for the first time in humans that the superior temporal sulcus, a likely zone of convergence for auditory, visual, and tactile modalities (Calvert et al., 2000; Downar et al., 2000; Callan et al., 2001), displays an altered organization after early sensory deprivation. This finding fits well with results from the animal literature documenting that polymodal areas are highly likely to display altered organization after early sensory deprivation. For example, the anterior ectosylvian cortex in cats, a brain region that normally contains cells responsive to auditory, somatosensory, and visual input, displays an increase in the number of auditory and somatosensory neurons as a result of visual deprivation (Rauschecker and Korte, 1993). Similarly, in monkeys, visual deprivation produces a decrease in the number of visually responsive cells and an increase in somatosensory responsive cells in multimodal area 19 and parts of the lower parietal cortex (Hyvarinen et al., 1981). An explanation that comes readily to mind is the possibility that this change is brought about by early exposure to a visuomanual language, such as ASL. Indeed, a wealth of evidence has now documented the participation of this post-STS area in the processing of biological motion and socially relevant motion (Allison et al., 2000).
Impact of signing: the case of hearing signers
To separate the contributions of ASL use from that of deafness in each of the effects described above, we studied hearing native signers. Effects attributable to signing should be observed in hearing signers and deaf signers, but not in hearing controls. Conversely, effects attributable to deafness should only be observed in deaf signers, and not in either hearing signers or hearing controls.
Analyses were systematically performed by first comparing hearing signers with hearing controls and then by comparing hearing signers with deaf individuals. ANOVAs were conducted as before using population as a between-subjects factor and task condition, location of attention, and hemisphere as within-subjects factors. Contrast analyses were then used to test specific hypotheses about the activation within the three populations. Extent of activation and percentage of signal change for each of the studied ROIs are reported in Tables 2, 3, and 4 for hearing signers. Inspection of these tables suggests a lower overall recruitment in hearing signers compared with hearing controls or deaf signers. However, the analysis performed below did not reveal a systematic difference in the level of activation in hearing signers compared with the two other populations.
V1–V2
Hearing signers versus hearing controls. The only significant effect in these analyses was a main effect of location of attention (extent of activation:F(2,28) = 7.59, p < 0.001; percentage of signal change:F(2,28) = 4.47, p < 0.021). Activation was strongest in the full-field condition, intermediate in the central condition, and weakest in the peripheral condition as seen in the comparison of deaf and hearing controls.
Hearing signers versus deaf signers. The same effect of location of attention as reported above was observed in this analysis (extent of activation: F(2,24) = 11.78, p < 0.0001; percentage of signal change:F(2,24) = 2.93, p = 0.072).
V3A
Hearing signers versus hearing controls. The ANOVA on extent of activation revealed a main effect of task (F(1,14) = 5.31; p < 0.037) and of location of attention (F(2,28) = 3.52; p < 0.043), indicating greater recruitment during the velocity task and during the central attention condition. The same analysis on percentage of signal change revealed only a three-way interaction between population, location of attention, and hemisphere (F(2,28) = 4.12; p < 0.027). As discussed below, this three-way interaction is difficult to interpret.
Hearing signers versus deaf signers. No significant effects were found in the ANOVA on extent of activation (all pvalues >0.068). The analysis on percentage of signal change revealed a main effect of location of attention because of a weaker recruitment under the peripheral attention condition (F(2,24) = 5.66; p < 0.01) and a similar three-way interaction between population, location of attention, and hemisphere as described between hearing controls and hearing signers (F(2,24) = 4.14;p < 0.028). In each case, this interaction appeared to stem from a greater percentage of signal change in the right hemisphere of hearing signers in the central attention condition. Although suggestive for additional studies, the present study cannot resolve the origin of this effect.
To summarize, early visual areas appear to be similarly recruited across populations, suggesting little contribution to the changes in motion processing and visual attention observed after early deafness or early signing.
MT–MST
Hearing signers versus hearing controls. An ANOVA on the extent of activation revealed a main effect of task condition because of greater activation in the velocity task (F(1,14) = 8.8; p < 0.01). This analysis revealed an interaction between population and hemisphere (F(1,14) = 5.4;p < 0.036). Thus, the lateralization of MT–MST activation differed between hearing signers and hearing controls because of a larger left than right hemisphere recruitment in hearing signers, whereas hearing controls showed the opposite trend. Thus, signing alone appears sufficient to bias the lateralization of MT–MST to the left hemisphere. This pattern of results is illustrated in Figure 7A, which plots the lateralization difference (LH–RH activation) for each population. A main effect of location of attention was also observed, attributable to greatest activation for central attention and lowest for peripheral attention (F(2,28) = 5.3;p < 0.011). Indeed, hearing signers, like hearing controls, showed greater activation during the central compared with the peripheral attention condition. Figure 7B illustrates this fact by showing the difference in activation between the central and peripheral conditions for each population (central–peripheral activation).

A, Difference between the extent of activation in the LH and RH in MT–MST for each of the three populations. The hearing controls displayed a RH bias, but a LH bias was observed in both deaf and hearing signers, indicating that the acquisition of ASL was the major factor in the altered lateralization of the MT–MST complex (contrast analysis: p < 0.0052). B, Difference between the extent of activation in the central and the peripheral attention conditions in MT–MST for each of the three populations. Hearing controls and hearing signers showed the same bias for greater recruitment during central compared with peripheral attention, whereas the opposite trend is observed in deaf signers, suggesting that enhanced recruitment of MT–MST during peripheral attention is specifically attributable to auditory deprivation (contrast analysis: p < 0.034).
Hearing signers versus deaf signers. The ANOVA on the extent of activation revealed a main effect of task condition, again indicating more activation in the velocity task condition (F(1,12) = 5.1; p < 0.042). The only other significant effect was a main effect of hemisphere that was attributable to a larger left than right MT–MST recruitment in both populations (F(1,12) = 5.9; p < 0.032). Although there was no interaction between population and location of attention in this overall analysis (p = 0.48), an inspection of the means indicates that hearing signers displayed greater activation during the central attention condition, whereas deaf individuals displayed a trend for greater activation during the peripheral condition.
Contrast analysis. The above analyses indicate that the lateralization of MT–MST is comparable in deaf signers and hearing signers and different from that of hearing controls. This suggests that early use of sign language is the main source of this lateralization effect, as illustrated in Figure 7A. To directly test the hypothesis that signing leads to a left hemisphere advantage, we used a contrast analysis. The predicted hypothesis assigned weights of +1 to deaf signers, +1 to hearing signers, and −2 to hearing controls. This contrast analysis was performed on the activation in the left hemisphere minus the activation in the right hemisphere. The contrast performed on extent of activation was significant, reinforcing the claim that signing leads to a left MT–MST dominance (extent of activation: F(1,22) = 9.6,p < 0.0052; percentage of signal change:p > 0.9). As suggested by Figure 7A, it is possible that, in addition, deafness accentuates this left hemisphere dominance; however, the present study does not have the power to settle this issue.
The analyses suggest that the effect of spatial attention is comparable in hearing controls and hearing signers with greater activation during central attention, unlike deaf signers, who display enhanced activation during the peripheral condition. Contrast analysis was used to test the hypothesis that deafness is the main source of this effect. The predicted hypothesis assigned weights of −2 to deaf signers, +1 to hearing signers, and +1 to hearing controls. This contrast analysis was performed on the difference between central and peripheral levels of activation. The contrast performed on extent of activation was significant (extent of activation:F(1,22) = 5.15, p < 0.034; percentage of signal change: p > 0.9). This finding supports the claim that the enhanced activation observed in response to peripheral attention in deaf signers is attributable to early deafness rather than signing.
Posterior parietal cortex
Hearing signers versus hearing controls. The only significant effect was a main effect of location of attention that was attributable to strongest activation for the central condition and weakest for the peripheral condition (extent of activation:F(2,28) = 5.43, p < 0.01; percentage of signal change:F(2,28) = 6.76, p < 0.004; all other p values >0.15).
Hearing signers versus deaf signers. The analysis on extent of activation revealed no significant effect (all p values >0.069). However, the ANOVA on percentage of signal change revealed a main population effect attributable to a larger activation in deaf signers compared with hearing signers, as illustrated in Figure 5(F(1,12) = 4.88; p < 0.047; all other p values >0.14).
To confirm the hypothesis that deafness is the main source of enhanced parietal activation, a contrast analysis was used. The predicted hypothesis assigned weights of −2 to deaf signers, +1 to hearing signers, and +1 to hearing controls. This contrast analysis was performed on the mean levels of extent of activation and on the mean levels of percentage of signal change across all task and location of attention conditions. The contrast was marginally significant for spatial extent (F(1,22) = 4.25;p = 0.0513) and robust for signal change (F(1,22) = 8.11; p < 0.009). These results indicate that sensory deprivation rather than early signing leads to enhanced recruitment of the posterior parietal cortex.
Posterior superior temporal sulcus
Hearing signers versus hearing controls. The ANOVAs only revealed a main effect of hemisphere that was attributable to a greater activation in the left compared with the right post-STS (extent of activation: F(1,14) = 7.5,p < 0.016; percentage of signal change:F(1,14) = 7.35, p < 0.017; all other p values > 0.18).
Hearing signers versus deaf signers. The ANOVAs revealed a main effect of task condition, again indicating greater activation in the velocity than the luminance task condition (extent of activation: F(1,12) = 7.27,p < 0.018; percentage of signal change:F(1,12) = 5.31, p < 0.04). Importantly, the analyses on percentage of signal change revealed a main effect of population that was attributable to greater activation in the deaf than in the hearing signers (percentage of signal change: F(1,12) = 4.82,p < 0.048; similar nonsignificant trend with extent of activation: F(1,12) = 3.72,p < 0.078).
Contrast analyses were performed separately for each task to assess the hypothesis that deafness is the main source of the post-STS activation and that this enhanced activation is primarily robust in the velocity task. The predicted hypothesis assigned weights of −2 to deaf signers, +1 to hearing signers, and +1 to hearing controls. Each contrast analysis was performed on the mean levels of extent of activation and on the mean level of percentage of signal change across all locations of attention. For the luminance task, neither of the contrasts were significant (extent of activation,F(1,22) = 4.16, p > 0.053; percentage of signal change,F(1,22) = 2.8, p > 0.1). For the velocity task, the contrast analyses were highly significant for extent of activation (F(1,22) = 12.73; p < 0.002) and for percentage of signal change (F(1,22) = 12.66; p < 0.002). These results indicate that the increased post-STS activation in deaf signers is particularly robust for the velocity task and is brought about by early deafness rather than by the use of a visuospatial language.
Deaf signers versus hearing signers: summary
The recruitment of motion-related areas in hearing native signers was studied to tease apart the impact of early signing from that of early deafness in the population differences we have reported between hearing controls and deaf signers.
Lateralization of motion processing. Hearing signers, like deaf signers, displayed a greater LH than RH recruitment of MT–MST. This finding supports the view that early exposure to a visuomanual language such as ASL is sufficient to lead to a greater sensitivity of left MT–MST to motion processing.
Peripheral versus central location of attention. Deaf individuals displayed enhanced MT–MST activation under the peripheral attention condition, whereas in hearing controls, the activation was strongest under the central attention condition. Hearing signers were observed to pattern with hearing controls, establishing that early signing exposure is not sufficient to lead to an enhancement of peripheral attention, and pointing to early deafness as the source of this effect. One of the main centers for visual attention, the posterior parietal cortex, displayed increased recruitment in deaf signers compared with hearing controls and hearing signers. Thus, this attentional change also appeared specific to early deafness.
Feature-specific attention. The increased recruitment of the post-STS noted in the deaf participants was not present in hearing native signers. This result is surprising given the contribution of this area to biological motion processing, but clearly indicates that early exposure to sign language is not sufficient to drive this change in post-STS recruitment.
The analyses performed so far have documented an altered organization of motion-related areas after early deafness and/or early signing. However, it is possible that new areas are also recruited into the motion network as a result of altered early experience. The analyses presented below focus on this issue.
Motion network in deaf signers
To determine the areas comprising the motion network in deaf signers, a common brain template analysis was performed on the data from the deaf signer participants (note n = 7, because normalized volumes could not be computed for two participants because of the lack of a whole-brain T1-weighted scan; see Materials and Methods). This analysis combined all experimental runs (luminance and velocity tasks at central, peripheral, and full-field locations of attention). The main foci of activation with their corresponding Z scores are listed in Table 5. Posterior areas recruited in our deaf participants were similar to those described for hearing controls, including early visual areas V1–V2, V3A, MT–MST, post-STS, and PPC. To illustrate this point, Table 5lists the range of coordinates used to describe each area in the hearing literature. Overall, this analysis did not allow us to identify posterior ROIs that were specific to the deaf population.
Location of activation maxima in deaf signers for moving stimuli across tasks and attentional conditions (Talairach coordinates)
However, an additional cluster of activation was observed in the left prefrontal cortex of deaf subjects, with maxima in the dorsolateral prefrontal cortex extending to the border between the insula and the inferior prefrontal cortex. Although frontal areas have been implicated in the attentional network of hearing individuals, the regions observed in the deaf appear anterior and inferior to those (Corbetta, 1998). However, there are a few studies of attention to motion and attention reporting similar sites in the hearing population (Buchel and Friston, 1997; Buchel et al., 1998; Hopfinger et al., 2000). This finding calls for future research using paradigms similar to those used in hearing controls to assess the effects of early experience on the network of areas that mediate visual attention.
DISCUSSION
This study documents specific changes in the organization of motion-related areas after congenital deafness and early exposure to sign language. Before reviewing these changes, we consider the modulation of motion-related areas as a function of the different attentional conditions manipulated. As described previously in the literature, the motion area MT–MST was more strongly recruited in hearing controls when the task required participants to monitor motion features (Beauchamp et al., 1997; O'Craven et al., 1997) and when attention was directed centrally rather than peripherally (Schlykowa et al., 1993). Although MT–MST was certainly the area most modulated by attentional factors, similar trends were observed in other motion-related areas, suggesting that attentional requirements may have a rather diffuse effect across the entire motion network.
Change in the lateralization of motion processing after early exposure to sign language
Our study indicates a greater recruitment of MT–MST in the left hemisphere compared with the right hemisphere in deaf signers and in hearing signers, whereas the opposite trend was found in hearing controls. This difference in neural recruitment may underlie the behavioral and evoked-potential differences noted during motion processing in these populations (Neville and Lawson, 1987b,c; Bosworth and Dobkins, 1999; Brozinsky and Bavelier, 2001). Thus, early signing modifies the weak right-hemisphere advantage for motion processing into a robust left-hemisphere advantage. Could this bias be attributable to a greater use of the left hand when signing, leading to greater visual motion processing in the right visual field of the signee? This explanation is unlikely, because the dominant hand (most commonly the right one) is preferred in native signers. Rather, as initially proposed by Neville and Lawson (1987c), the reliance of American sign language on motion processing may enhance the participation of the motion-specific area MT–MST in the left, language-dominant hemisphere.
Changes in peripheral attention after early auditory deprivation
The behavioral data indicate a tendency for deaf signers to detect peripheral changes better than the two hearing populations and for hearing controls and hearing signers to detect the central changes better. This finding is in accordance with previous reports of an enhancement of peripheral processing of motion stimuli in deaf signers (Neville and Lawson, 1987b; Bavelier et al., 2000). The present results suggest that this enhancement of peripheral processing is the result of increased recruitment of MT–MST under peripheral attention. This enhancement was not observed in hearing native signers, indicating that deafness, rather than signing, is the source of the effect. A similar conclusion was reached by Neville and Lawson (1987c). This finding is surprising, because signing relies heavily on peripheral vision as signers fixate each other's face during face-to-face interactions and concurrently process the hand shapes and movements occurring in their peripheral field (∼7°) (Bosworth et al., 2000). Thus, not all kinds of experience that demand attention to the visual periphery lead to an enhancement of peripheral attention and its neural substrate.
Although the present study does not allow us to determine whether the enhancement observed under peripheral attention is specific to the motion system or applies across visual skills, the reports of enhanced peripheral processing during shape-identification and target-localization tasks support the latter view (Loke and Song, 1991;Reynolds, 1993; Proksch and Bavelier, 2000). As suggested in previous studies (Parasnis and Samar, 1985; Neville and Lawson, 1987b), it is likely that, in the absence of the auditory modality to orient toward extrapersonal space, deaf individuals rely more heavily on monitoring peripheral visual space to detect new information (not just motion) in their environment. The proposal that attention to the periphery is especially susceptible to altered early experience is also echoed by studies of blind individuals. Roder et al. (1999), for example, have reported enhanced peripheral auditory attention (but not central auditory attention) in the congenitally blind. Although these studies establish that attention to the periphery is enhanced after early sensory deprivation, the question still remains as to whether this attentional change co-occurs with an overall expansion of the representation of the peripheral field at the sensory level.
In addition, early deafness, but not signing, leads to heightened sensitivity in the posterior parietal cortex, one of the major centers of selective attention. This result is consistent with previous reports that point to the connectivity between the parietal cortex and earlier sensory areas as a key factor in the differences in cerebral organization observed after early sensory deprivation (Bavelier et al., 2000; Weeks et al., 2000). Together, these findings suggest that a major consequence of early sensory deprivation is an enhancement of the neural mechanisms that sustain selective attention.
Changes in post-STS after early deafness
Our study indicates a greater recruitment of the post-STS in deaf signers compared with hearing controls. Interestingly, this area has been associated recently with the processing of biological motion and socially relevant body signals (Allison et al., 2000). American sign language clearly makes use of both of these types of information to convey grammatical and lexical information; thus it would be tempting to attribute this population difference to extensive exposure to sign language. However, weak recruitment of this area in hearing signers indicates that signing is not sufficient to lead to such a change, and rather points to deafness as a source of the effect.
This population difference emerged primarily in the velocity task, compatible with the proposal that the processing of motion features is altered after early deafness. However, the few behavioral studies available indicate comparable basic motion processing thresholds in deaf signers and hearing controls (apart from the lateralization difference discussed above), and thus provide little support for the view that the population difference observed in the post-STS reflects a change in basic processing of motion (Bosworth and Dobkins, 1999).
Another possibility is that the population differences observed in the post-STS are related to an enhancement of attention, particularly when directed to motion features, in the deaf population. Abrupt motion-velocity changes such as those used in our study are known to be particularly efficient at summoning visual attention to a location. The greater post-STS recruitment in the deaf may be related to a modification of the mechanisms responsible for initially directing attention in this population. Consistent with this view, recent studies of visual attention have documented the participation of the post-STS region during the initial allocation of visual attention over the field. This area was significantly activated by attention-directing cues or when reorienting to a novel unattended target was necessary (Nobre et al., 1997; Corbetta et al., 2000; Downar et al., 2000;Hopfinger et al., 2000). This view is also in line with the work ofParasnis and Samar (1985) showing that, under certain conditions, deaf individuals redirect their attention more readily than hearing controls.
Although the functional significance of the change observed in the post-STS is at present unknown, the finding that this polymodal area in humans (Calvert et al., 2000; Downar et al., 2000; Callan et al., 2001) is altered after early deafness provides additional support for compensatory plasticity in humans. A possible mechanism for this plastic change is suggested by animal studies in which sensory deprivation leads to an over-representation of the remaining senses in polymodal areas. In the case of early deafness, it is likely that in the absence of competition from auditory input, visual inputs colonize and recruit the post-STS in the service of visual processing. Importantly, the recruitment of this area in our study was specific to the velocity task, indicating that this kind of altered organization is not the result of anarchic sprouting, but rather stems from an organized, functionally driven process.
This study cannot directly address whether the changes in cerebral organization described are attributable to alterations in the processing of visual information brought about by auditory deprivation (e.g., greater attention to the periphery) or whether changes occur in these specific neural systems because their anatomy and/or physiology confers a greater capacity for neuroplasticity. In addition, it is at present unclear whether these changes only occur after early auditory deprivation or would also be observed in later deafened individuals or late learners of American sign language. Indeed, although there is a wealth of data documenting that, within some systems, altered sensory experience during early periods of development leads to greater plastic changes than those occurring later, other systems maintain the ability to reorganize even in adulthood. It will be important in future research to test individuals that become deaf late in life or acquire American sign language late in life.
To conclude, this study identified specific shifts in the organization of neural systems important in motion processing as a result of congenital deafness and early acquisition of sign language. Our findings indicate that not all functions and not all brain areas are equally susceptible to different kinds of early experience. Hence, different and separable changes were observed as a function of the task requirements and of the spatial location of attention and sensory and language experience. These observations provide strong evidence that human neuroplasticity is highly specific.
Footnotes
- Received June 11, 2001.
- Revision received August 2, 2001.
- Accepted August 29, 2001.
This work was supported by the Charles A. Dana Foundation, by National Institute of Deafness and Other Communicative Disorders Grants RO1-DC04418-01 (D.B.) and 7-RO1-DC00481 (H.N.), and by Department of Defense Grant DAMD17-93-V-3018 to the Georgetown Institute for Cognitive and Computational Sciences. This work would not have been possible without the enthusiastic support of the students and staff at Gallaudet University, in particular Dr. D. B. Galvan, and the advice of Dr. David C. Corina regarding recruitment of subjects. We are also thankful to T. Monacelli for help with figures and C. S. Green for help in data analysis.
Correspondence should be addressed to Dr. Daphne Bavelier, Brain and Cognitive Sciences, University of Rochester, Meliora Hall 270268, Rochester, NY 14627-0268. E-mail:daphne{at}bcs.rochester.edu.
- Copyright © 2001 Society for Neuroscience