
Abstract
The sleeping rat cycles between two well-characterized physiological states, slow-wave sleep (SWS) and rapid-eye-movement sleep (REM), often identified by the presence of large-amplitude irregular activity (LIA) and theta activity, respectively, in the hippocampal EEG. Inspection of the activity of ensembles of hippocampal CA1 complex-spike cells along with the EEG reveals the presence of a third physiological state within SWS. We characterize the hippocampal EEG and population activity of this third state relative to theta activity and LIA, its incidence relative to REM and LIA, and the functional correlates of its population activity. This state occurs repeatedly within stretches of SWS, occupying ∼33% of SWS and ∼20% of total sleep, and it follows nearly every REM episode; however, it never occurs just before a REM episode. The EEG during this state becomes low in amplitude for a few seconds, probably corresponding to “small-amplitude irregular activity” (SIA) described in the literature; we will call its manifestation during sleep “S-SIA.” During S-SIA, a small subset of cells becomes active, whereas the rest remain nearly silent, with the same subset of cells active across long sequences of S-SIA episodes. These cells are physiologically indistinguishable from ordinary complex-spike cells; thus, the question arises as to whether they have any special functional correlates. Indeed, many of these cells are found to have place fields encompassing the location where the rat sleeps, raising the possibility that S-SIA is a state of increased alertness in which the animal's location in the environment is represented in the brain.
- sleep
- EEG
- small-amplitude irregular activity
- SIA
- hippocampus
- place cell
- ensemble
- CA1
- low-amplitude sleep
- phase d'activation transitoire
- microarousal
- rat
The sleeping rat cycles between two well-characterized physiological states, slow-wave sleep (SWS) and rapid-eye-movement sleep (REM), often defined by their cortical and hippocampal EEG (for review, see O'Keefe and Nadel, 1978; Gottesmann, 1992; and Skaggs and McNaughton, 1998). During SWS and drowsy waking states, the EEG at the level of the hippocampal fissure exhibits predominantly large-amplitude waves with power distributed across a broad range of frequencies, often called “large-amplitude irregular activity” (LIA), punctuated by fluctuations called “sharp waves” (Buzsáki, 1986). The population activity of CA1 pyramidal cells in LIA is generally diffuse, with large increases in activity during sharp waves (Buzsáki et al., 1992). The neocortex exhibits large-amplitude, slow waves with occasional brief 7–14 Hz oscillations called “spindles” (Gottesmann, 1964, 1992; Steriade et al., 1993;McCormick and Bal, 1997; Siapas and Wilson, 1998). In REM, corresponding in humans to dream sleep (Dement and Kleitman, 1957a,b), as well as in active waking states, the rat hippocampal EEG exhibits strong 7–8 Hz rhythmicity, called “theta activity,” and the neocortical EEG exhibits small-amplitude, fast (“desynchronized”) activity (Green and Arduini, 1954; Gottesmann, 1964, 1992; Vanderwolf, 1969; Vanderwolf et al., 1975; O'Keefe and Nadel, 1978). CA1 population activity during REM also resembles that seen during awake exploration (Skaggs and McNaughton, 1998; Louie and Wilson, 2001), in that individual pyramidal cells show occasional brief periods of activity surrounded by virtual silence.
The present study arises from observations that a third physiological state, differing from both theta activity and LIA, is revealed when hippocampal population activity patterns are inspected along with the hippocampal EEG of the sleeping rat. During this state, the EEG becomes very low in amplitude, and a small subset of cells becomes active while the rest of the cells remain nearly silent; the same cells are usually active across long sequences of such episodes. This state occurs repeatedly within periods of SWS and immediately after every REM episode, but never just before REM. The EEG appears to be similar to a pattern that has been called “low-amplitude irregular activity” (Pickenhain and Klingberg, 1967), also called “small-amplitude irregular activity” (SIA) (Vanderwolf, 1971; Whishaw, 1972; for review, see O'Keefe and Nadel, 1978). These early studies reported the presence of SIA in rats on occasions when an ongoing movement was abruptly stopped or when they suddenly changed from a resting or sleeping state to an alert state (as indicated by neocortical desynchronization) without moving. Similar EEG states have also been reported in the sleeping rat, called “arousal-like periods” (Roldán et al., 1963) or “low-amplitude sleep” (Bergmann et al., 1987). Because the hippocampal physiology of the sleep state we observe is similar to that of SIA, but to distinguish the general physiological state from its more specific manifestation during sleep, we will refer to the episodes that occur during sleep as “Sleep-SIA” (S-SIA).
Our aim is to characterize the EEG, hippocampal population activity, and incidence of S-SIA relative to REM and LIA and to explore the possible functional significance of the cells active in S-SIA. Many hippocampal pyramidal cells have strong spatial correlates; each hippocampal “place cell” fires rapidly only when the rat is in a particular delimited portion of its environment, called its “place field” (O'Keefe and Dostrovsky, 1971; O'Keefe, 1976; for review, see O'Keefe and Nadel, 1978). The possibility that S-SIA is a state of heightened arousal suggests a possible functional correlate of the cells active during S-SIA: they might be cells with place fields in the current location of the rat. The correspondence between the cells active during S-SIA and the cells with place fields in the “nest” (where the rat sleeps) is therefore assessed. Preliminary observations were reported by Skaggs (1995) and Jarosiewicz and Skaggs (1999,2001).
MATERIALS AND METHODS
Subjects. Data were collected from six male Sprague Dawley rats, weighing between 350 and 500 gm at the time of surgery. Each rat was housed individually in a 12 hr light/dark cycle in a temperature-controlled room with food and water available ad libitum. For approximately 1 week before surgery, each rat was handled and gradually accustomed to the recording room environment for several hours a day and was food-deprived to 80–95% of its ad libitum weight to motivate it to run for randomly scattered food pellets so that recordings could be tracked between sleep and waking behavior. Recordings were made during the light phase of the cycle.
Surgery. All surgery was performed under sterile conditions. The rat was anesthetized with Equithesin (3 ml/kg, i.p.), and boosts of Metofane (inhalant) or additional Equithesin were given during surgery as necessary. Once deeply anesthetized, the rat was secured in earbars in a Kopf stereotaxic frame (David Kopf Instruments, Tujunga, CA). A small (∼1 cm) incision was made along the midline of the scalp to expose the cranium. Skin and connective tissue were retracted, and five to six small holes were drilled into the cranium to accommodate jeweler's screws, one of which was later connected to a ground channel. Another larger hole was drilled over the right hippocampus (∼2 mm diameter, centered on anteroposterior, −3.5 mm; mediolateral, 2–3 mm from bregma). The dura was retracted, and the exposed cortex was covered with sterilized petroleum jelly. The base of a “hyperdrive,” which contained 12 individually drivable tetrodes and two single-channel reference/EEG electrodes all bundled to ∼1.5 mm diameter at the base, was lowered toward the exposed cortex. The hyperdrive was cemented in place with dental acrylic, which was anchored to the cranium by the jeweler's screws. Just after surgery, the tetrodes and reference electrodes were lowered ∼680 μm toward the hippocampus, and the wound was covered with antibiotic ointment and a mild local anesthetic ointment. Over the next few days, the wound was cleaned and ointment was reapplied daily until the animal recovered. Tetrodes were gradually lowered over a few hours each day until they arrived at the hippocampal CA1 pyramidal cell layer (∼2 mm deep), which was identified by its well-characterized EEG and spike waveform characteristics (Ranck, 1973; Fox and Ranck, 1975, 1981; O'Keefe, 1976; O'Keefe and Nadel, 1978; McNaughton et al., 1983; Buzsáki et al., 1992; Skaggs et al., 1996).
Electrophysiology and recording. For data acquisition, the top of the hyperdrive was connected to a headstage containing preamplifiers and a ring of light-emitting diodes used for position tracking by a camera mounted on the ceiling over the recording chamber. The headstage was attached to a pair of soft, flexible cables, partially suspended by a counterweight system to help ease the load on the rat's head. The cables ascended through the ceiling of the recording chamber into the adjoining room, where they connected to the Cheetah recording system (Neuralynx, Tucson, AZ), consisting of eight 8 channel amplifiers with software-configurable high- and low-pass filters, feeding their output to a custom-made controller and analog-to-digital processor. During recording, signals from each channel of each tetrode were filtered to 600–6000 Hz, sampled at 32 kHz per channel, formatted, and fed to a Sun Ultrasparc 2 workstation (Sun Microsystems, Palo Alto, CA) running custom-written acquisition and control software. Each time the signal on any one of the tetrode channels crossed a specified threshold, a 1 msec sample of data from all four channels of that tetrode was written to disk, beginning 0.25 msec before the threshold was crossed, capturing the spike waveform on each channel along with its timestamp. An EEG was also recorded from one specified channel on each tetrode and from an EEG electrode near the hippocampal fissure at a bandwidth of 1–100 or 1–500 Hz and a sampling rate of 2461 Hz. At the same time, position records containing information about the distribution of light across the video image were acquired at 60 Hz and written to disk. The rat's velocity was calculated off-line as the change in position two timestamps before and two timestamps after the current timestamp, divided by the elapsed time. The error of the tracker is approximately one-half the width of the ring of light-emitting diodes on the headstage, or 2.5 cm.
Cheetah recording software on a Sun workstation was used to monitor spike waveforms on each of the four channels of each of the 12 tetrodes and one EEG trace from each tetrode and the EEG electrode, and an audio monitor could be used to listen to signals from any single channel. Once an adequate number of stable CA1 complex-spike cells were obtained and robust theta activity was visible on one of the EEG channels during locomotion, a recording session was performed. EEG signals, spike waveforms, and the position of the rat were recorded simultaneously while the rat slept, ran for randomly scattered food pellets, or performed some sequential combination of the two. Approximately 10–30 recording sessions (“data sets”), each on separate days, were performed for each animal until damage from the tetrodes made cells difficult to find or until the animal otherwise became unusable, at which point the animal was humanely killed and its hyperdrive was removed for reuse.
Cell isolation. Spike waveforms, EEG signals, and the rat's position data, along with their respective timestamps, were stored onto disk during the recording session for off-line analysis. Spikes were assigned to individual cells by cluster-cutting in Xclust (written by M. Wilson, Massachusetts Institute of Technology, Cambridge, MA), which plots any two selected parameters (e.g., spike height, spike width, spike root-mean-square area, spike time, rat position, etc.) of all spikes recorded from that tetrode against one another as a scatterplot. For each tetrode in each data set, the experimenter drew polygons around clusters of spike parameter values in these various two-dimensional projections; ideally, each cluster in the multidimensional parameter space contained spikes from a single potential unit. Units were then judged to be complex-spike cells, theta cells (corresponding to pyramidal cells and interneurons, respectively) (Fox and Ranck, 1981), noise, or a chewing artifact, according to their waveforms, interspike interval histograms, spatial selectivity, etc.; only those units judged to be relatively clean, well-isolated complex-spike cells were included in further analysis.
Behavioral task. In some data sets, recordings were performed only while the rats were asleep in a round bowl or small (25 × 20 cm) cardboard box lined with a towel (i.e., the nest). In others, the sleep was preceded and/or followed by a run session, in which the rat ran around eating randomly scattered food pellets; the run sessions allowed cell activity to be compared across sleep and waking states. The recording environment was either a square blue plastic table top (70 cm2) surrounded by distant blue curtains containing four cues or a round paper-covered plywood floor bounded by a large gray cylindrical wall (76 cm diameter, 50.8 cm tall) with a white card covering 90° of arc on one side. The nest in these data sets was placed on the floor of the recording environment such that the rat could freely enter and exit the nest during the run session, allowing the possibility to be tested that the cells active in S-SIA had place fields in the nest.
Data analysis. Sleep states were delineated into categories using two methods. The first method was entirely manual: plots containing rasters of all of the simultaneously recorded spikes, at least one good EEG signal, and the rat's velocity were examined by the experimenter. LIA, REM, and S-SIA onsets and offsets were delineated by hand to the nearest 100 msec according to the following criteria: periods during which LIA was present in the EEG were classified as LIA; periods in which theta activity was present in the EEG and the rat was not moving were classified as REM; and periods in which SIA was present in the EEG and the population activity was sparse and fairly constant were classified as S-SIA. Periods in which theta activity was present in the EEG and the rat was moving were classified as waking.
To reduce the level of subjectivity in the delineation of sleep states, a more objective method was developed for some analyses that relied on the consistent structure of population activity across S-SIA episodes. The “mean S-SIA population activity vector” was constructed for each data set by calculating the mean firing rate for each cell during all of the hand-delineated S-SIA episodes in that data set. This vector was then compared with the population activity vector in each 500 msec time bin throughout the sleep period. Those time bins with a population activity vector that was highly correlated with the mean S-SIA population activity vector (with threshold r = 0.6 or 0.8, depending on the correlation histogram for that particular data set) were grouped into S-SIA, and the rest were grouped into non-S-SIA. This method of sleep-state delineation has coarser temporal resolution, but it has the advantage of being more objective. The correlation between the categorization of each 100 msec epoch of sleep in hand-delineated sleep states versus population activity correlation-delineated sleep states was on average 0.45 ± 0.064, with the correlation-based delineation generally being more conservative than hand delineation in labeling a time period as S-SIA.
The population activity differences between S-SIA and the other hand-delineated sleep states were also quantified in terms of “sparseness” of population activity (Treves and Rolls, 1991), defined as the ratio <r>2/<r2>, where r is the vector of mean firing rates of the cells in a short interval of time. This ratio can also be written as (1/N × Σri)2/(1/N× Σri2), where ri is the mean firing rate of the ith cell over a given interval of time and Nis the total number of cells. Thus, sparseness is 1 when all cells are active at the same firing rate and approaches 0 when a very small fraction of cells are active and the rest are silent. When no cells are active, the sparseness is undefined. The mean sparseness was calculated for each of the hand-delineated sleep states (LIA, REM, and S-SIA) for each data set using 500 msec time bins. Because S-SIA has a characteristic population activity profile in which a small percentage of cells are active, S-SIA was expected to have the lowest mean sparseness.
The difference in EEG between S-SIA and the other sleep states was quantified in terms of mean total power in the EEG signal for that state. Total power is the root-mean-square area under the curve; thus, the higher the amplitude of the EEG in a given time interval, the higher its total power. The mean total power was calculated for each hand-delineated sleep state (LIA, REM, and S-SIA) in each of the above data sets, and to verify that the differences in EEG power were not attributable to subjectivity in the delineation of sleep states, the total power in the EEG was also calculated for sleep states delineated solely by population activity correlations (non-S-SIA vs S-SIA). Because EEG amplitude varies with electrode depth, the power in hand-delineated S-SIA and REM was normalized by the mean power in LIA in its data set, and the power in correlation-delineated S-SIA was normalized by the mean power in non-S-SIA in its data set. Thus, powers were expressed as a proportion of the mean power during LIA or non-S-SIA. Because S-SIA has a flattened EEG relative to LIA and REM, it was expected to have the lowest mean power.
The incidence of S-SIA episodes relative to REM episodes was also examined to quantify the observations that S-SIA never immediately precedes a REM episode (i.e., there is always some LIA before every REM episode) and that almost every REM episode is immediately followed by S-SIA. The first observation was quantified by cross-correlating the offsets of S-SIA episodes with the onsets of REM episodes in each data set using 5 sec bins. Because S-SIA never occurs just before REM, S-SIA offsets were expected to never coincide with REM onsets, producing a dip in the cross-correlation just before and at 0. The second observation was quantified by cross-correlating the offset of REM with the onset of S-SIA over all of the episodes in all the data sets. Because nearly all REM episodes were immediately followed by an S-SIA episode, REM offsets were expected to coincide with S-SIA onsets, producing a peak at 0 in the cross-correlation.
To reduce the level of subjectivity in the delineation of onsets and offsets of REM and S-SIA, these observations were also quantified by comparing the population activity before and after REM episodes with the mean S-SIA population activity vector. To quantify the incidence of S-SIA episodes over time before REM, the population activity for 1 min preceding each REM episode was divided into 5 sec bins, and the correlation between the population activity vector of each bin and the mean S-SIA population activity vector was calculated. (Because REM often evolves out of LIA gradually, the hand-delineated REM onset times were somewhat arbitrary; thus, there is still some subjectivity to this analysis.) To quantify the occurrence of S-SIA episodes immediately after REM episodes, the population activity for 30 sec after each REM episode was divided into 2 sec bins, and the correlation between the population activity vector of each bin and the mean S-SIA population activity vector was calculated. (The transition out of REM was always quite abrupt, so the REM offset times were more accurate.)
To test whether the cells active during S-SIA were cells with place fields in the location in which the rat was sleeping, “correlation maps” were made using data sets in which a fairly long sleep session was recorded in the same data set as a run session, the rat entered the nest repeatedly during the run session, and abundant cells were tracked between the sleep and run sessions. A vector of the mean firing rate of each cell was constructed for each pixel in the environment (the “mean run population activity vector”). The “S-SIA population activity vector” was constructed in one of two ways: if the sleep states had been delineated previously by hand, then the mean of the population activity across all of the episodes of S-SIA was used, as above. For the rest of the data sets, an idealized S-SIA population activity vector was constructed: the raster of population activity was examined to determine which cells were S-SIA-active and which were not (these groups were fairly consistent across S-SIA episodes), and the population activity vector consisted simply of 1's for S-SIA-active cells and 0's for the rest of the cells (because the firing rates of the S-SIA-active cells in these data sets were fairly similar to one another, this approximation did not severely impair subsequent analysis, because correlation coefficients are insensitive to scale). Then, for each pixel in the environment, the correlation coefficient between the S-SIA population activity vector and the mean run population activity vector was determined, and the result was a correlation map of the population activities during the run session and S-SIA. Peaks in the correlation map correspond to locations in the environment for which the population activity during the run session most resembles the population activity during S-SIA. For instance, if the S-SIA-active cells are place cells with fields spanning the location in which the rat is sleeping, the peak of the correlation map should occur in the location of the rat's nest.
RESULTS
Structure of population activity and EEG in LIA, REM, and S-SIA
Consistent with the results of many previous studies (for review, see O'Keefe and Nadel, 1978), we find that during SWS and drowsy waking states, the EEG at the level of the hippocampal fissure exhibits predominantly LIA with occasional sharp waves, often accompanied at the pyramidal cell layer by ripples. The population activity during LIA (Fig. 1C) is generally diffuse, with large increases in activity across the entire population during sharp waves. REM (Fig. 1B) resembles awake exploration (Fig. 1A) in both EEG and CA1 population activity: theta activity is present in the EEG, and individual cells occasionally show bursts of activity surrounded by silence, as when the rat is running through the place fields of recorded cells. However, we also observed in all animals the existence of a third physiological state, intermixed with LIA during all periods of SWS and after nearly every REM episode, in which the EEG abruptly becomes very low in amplitude for a few seconds and a small subset of cells (∼3–5%) becomes very active while the rest of the cells remain nearly silent (see Figs. 1D, 6A,C,E,F); the same subset of cells is usually active across many consecutive episodes (see Figs. 1D,E, 6A,E,F). Toward the end of these episodes, the active cells gradually decrease their activity and the EEG amplitude gradually increases, sometimes exhibiting some low-amplitude, low-frequency (type 2) theta activity and often terminating abruptly with a sharp wave before returning to LIA (see Figs. 1E, 6A,C,E). The duration of episodes ranges from ∼200 msec to many seconds. The EEG during this state most likely corresponds to the previously described low-amplitude irregular activity (Pickenhain and Klingberg, 1967), also called small-amplitude irregular activity or SIA (Vanderwolf, 1971; Whishaw, 1972). To distinguish the general physiological state of SIA from its more specific manifestation during sleep, we refer to the SIA that we observe during sleep as S-SIA.
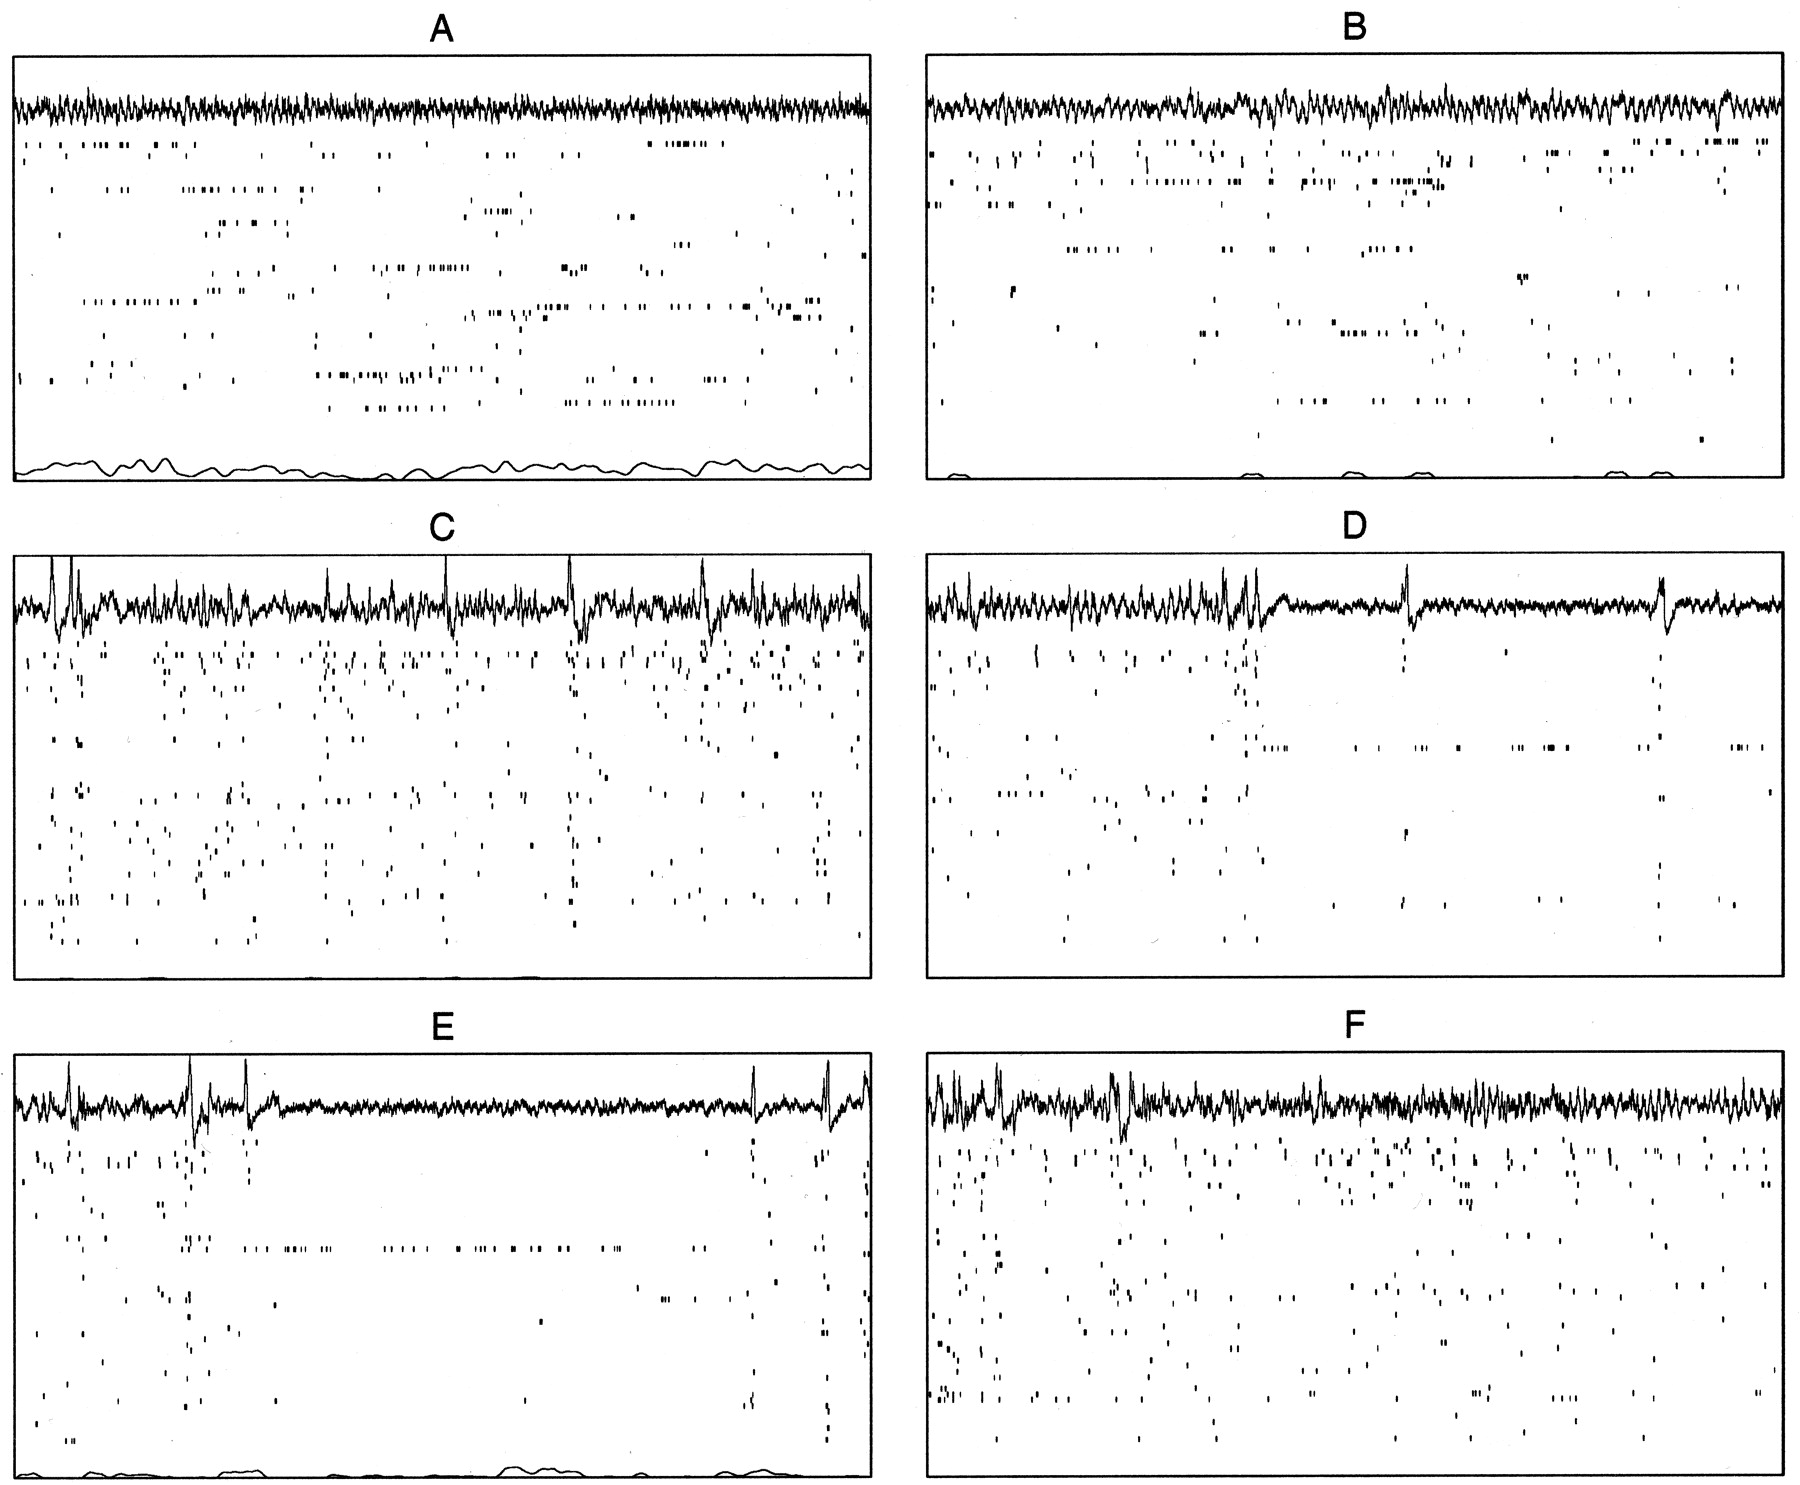
Hippocampal physiological states. Fifteen second sample epochs from a single recording session (p119-03) showing an EEG recorded near the hippocampal fissure (top); a raster of spikes from the ensemble of 54 simultaneously recorded CA1 pyramidal cells (middle); and the animal's velocity, with 0 aligned at the bottom of the plot (bottom).A, Awake exploration of the recording environment. Note the theta activity in the EEG trace, the population activity reflecting the place selectivity of the recorded cells, and the nonzero velocity, indicating movement. B, REM. Note the regular theta oscillation in the EEG and the characteristic population activity, both similar to run. The velocity trace is mostly 0, indicating a lack of gross movement. (The occasional transients in the velocity traces are attributable to noise in the position data.)C, SWS. Note the large-amplitude irregular activity and occasional sharp waves in the EEG, corresponding, respectively, to periods of diffuse population activity and sudden increases in activity across the CA1 population. D, S-SIA emerging from a REM episode. Note the reduced-amplitude EEG and the unusual population activity profile, with a small percentage of continuously active cells and the rest nearly silent. During the two sharp waves, the population activity transiently increases. The transition into S-SIA is always quite abrupt and often follows one or two sharp waves.E, A later episode of S-SIA, this time occurring within LIA during SWS. Note that the same subset of cells is active as inD. F, An example of the transition into REM, which always evolves gradually out of LIA.
Quantification of population activity and EEG characteristics
The existence of repeating patterns of activity can be seen in population autocorrelation plots, in which each pixel shows the correlation of the population activity vectors at two points in time. Figure 2A shows such a plot, constructed from data recorded during 12 min of SWS; the red blocks are areas of high correlation, corresponding to S-SIA episodes. The fact that the level of red does not decrease outward from the diagonal indicates that S-SIA population activity patterns are strongly correlated across the entire 12 min. Indeed, similar plots made from much longer SWS periods often show the same level of correlation across time. Three data sets (p081-16, p121-01, and p121-04) contained S-SIA-active cells that could be followed between prerun sleep and postrun sleep; of the 13 such cells, 6 were active in both prerun S-SIA and postrun S-SIA, and each of these data sets contained at least one cell that was active in both and one cell that was not.

EEG and population activity structure of S-SIA.A, Population activity vector autocorrelation matrix from a 12 min sample of SWS, using 500 msec bins (from data set p108-03). Blue areas correspond to low correlation values and red areas correspond to high correlation values. The red blocks off the diagonal reveal highly consistent patterns of population activity occurring repeatedly throughout the 12 min time interval; these correspond to episodes of S-SIA.B, Scatterplot of sparseness versus EEG total power for each 2 sec epoch from the entire sleep period in data set p108-03. This data set exhibits a robust clustering corresponding to periods of LIA, REM, and S-SIA: LIA has high EEG power and high sparseness, REM has high EEG power and low sparseness, and S-SIA has low EEG power and low sparseness. Each point is color-coded according to the hand-delineated sleep state that occupies at least one-half of the 2 sec period that the point represents. C, D, Power spectra of hand-delineated sleep states. Power spectra were constructed using Welch's averaged, modified periodogram method, with a window size of 1 sec and a sampling frequency of 492.2 Hz. Only episodes at least 2 sec long were included in this analysis, totaling 1615.3 sec of S-SIA, 1293.9 sec of REM, and 5749.9 sec of LIA. S-SIA has a lower power across the frequency spectrum than either LIA or REM. It has a small peak in the low-frequency (type 2) theta range (∼6 Hz). REM shows a peak at type 1 theta frequency (∼7 Hz), and LIA has a wide peak at ∼2–4 Hz and remains higher than REM and S-SIA across the spectrum.D, The same data are plotted against log power to reveal the power differences in the high frequencies. Again, S-SIA has a lower power than LIA throughout the spectrum. REM has another peak around gamma frequency (35–90 Hz), which does not occur in LIA or S-SIA. The source of the peak near 90–95 Hz in all spectra is unknown. The sharp peaks at 60, 180, and 195 Hz are attributable to artifact.
For an initial examination of the relationship between population activity and EEG throughout sleep, episodes of LIA, REM, and S-SIA were delineated by visual inspection of EEG and CA1 population activity. In S-SIA, a small subset of cells is very active while the rest are nearly silent; this effect was quantified using sparseness of population activity. As described in Materials and Methods, sparseness is 1 when all cells are active at the same firing rate and approaches 0 when only a small fraction of cells are active; thus, S-SIA was expected to have a low average sparseness. The finding that the EEG flattens during S-SIA relative to LIA and REM was quantified using “total power” in the EEG, which is the root-mean-square amplitude; thus, S-SIA was expected to have a low total power. As an example, the sparseness of population activity and total power in the EEG were calculated for a single data set, and a scatterplot was constructed of sparseness versus EEG power for each 2 sec bin (Fig. 2B). Each point in the scatterplot was color-coded according to the hand-delineated sleep state that occupies at least one-half of the 2 sec period that the point represents. This data set exhibits a robust clustering corresponding to periods of LIA, REM, and S-SIA: LIA has high EEG power and high sparseness, REM has high EEG power and low sparseness, and S-SIA has low EEG power and low sparseness.
EEG power spectra
To check for differences in the frequency content of the EEG in the different sleep states, power spectra were constructed for manually delineated LIA, REM, and S-SIA episodes (Fig. 2C,D) using five data sets from four different animals with good EEG signals, abundant cells including at least one S-SIA-active cell, and fairly long bouts of continuous sleep including at least one REM episode (data sets p094-04, p108-03, p119-03, p119-07, and p121-04). S-SIA had a lower power across the frequency spectrum than either LIA or REM, corresponding to its low amplitude, and had a small peak in the low-frequency theta range (∼6 Hz), possibly corresponding to low-amplitude type 2 theta frequency, which was sometimes visible in the raw EEG toward the end of longer episodes (see Figs.1E, 6C,F). REM showed a peak at type 1 theta frequency (∼7 Hz), and LIA had a wide peak around 2–4 Hz and remained higher than REM and S-SIA across the spectrum.
Changes in mean population activity associated with S-SIA
In six data sets from five different animals (p094-04, p098-01, p108-03, p119-03, p119-07, and p121-04), contributing 157 hand-delineated S-SIA episodes of at least 3 sec duration, changes in population activity associated with S-SIA episodes were investigated by constructing peri-event time histograms of the mean population activity surrounding the onset (Fig.3A) and offset (Fig.3B) of S-SIA episodes. The mean population activity transiently increased slightly at the onset of S-SIA episodes (Fig.3A), which is probably the combined effect of the increase in activity across the entire population associated with the one or more sharp waves that often precede S-SIA episodes and the sudden burst of activity from the few S-SIA-active cells. The mean population activity then decreased into the episode as the S-SIA-inactive cells became nearly silent and the S-SIA-active cells decreased their activity. These changes in mean population activity over time around S-SIA onset were highly significant (two-way ANOVA with 20 and 156 df;F = 9.512; p < 10−15). The mean population activity decreased in the last few seconds of S-SIA, reflecting a gradual decline of activity of the S-SIA-active cells near the end of the episode (Fig. 3B); the decline in the last 3 sec of S-SIA is not an artifact of averaging across long and short episodes, because only S-SIA episodes lasting ≥3 sec were used in this analysis. The population activity abruptly increased again just after S-SIA offset, almost always being terminated by a sharp wave, and returned to baseline levels associated with LIA. These changes in population activity over time around S-SIA offset were highly significant (two-way ANOVA with 20 and 156 df; F = 11.2; p< 10−15).

EEG and population activity structure of S-SIA. A, B, Changes in mean population activity associated with S-SIA. Peri-event time histograms were constructed for 5 sec windows around S-SIA onsets and offsets. The average firing rate of the population of recorded cells was calculated by dividing the total number of spikes across the population in each 500 msec bin by the total number of cells in the population. Only episodes lasting >3 sec were used in this analysis to ensure that any structure emerging in the 3 sec after S-SIA onset and before S-SIA offset reflected actual population activity changes within episodes rather than an artifact of averaging episodes of varying lengths.A, Peri-event time histogram of population activity aligned at S-SIA onset. The mean population activity increases slightly at the onset of S-SIA episodes, a combined effect of the increase in activity across the entire population associated with the one or more sharp waves that often precede S-SIA episodes and the sudden burst of activity from the few S-SIA-active cells. The mean population activity then decreases into the S-SIA episode as the S-SIA-inactive cells become nearly silent and the S-SIA-active cells gradually decrease their activity (F = 9.512; p < 10−15). B, Peri-event time histogram of population activity aligned at S-SIA offset. The total population activity decreases as the activity of the S-SIA-active cells declines in the last few seconds of S-SIA and increases transiently just after S-SIA offset because sharp waves often terminate S-SIA episodes (F = 11.2; p < 10−15). C, D, Sparseness = <r>2/<r2>, where r is the vector of mean firing rates of the cells, using 500 msec time bins. C, Sparseness in hand-delineated LIA, REM, and S-SIA episodes. The mean sparseness during S-SIA is significantly smaller than during LIA but is not significantly different from REM (F = 11.17;p = 0.0048). D, Sparseness in correlation-delineated sleep states (S-SIA and non-S-SIA). The mean sparseness during S-SIA is significantly smaller than during non-S-SIA (p = 0.0059). E,F, EEG total power is the root-mean-square area under the curve of the EEG, using 492.2 samples/sec. E, EEG total power in hand-delineated LIA, REM, and S-SIA episodes, normalized by the total power in LIA in each data set. The mean total power in the EEG is significantly smaller in S-SIA than both REM and LIA (F = 19.63; p = 0.0008).F, EEG total power in correlation-delineated sleep states (non-S-SIA and S-SIA), normalized by the total power in non-S-SIA. The mean total power in the EEG is significantly smaller in S-SIA than in non-S-SIA (p = 0.0049). Thehorizontal dashed lines at EEG Power = 1 represent the normalized power during LIA (E) and non-S-SIA.
Sparseness
In five data sets from four different animals with good EEG signals, abundant cells including at least one S-SIA-active cell, and fairly long bouts of continuous sleep including at least one REM episode (data sets p094-04, p108-03, p119-03, p119-07, and p121-04), the sparseness of the population activity of both hand-delineated sleep states and correlation-delineated sleep states was calculated across animals (Fig. 3C,D). These data sets contributed 1/33, 2/47, 2/57, 1/60, and 5/46 S-SIA-active/total recorded cells, respectively, for a total of 11/243 cells. Note that this ratio slightly overestimates the mean percentage of S-SIA-active cells, because only data sets containing at least one S-SIA-active cell were used in this analysis; when those data sets with no S-SIA-active cells are taken into account, the average percentage of cells active in S-SIA was ∼3%.
Because S-SIA has a characteristic population activity profile in which a small percentage of cells are continuously active and the rest are nearly silent, S-SIA was expected to have a low average sparseness. Using 500 msec time bins, the mean and SEM of the sparseness were calculated for hand-delineated LIA, REM, and S-SIA; these were 0.11 ± 0.01, 0.070 ± 0.010, and 0.053 ± 0.006, respectively (Fig. 3C). These means were significantly different (two-way ANOVA with 2 and 8 df; F = 11.17;p = 0.0048). Post hoc paired ttests verified that the sparseness during S-SIA was significantly smaller than during LIA (p = 0.016), but it was not significantly different from REM. The difference between the sparseness in S-SIA and REM was not expected to be large, because the cell activity during REM resembles that of awake exploration, during which cells are fairly silent most of the time but become active at fairly high rates when the rats enter their place fields. The mean and SEM of sparseness were also calculated for correlation-delineated non-S-SIA and S-SIA; these were 0.098 ± 0.008 and 0.054 ± 0.011, respectively (Fig. 3D). The sparseness during S-SIA was significantly smaller than during non-S-SIA (one-tailedt test; p = 0.0059). Note once again that the sparseness during S-SIA is probably slightly overestimated because only those data sets containing at least one S-SIA-active cell were used in these analyses.
EEG total power
The finding that the EEG flattens during S-SIA relative to LIA and REM was quantified using total power in the EEG, which is the root-mean-square of the EEG amplitude. The average total power was calculated for hand-delineated and population activity-delineated sleep states from the same data sets used in the sparseness analysis above. Because EEG amplitude varies with electrode depth, the total power was normalized by the mean total power during LIA in each data set. With the power during LIA set to 1, the mean relative power was 0.95 ± 0.08 during REM and 0.59 ± 0.04 during S-SIA (Fig.3E). The LIA, REM, and S-SIA means were significantly different (two-way ANOVA with 2 and 8 df; F = 19.63;p = 0.0008). Post hoc t tests verified that the total power in the EEG during S-SIA was significantly smaller than both LIA (p = 0.00001) and REM (p = 0.0063).
To verify that these differences in EEG power across sleep states were not attributable to experimenter bias during manual sleep-state delineation, the total power in the EEG was also calculated for sleep states delineated solely by population activity correlations. In each data set, the total power was normalized by the mean total power during non-S-SIA; thus, the power in the EEG during S-SIA was expressed as a proportion of the mean power of non-S-SIA in that data set. Indeed, the mean relative power during S-SIA was 0.83 ± 0.04 (Fig.3F), which was significantly smaller than non-S-SIA (t test; p = 0.0049). Thus, the power in the EEG is significantly lower during S-SIA than during non-S-SIA, even when S-SIA episodes are defined by population activity patterns alone; this finding confirms that the differences in EEG power across sleep states are not attributable to experimenter bias during manual delineation of sleep states and fortifies the claim that population activity patterns are consistent across long sequences of S-SIA episodes. In summary, LIA, REM, and S-SIA differ from one another in EEG power and sparseness of population activity in the following way: LIA has high EEG power and high sparseness, REM has high EEG power and low sparseness, and S-SIA has low EEG power and low sparseness.
Temporal structure of S-SIA
Duration and interepisode interval
In six data sets from five different animals with good EEG signals, abundant cells, and fairly long bouts of continuous sleep (p094-04, p098-01, p108-03, p119-03, p119-07, and p121-04), contributing 262 total hand-delineated S-SIA episodes, the temporal structure of hand-delineated S-SIA states was quantified in terms of duration of episodes and time interval between consecutive episodes. S-SIA is irregularly intermixed with LIA during periods of SWS (Fig.4A), occupying 33.4 ± 6.6% of SWS and 20.6 ± 3.8% of total sleep. A typical S-SIA episode lasts ∼2 sec, but the mean duration is higher (7.9 ± 0.6 sec) because of the positive skew of the duration histogram (Fig. 4B). Longer S-SIA episodes are interrupted every few seconds by sharp waves and an associated firing rate increase across the entire pyramidal cell population; thus, longer S-SIA episodes could also have been counted as a sequence of shorter S-SIA episodes. The mean interepisode interval is 36.9 ± 3.4 sec, and its distribution is also positively skewed (Fig.4C).

Temporal structure of S-SIA episodes.A, Correlation of population activity with the mean S-SIA population activity vector in 500 msec bins during a 10 min interval of LIA from data set p108-03, showing the detailed structure of S-SIA episode occurrence. Periods of high correlation generally correspond to S-SIA episodes. Note that S-SIA is irregularly intermixed with LIA during periods of SWS. B, Histogram of S-SIA episode durations. The mean duration is 7.9 ± 0.55 sec, but shorter episodes are more frequent than long ones. Longer S-SIA episodes are interrupted every few seconds by sharp waves and could also have been counted as a sequence of short episodes.C, Histogram of inter-S-SIA episode intervals. The mean is 36.9 ± 3.42 sec, and its distribution is also positively skewed.
Relation to REM episodes
In five data sets from four different animals with good EEG signals, abundant cells including at least one S-SIA-active cell, and fairly long bouts of continuous sleep including at least one REM episode (data sets p094-04, p108-03, p119-03, p119-07, and p121-04), the incidence of S-SIA with respect to REM was analyzed. These data sets contributed 3, 5, 7, 7, and 2 REM episodes and 45, 33, 39, 41, and 36 S-SIA episodes, respectively, for a total of 24 REM episodes and 194 S-SIA episodes. S-SIA was never observed to immediately precede REM, but it immediately followed nearly every REM episode. The first observation was quantified by cross-correlating the offsets of S-SIA episodes with the onsets of REM episodes in each data set (Fig.5A); the dip in the mean cross-correlation histogram just before and at 0 illustrates that no S-SIA episodes immediately preceded any REM episodes in these data sets. The second observation was quantified by cross-correlating the offset of REM with the onset of S-SIA over all of the episodes in all of the data sets (Fig. 5B); the peak at 0 illustrates that REM episodes were often immediately followed by S-SIA episodes.

Incidence of S-SIA relative to REM, based on 24 REM episodes and 194 S-SIA episodes from four animals.A, Cross-correlation of hand-delineated S-SIA offsets versus REM onsets. The dip before and at 0 represents the observation that S-SIA episodes never occur just before REM episodes.B, Cross-correlation of hand-delineated REM offsets versus S-SIA onsets. The peak at 0 represents the observation that REM offsets frequently correspond to S-SIA onsets (i.e., that most REM episodes are immediately followed by an S-SIA episode).C, Mean correlation of population activity with S-SIA in 5 sec bins for 1 min preceding each REM episode. On average, the correlation decreases significantly over time (F = 2.509; p = 0.0038), demonstrating that the incidence of S-SIA, as determined by population activity correlations, decreases over time before REM episodes. D, Mean correlation of population activity with S-SIA in 2 sec bins for 30 sec after each REM episode. The peak just at REM offset and rapid decline in correlation with S-SIA (F = 14.3;p < 10−15) demonstrate that REM episodes are often immediately followed by S-SIA episodes.
To verify that these results were not purely a result of the subjective delineation of onsets and offsets of both REM and S-SIA, these observations were also quantified by plotting the population activity correlations with the mean S-SIA population activity vector, a robust indicator of the presence of S-SIA, in the time periods before and after hand-delineated REM episodes. To quantify the decrease in S-SIA episodes over time before REM episodes, the population activity for 1 min preceding each REM episode was divided into 5 sec bins, and the correlation between each bin and the mean S-SIA population activity vector was plotted to verify that, on average, the correlation decreases over time (Fig. 5C). Because the number of REM episodes varied across data sets, correlation plots for all 24 REM episodes were used as independent observations in a two-way ANOVA rather than using the means for each data set. The decrease in the mean correlations across time bins was significant (two-way ANOVA with 12 and 276 df; F = 2.509; p = 0.0038), supporting the observation that S-SIA episodes become less and less frequent over the minute before a REM episode and rarely occur within seconds of REM. To quantify the observation that S-SIA episodes immediately follow most REM episodes, the population activity for 30 sec after each REM episode was divided into 2 sec bins, and the correlation between each bin and the mean S-SIA population activity vector was plotted (Fig. 5D). On average, the correlation with S-SIA just after REM is very high, indicating the robust presence of S-SIA episodes, and decreases to baseline levels over the next few seconds, corresponding to the termination of the S-SIA episodes of various lengths. Again, the decrease in the correlation across time bins was significant (two-way ANOVA with 15 and 345 df;F = 14.3; p < 10−15), supporting the observation that most REM episodes are immediately followed by S-SIA episodes.
Functional correlates of population activity in S-SIA
The cells active during S-SIA are otherwise physiologically indistinguishable from those not active during S-SIA (at least in terms of extracellularly observable properties); thus, the question arises as to whether S-SIA-active cells have any special functional correlates. Indeed, the population activity patterns during S-SIA appear similar to the population activity patterns that occur while the rat is awake and moving around inside the nest (Fig.6A,B). Furthermore, when the rat changes its location within the nest and falls back asleep, the cells active while it moves sometimes change from one subset to another (i.e., the rat moves between place fields within the nest), and the cells active in subsequent S-SIA episodes change accordingly (Fig. 6C–F). Thus, the possibility is raised that S-SIA-active cells are cells with place fields encompassing the location where the rat is sleeping; i.e., that S-SIA is a state of increased alertness in which the animal's location in the environment is represented in the brain.

The population activity in S-SIA may reflect the rat's current location. A, Two short S-SIA episodes within LIA. Note the flattening of the EEG and the characteristic population activity. B, Later in the recording, the rat is awake and moving around inside the nest. Note that the same subset of cells that was active in S-SIA is active here.C–F, SIA-active cells change as the rat changes position in the nest (from p119-03). Same format as before, except now with two additional traces: the rat's x andy coordinates are plotted as a function of time, just below the EEG trace, so that changes in the rat's location within the nest can be seen along with the raster. C, S-SIA while the rat is in first location. Note the S-SIA-active cell. (This is the same period of time as Fig. 1E; another example of S-SIA from this recording can be seen in Fig.1D.) D, The rat enters S-SIA and then wakes up and changes its location inside the nest; note that a different cell becomes active in this new location. E, An S-SIA episode shortly after the change in location. Note that the same cell that was active while the rat was awake in the new location is active in S-SIA. F, A later S-SIA episode. While the rat is sleeping in this new location, this new cell continues to be S-SIA-active.
To quantify the observation that S-SIA-active cells appear to have place fields in the location of the nest, correlation maps were made using six data sets from four different animals in which a good sleep session was recorded in the same data set as a run session, the rat entered the nest repeatedly during the run session, and at least one S-SIA-active cell was tracked between the sleep and run sessions (data sets p094-14, p116-05, p116-06, p119-03, p121-02, and p121-04). These data sets contributed 2/20, 3/45, 2/40, 2/44, 3/21, and 5/39 S-SIA-active/total recorded cells, respectively, that were tracked between run and sleep sessions (total: 17/209). For each pixel in the environment, the correlation coefficient between the S-SIA population activity vector and the mean population activity vector during run was determined, and the result was a correlation map (Fig.7A). Peaks in the correlation map correspond to locations in the environment at which the population activity during run most resembles the population activity during S-SIA. If the S-SIA-active cells are place cells with fields in the location in which the rat is sleeping, the peak of the correlation map should occur in the location of the rat's nest.

A, S-SIA population activity correlation maps. For each data set, the correlation between the S-SIA population activity vector and the mean population activity vector during run was plotted for each pixel of the environment. Blue areas correspond to low correlation values and red areas correspond to high correlation values (as shown by the scales to the right of each map). The peaks correspond to places in the environment where the population activity during run most closely resembles the population activity during S-SIA. The location of the sleeping nest within the environment is shown as ablack outline for each data set. The nest in p116-06 is rotated and shifted toward the left with respect to the nest in the other round environments, because the rat pushed it there early in the run session. The mean correlation in the nest was greater than expected by chance (p < 0.001), supporting the hypothesis that S-SIA-active cells tend to have place fields extending into the location in which the rat is sleeping. The mean inside-nest correlation values were also significantly higher than the mean outside-nest correlation values (F = 12.54;p = 0.016), demonstrating that the place fields of S-SIA-active cells are significantly more likely to be inside the nest than outside the nest. B, Two examples of cells that were not active during S-SIA but whose place fields in the run session extended into the nest. Black corresponds to areas in the environment where that cell had a high firing rate, andwhite corresponds to areas where that cell had a low firing rate (as shown by the scales to the right of each map); the black outline again corresponds to the location of the nest. The mean firing rate during S-SIA of cell 1009 (top) is 0.16 sec−1 and that of cell 1104 (bottom) is 0.36 sec−1; although these rates are toward the high end of S-SIA-inactive cells in this data set, they are significantly lower than those of the five cells that were clearly active during S-SIA in this data set (mean = 1.83 ± 0.63 sec−1; p = 0.002 and 0.0032, respectively). C, Mean firing rate of S-SIA-active and S-SIA-inactive cells outside and inside the nest during the run session. On average, cells that were S-SIA-active were more active inside the nest than outside the nest during run, and cells that were S-SIA-inactive were more active outside the nest than inside the nest during run. Paired one-tailed t tests confirmed that both of these differences were significant (p = 0.03 and 0.02, respectively), supporting the hypothesis that the hippocampal population activity during S-SIA reflects the rat's awareness of its current location in space.
In the data set with the square environment (p094-14), the nest was a circular bowl in the center of the square environment, and there was a clear peak in the correlation map in the nest (Fig.7A, top left). In the round environments, the nest was a box in the lower right-hand corner of the environment. The mean of the correlation values in all of the pixels inside the nest versus in the environment outside the nest was 0.44 versus −0.12, 0.17 versus 0.077, 0.46 versus 0.17, 0.17 versus 0.097, 0.26 versus 0.036, and 0.34 versus 0.028 for each data set, respectively, with a mean value across data sets of 0.31 ± 0.05 inside the nest versus 0.047 ± 0.040 outside the nest. To test the hypothesis that the mean correlation in the nest was greater than chance (0), the inside-nest means for each data set were compared with 0 using a one-tailed t test. The results were significant (p < 0.001), supporting the hypothesis that the activity during S-SIA resembles the place-field activity inside the nest during run more than would be expected by chance. To rule out the possibility that the S-SIA-active cells were simply more active than other cells everywhere in the environment, which would increase the correlation values everywhere, the mean inside-nest correlation values were compared with the mean outside-nest correlation values. Indeed, the mean inside-nest correlation values were significantly greater than the mean outside-nest correlation values (two-way ANOVA with 1 and 5 df; F = 12.54;p = 0.016), supporting the hypothesis that S-SIA-active cells are more likely to have place fields inside the nest than outside the nest.
Although most of the correlation maps clearly had at least one peak inside the nest, sometimes the peaks extended outside the nest, and sometimes peaks occurred entirely outside the nest. The peaks outside the nest are attributable to S-SIA-active cells with multiple place fields or, less frequently, to S-SIA-active cells with place fields located entirely outside of the nest. The converse, cells with place fields extending into the nest that were not clearly S-SIA-active, were also observed occasionally (Fig. 7B). The factors that determine whether particular S-SIA-active cells will have place fields in the nest and whether particular cells with place fields in the nest will be S-SIA-active are as yet unclear. On average, however, cells that were S-SIA-active were more active inside the nest (mean firing rate = 0.54 ± 0.24 sec−1) than outside the nest (mean = 0.13 ± 0.05 sec−1) during run, and cells that were S-SIA-inactive were more active outside the nest (mean = 0.085 ± 0.017 sec−1) than inside the nest (mean = 0.068 ± 0.014 sec−1) during run (Fig. 7C). These means were significantly different (paired one-tailedt test; p = 0.03 and 0.02, respectively), supporting the hypothesis that the hippocampal population activity during S-SIA reflects the rat's current location in space.
DISCUSSION
This study shows that SIA occurs frequently during sleep (S-SIA) in the rat and that hippocampal CA1 pyramidal cell activity during S-SIA is sparse, with the same subset of cells (3–5% of the total recorded population) active across long sequences of episodes. S-SIA episodes are irregularly intermixed with LIA during periods of SWS, occupying ∼33% of SWS and 20% of total sleep, usually lasting ∼2 sec but occasionally much longer, and occurring on average 30–44 sec apart. Although the possibility has not been ruled out that S-SIA-active cells are a different morphological class of cells, this seems unlikely, because S-SIA-active cells are otherwise similar to ordinary complex-spike (pyramidal) cells: they are recorded in the same layer of the hippocampus as other complex-spike cells, they fire complex spikes, they often have place fields, and the subset of cells active during S-SIA can change over time. The population activity during S-SIA statistically resembles the population activity during waking states while the rat is in the location of the nest, and S-SIA-active cells sometimes change when the rat changes its position in the nest, suggesting that S-SIA is a state of heightened arousal during which the rat's current location in space is represented in the brain. Although the correspondence between cells that are active during S-SIA and cells with place fields in the nest is not perfect, it is significantly higher than expected by chance, supporting the hypothesis that the hippocampal population activity during S-SIA reflects the rat's awareness of its current location in space.
In this study, S-SIA states were identified in two ways: by visual inspection and by correlation with the mean of the population activity vectors from the visually identified periods. Neither of these methods is completely objective, although the latter is more so. There are several possible approaches toward a completely objective way of identifying SIA epochs, using for example the clustering observable in Figure 2B or the high interevent correlations observable in Figure 2A. In the present article, it was considered desirable to aim for the most precise possible separation of S-SIA from non-S-SIA states, but other approaches are certainly possible and may be more useful in future studies.
Despite the similar appearance of the EEG during S-SIA to the waking SIA state described in the literature (Pickenhain and Klingberg, 1967;Vanderwolf, 1971; Whishaw, 1972), there is as yet no definitive evidence that they are actually the same physiological state. A more direct test would be to purposely wake a sleeping rat with a controlled stimulus, in the spirit of Pickenhain and Klingberg (1967), and to test whether the elicited EEG and population activity profile coincide with that of spontaneous S-SIA episodes in that data set. Furthermore, one could startle the rat during a run session while it is outside of the nest to test whether SIA appears in the EEG and S-SIA-like population activity occurs, with the active cells now representing the rat's current location rather than the location of the nest. If so, these findings would provide evidence that S-SIA actually corresponds physiologically to the SIA state reported in the literature, and furthermore, that the population activity in both forms of SIA represents the rat's current location.
A related question is whether S-SIA is actually the same behavioral state as waking SIA. Is S-SIA a sleep state whose physiology resembles that of waking SIA, in the same way that REM is a sleep state whose physiology resembles waking theta activity, or is it actually a waking state that repeatedly interrupts sleep? There is no consensus in the literature on an absolute definition of sleep and waking, but several characteristics are used heuristically to distinguish whether an animal is asleep or awake: motion, EEG, EMG, etc. During LIA and theta activity, whether a rat is awake or asleep can be determined by whether or not it is moving. In the case of S-SIA, such an assessment is inconclusive, because rats are reported to be motionless during waking SIA as well. Our observations that S-SIA occurs so frequently within LIA during SWS (often within minutes of REM onset), that it consistently occurs just after REM, and that its occurrence during sleep is consistent across animals support the idea that S-SIA is a sleep state. Conversely, our findings that the hippocampal population activity during S-SIA reflects an awareness of self-location and that S-SIA rarely occurs immediately before or during REM support the idea that S-SIA is a waking state.
A neocortical EEG might help shed some light on this issue, because it is often used along with a hippocampal EEG to delineate physiological states (Green and Arduini, 1954; Pickenhain and Klingberg, 1967;Vanderwolf, 1969; Whishaw, 1972; O'Keefe and Nadel, 1978; Gottesmann, 1992). For example, Gottesmann (1992) divides the sleep-waking cycle of the rat into seven states; in both of the waking states, the neocortical EEG is desynchronized, and in all the sleep states, it is not, with the exception of REM, during which neocortical desynchronization is present despite behavioral evidence of sleep (he does not characterize SIA at all). According to Roldán et al. (1963) and Bergmann et al. (1987), neocortical desynchronization does occur during S-SIA. Although their finding supports the idea that S-SIA is a state of heightened neocortical arousal, it should not be treated as definitive evidence that S-SIA is a waking state, because neocortical desynchronization also occurs during REM, a sleep state. Thus, the desynchronization of the neocortical EEG during S-SIA does not distinguish whether S-SIA is a waking state or simply another “paradoxical” sleep state of heightened neocortical arousal.
EEG-based criteria were developed as a secondary, post hocmeasure of behavioral state transitions; perhaps an EMG, a measure of muscle tone, would be more useful in distinguishing sleep and waking states, because it directly measures behavioral phenomena that originally motivated the conception of this dichotomy. In Gottesmann's (1992) characterization, all of the waking states exhibit higher-amplitude EMG signals, evidencing more muscle tone, than any of the sleep states; again, Gottesmann did not characterize SIA. Bergmann et al. (1987) did record EMG during S-SIA, finding it to be very low; they called this state low-amplitude sleep, basing the “sleep” part of their terminology on its low EMG amplitude. However, they also report observing low EMG amplitude in a waking state that fulfills their EEG criteria for SIA; thus, their data also fail to resolve whether S-SIA is a waking or a sleep state. The literature on the neocortical EEG, then, suggests that S-SIA should be thought of as a waking state, and the literature on the EMG suggests that S-SIA should be thought of as a sleep state; neither result provides a conclusive answer. It would be useful to compare the neocortical EEG and EMG profiles more systematically between waking SIA, elicited S-SIA, spontaneous S-SIA, and the other behavioral states; perhaps a systematic study could shed more light on this issue.
A third possibility to consider is that S-SIA (indeed, possibly all manifestations of SIA) is neither distinctly a sleep nor a waking state; instead, it might fall somewhere toward the middle of a continuum of levels of arousal. Such a continuum appears to exist, for instance, in humans, in whom the transition from waking to sleep is more accurately depicted as an interval of time rather than an instant, when both EEG and behavioral responsiveness are taken into account (Ogilvie and Wilkinson, 1988). Furthermore, during normal sleep in humans, transitory states of heightened arousal exist, lasting on the order of seconds to tens of seconds and occurring every 4–5 min, called “phases d'activation transitoire” (Schieber et al., 1968,1971; Ehrhart and Muzet, 1974) or “microarousals” (Halász et al., 1979; for review, see Terzano et al., 1991). These resemble arousal in EEG, EMG, and heart rate; they are often accompanied by shifts in posture or other movements; they occur more frequently during “lighter” stages of sleep than “deeper” stages; and they can be elicited by auditory stimuli, supporting the idea that they are states of increased arousal. Conversely, eliciting a large number of them seems to reduce the number of spontaneously occurring ones, so that their total incidence throughout the night is preserved (Ehrhart and Muzet, 1974); they do not reset the sleep cycle; and they are rarely recalled by the sleeper after awakening, supporting the idea that they are nevertheless a natural part of sleep. These microarousals are likely to be the human analog of S-SIA; like microarousals, perhaps S-SIA episodes are simply transient states of relatively heightened arousal that occur during normal sleep.
What, then, is the functional significance of SIA? Perhaps the most reasonable suggestion, based on the available evidence, is that SIA is a state in which the animal takes in and processes information from the sensorium without immediately acting on it. In contrast, the theta state occurs when information is actively used to guide ongoing locomotor behavior, and the LIA state occurs when information from the sensorium is either ignored or at least less deeply processed than in the other states. This study shows that SIA is not, as might have been thought, a rarely occurring curiosity but rather is comparable in prevalence to the LIA and theta states, and it provides a compelling functional correlate of its neural activity.
Footnotes
- Received July 2, 2001.
- Revision received October 30, 2001.
- Accepted November 20, 2001.
This material is based on work supported by National Institute of Mental Health Grant 2R37MH046823-11A1 (B.L.M.) and National Science Foundation Grant IRI-9720350 (W.E.S.), the University of Pittsburgh, the Center for the Neural Basis of Cognition, and a National Science Foundation Graduate Fellowship (B.J.). We thank György Buzsáki for his comments on an early draft of this document.
Correspondence should be addressed to William E. Skaggs, Department of Neuroscience, 446 Crawford Hall, University of Pittsburgh, Pittsburgh, PA 15260. E-mail: skaggs{at}bns.pitt.edu.
- Copyright © 2002 Society for Neuroscience