
Abstract
Developing neurons must respond to a wide range of extracellular signals during the process of brain morphogenesis. One mechanism through which immature neurons respond to such signals is by altering cellular actin dynamics. A recently discovered link between extracellular signaling events and the actin cytoskeleton is the WASP/WAVE (Wiscott-Aldrich Syndrome protein/WASP-family verprolin-homologous protein) family of proteins. Through a direct interaction with the Arp2/3 (actin-related protein) complex, this family functions to regulate the actin cytoskeleton by mediating signals from cdc42 as well as other small GTPases. To evaluate the role of WASP/WAVE proteins in the process of neuronal morphogenesis, we used a retroviral gene trap to generate a line of mice bearing a disruption in the WAVE1 gene. Using a heterologous reporter gene, we found that WAVE1 expression becomes increasingly restricted to the CNS over the course of development. Homozygous disruption of the WAVE1 gene results in postnatal lethality. In addition, these animals have severe limb weakness, a resting tremor, and notable neuroanatomical malformations without overt histopathology of peripheral organs. We did not detect any alterations in neuronal morphology in vivo or the ability of embryonic neurons to form processes in vitro. Our data indicate that WAVE1, although important for the general development of the CNS, is not essential for the formation and extension of neuritic processes.
- WAVE1
- knock-out
- gene trap
- CNS development
- neuronal morphogenesis
- actin dynamics
Introduction
The mammalian CNS is a highly organized network of cellular interactions that are formed by neurons as they translate a wide range of extracellular signals into appropriate morphological responses. The role of the actin cytoskeleton in the development of neuronal morphology has long been established; however, the exact molecular mechanisms underlying this relationship are only now beginning to be elucidated.
One established link between extracellular signaling events and the process of neuronal morphogenesis is the rho subfamily of GTPases, which includes rho, rac, and cdc42. However, this family of GTPases is not thought to interact directly with the actin cytoskeleton; rather, these proteins have been shown to regulate neuronal morphogenesis by effecting downstream components of their signaling cascades (Luo, 2000). The identification of the WASP/WAVE (Wiscott-Aldrich Syndrome protein/WASP-family verprolin-homologous protein) family of proteins, whose function is to regulate actin polymerization via a direct interaction with the Arp2/3 (actin-related protein) complex, has provided a mechanism through which extracellular morphogenic signals can be translated via rho GTPase signaling into changes in the cytoskeletal architecture of neurons (Symons et al., 1996; Miki et al., 1998a,b).
To date, five genes encoding individual WASP/WAVE family members have been cloned and characterized (Derry et al., 1994; Miki et al., 1996, 1998b; Bear et al., 1998; Machesky and Insall, 1998; Suetsugu et al., 1999). Members of this family can be subdivided into two groups, WASP [WASP and neuronal-WASP (n-WASP)] and WAVEs [WAVE/SCAR1 (suppressor of cAMP receptor defects), WAVE2, and WAVE3], on the basis of conserved N-terminal domains (Takenawa and Miki, 2001). However, all members of the WASP/WAVE family contain a C-terminal WCA (WASP-homology, cofilin-binding, acidic domain) region, which has been shown to be essential for the regulation of the actin cytoskeleton (Machesky et al., 1999; Banzai et al., 2000; Zalevsky et al., 2001). The WCA region serves as a scaffold to bind monomeric actin via the WH2 domain, and also associate with the Arp2/3 complex at the acidic domain. Through these interactions, the WASP/WAVE family imparts on the Arp2/3 complex the ability to nucleate actin branches (Machesky and Insall, 1998; Marchand et al., 2001).
Recently, Lanier et al. (1999) confirmed that proteins functioning as intermediates between cellular signaling cascades and the actin cytoskeleton play an important role in neuronal morphogenesis and CNS organization. In fact, mice lacking Mena, a protein involved in the regulation of growth cone organization, have specific defects in commissural fiber decussation (Gertler et al., 1996; Lanier et al., 1999). However very little is known about the in vivofunctions of other such proteins, especially in the CNS. To assess the role of WAVE family members in the developing and adult CNS, we used a retroviral gene trap to disrupt the WAVE1 gene in mice. This strategy allowed us to insert a reporter gene under the control of the WAVE1 promoter while functionally disrupting expression of the WAVE1 mRNA. To study the role of WAVE1 in neuronal morphogenesis, we ascertained the developmental expression of WAVE1 in heterozygous mice, and subsequently characterized the homozygous knock-out mice.
Materials and Methods
Northern analysis. Northern analysis was performed using commercially available human multitissue or brain region blots (Clontech, Palo Alto, CA) according to the instructions of the manufacturer. The probe was a 375 nt fragment corresponding to nucleotides 2145–2519 on the WAVE1 cDNA (GenBank accession number D87459). The probe was generated by in vitro transcription using T4 polymerase in the presence of32P dCTP (Amersham Biosciences, Arlington Heights, IL).
Taqman quantitative reverse transcription (RT) PCR. Tissues were homogenized in Triazol (Invitrogen, San Diego, CA) for RNA extraction. RT reaction using Superscript II kit (Invitrogen) was performed following the recommendations of the manufacturer, with one modification. Before single-strand DNA synthesis, 5 μg of RNA was digested with RNase-free DNase I for 15 min to get rid of any contaminating genomic DNA. Semiquantitative PCR was performed on Taqman 7700 (PerkinElmer Life Sciences, Emeryville, CA) in a multiplexing reaction in which amplification of WAVE1 mRNA and cyclophilin mRNA (internal standard) was performed in the same tube. FAM-labeled WAVE1 probe (5′CACCTCCGGCTCCTCTTCAGAT) and VIC-labeled cyclophilin probe (5′ AAGACTGAGTGGCTGGATGGCAAGCATGTGGTC) were used at 100 nm each (PerkinElmer Life Sciences) and combined with 100 nm of flanking WAVE1 primer pairs (forward: 5′CCCAGCCACTGCTTTGCA, reverse: 5′GGAGGAGCTGGGTGAAGAA) and cyclophilin primers (forward: 5′ TCCCAGTTTTTTATCTGCACTGC, reverse: 5′ GCCTTCTTTCACCTTCCCAAA).
Experiments were performed simultaneously for all tissues, and each point was sampled in triplicate. Levels of WAVE1 mRNA were compared among tissues using liver as a reference tissue. Differences in expression among various tissues and transgenic lines were calculated using the formula fold change = 2(−ΔΔCT) and expressed as a fold increase relative to the reference tissue.
Generation of WAVE1 knock-out mice. WAVE1 knock-out mice were generated by Lexicon Genetics (The Woodlands, TX) from Omnibank clone OST66260 using methods described previously (Zambrowicz et al., 1998). Once germline transmission had been validated, the WAVE1 (+/−) animals were mated with an animal with a C57JBL/6 background resulting in a 129Sv/lex × C57JBL/6 hybrid background. The WAVE1 knock-out line was maintained on this hybrid background for subsequent progeny.
Rapid amplification of cDNA ends-RCR. WAVE1 5′ untranslated region (UTR) was cloned by using the Invitrogen GeneRacer kit. Total RNA (5 μg) from WAVE1 knock-out mice (hippocampus/cortex) was used in the kit according to the instructions of the manufacturer. Briefly, 5 μg of total RNA was dephosphorylated with calf intestinal phosphatase, phenol/chloroform extracted, and ethanol precipitated. The dephosphorylated RNA was decapped with tobacco alkaline phosphatase, phenol/chloroform extracted, and ethanol precipitated. GeneRacer RNA Oligo was ligated to the 5′ end of the RNA, and the resulting mRNA was reverse-transcribed using SuperScript II RT with a LacZ-specific reverse primer [LacZ Race R1: CTGGCCTTCCTGTAGCCAGCTTTC (24 mer)]. PCR amplification was performed in a 50 μl reaction using GeneRacer 5′ primer and a reverse LacZ primer (LacZ Race R2: GGTGCGGGCCTCTTCGCTATTACG). After 30 cycles of PCR, 20 μl of the amplification reaction was analyzed on a 2% agarose–ethidium bromide gel. It was necessary to perform nested PCR to increase the specificity and sensitivity of the rapid amplification of cDNA ends (RACE) products for the 5′ end of the gene; 1.0 μl of the original PCR amplification was used as a template for nested PCR. GeneRacer 5′ nested and reverse-nested LacZ primers [LacZ Race R3: AAGTTGGGTAACGCCAGGGTTTTCC (25 mer)] were used under the same cycling parameters. Two specific RACE products were present on a 2% gel and cloned into the pGEMT-easy (Promega, Madison, WI) vector for sequencing.
PCR of WAVE1 5′UTR. PCR amplification was performed in a 25 μl reaction using 0.5 μl of cDNA (wild-type cortex), 2.5 μl of forward primer (10 μm), 2.5 μl of reverse primer (10 μm), 0.5 μl of dNTP solution (10 μm each), 2.5 μl of 10× PCR buffer containing 15 mmMgCl2, and 0.5 μl of Amplitaq (PerkinElmer Life Sciences). The cycling parameters were 4 min at 94°C for 1 cycle, 30 sec at 94°C, 30 sec at 60°C, 60 sec at 72°C for 30 cycles, and 7 min at 72°C for 1 cycle. After PCR, 20 μl of the amplification reaction was analyzed on a 2% agarose–ethidium bromide gel.
Western analysis. WAVE1 (−/−), WAVE1 (+/−) and wild-type mice [postnatal day 18 (P18)] were killed by cervical dislocation. The brains were removed, the cerebral cortex and hippocampus were isolated, and protein was extracted by homogenization in 1× RIPA lysis buffer (1% Nonidet P-40, 1% sodium deoxycholate, 0.1% SDS, 0.15m NaCl, 0.01 m sodium phosphate, pH 7.2, 2 mm EDTA, and protease inhibitors) and subsequent centrifugation at 13,000 ×g in an Eppendorff (Westbury, NY) microfuge. Protein concentrations were determined using the DC protein assay kit (Bio-Rad, Hercules, CA) according to the instructions of the manufacturer. Fifty micrograms of total protein from each animal was separated by SDS-PAGE and subsequently transferred to a nitrocellulose membrane. The membrane was blocked for 1 hr in PBS-T (0.1% Tween-20 dissolved in PBS) containing 5% dry milk. The membranes were incubated in a 1:1000 dilution of an anti-WAVE1 polyclonal antibody, a 1:200 dilution of an anti-WAVE2 polyclonal antibody (Santa Cruz Biotechnology), or a 1:200 dilution of an anti-WAVE3 polyclonal antibody (Santa Cruz Biotechnology) overnight at 4°C. The WAVE1 polyclonal antibody was generated against amino acids 435–451 using standard methods (Pocono Rabbit Farm, Canadensis, PA). The blots were washed for 30 min with PBS-T and then incubated with a 1:10,000 dilution of the appropriate peroxidase-conjugated secondary antibody. Blots were visualized using the Enhanced Chemiluminescence Plus kit (Amersham Biosciences). For quantitative analysis, each blot was stripped and reprobed with a 1:2000 dilution of an anti-actin monoclonal antibody (Chemicon, Temecula, CA). The relative intensities of bands were determined using the Scion (Frederick, MD) Image software package, and the expression levels of the individual WAVE proteins were normalized to actin.
β-galactosidase assay. Wild-type, WAVE1 (+/−) and WAVE1 (−/−) mice (P20) were killed by cervical dislocation. The brains were removed, and protein was extracted according to the above protocol. β-galactosidase activity was quantitated by measuring the relative optical density at 420 nm in the presence and absence of the substrateo-nitrophenyl β-d-galactopyranoside (Sigma).
In situ hybridization. Adult mice (C57BL/6) weighing 25–35 gm were killed by cervical dislocation. Fresh-frozen brain sections (15 μm) were mounted on polylysine-coated slides and processed forin situ histochemistry as described previously. A probe was generated from a PCR fragment corresponding to 1270–1440 of mouse WAVE1 cDNA. Amplification of mouse brain cDNA using primers (forward: 5′ TCCGTCTGCCTTGTCCACTTC; reverse: 5′ GGAGGAGCTGGGTGAAGAA) resulted in a 170 bp fragment, which was subsequently subcloned to generate antisense riboprobes using T7 phage polymerase. Riboprobes transcribed in the presence of 33P-UTP were labeled to high specificity and used at 1 × 10⁶cpm/slide.
β-galactosidase histochemistry. WAVE1 (+/−) and wild-type mice (P24) were killed by cervical dislocation. Brains were dissected from the mice and fixed in a 4% paraformaldehyde solution for 1 hr. Brains were cut into 1 mm sections using a brain block and washed in PBS (Invitrogen) containing 2 mmMgCl2 for 1 hr at 4°C. The sections were then washed in PBS containing 2 mmMgCl2, 0.01% sodium deoxycholate, and 0.02% Ipegal for 30 min at 4°C. Finally, sections were incubated in β-galactosidase staining buffer [5 mmK3Fe(CN)6, 5 mmK4Fe(CN)6, 2 mm MgCl2, 0.01% sodium deoxycholate, 0.02% Ipegal, 10 mm Tris-HCl, pH 7.2, and 1 mg/ml 5-bromo-4-chloro-3-indolyl β-d-galactoside] for 1–3 hr at 37°C. Sections were then stored in a 10% formalin solution (Sigma) at 4°C indefinitely.
For the developmental studies, male WAVE1 (+/−) mice were mated to wild-type females for 24 hr. At 9, 12, 15, and 18 d after mating, pregnant female mice were killed by cervical dislocation and the embryos were harvested. Embryos at embryonic day 9 (E9) were stained whole-mount, whereas E12 and E15 embryos were cut in half sagitally before staining according to the above procedure. E18 embryos were embedded in OCT mounting medium and frozen on dry ice. The embryos were then cut into 30 μm sections on a cryostat, mounted on polylysine-coated slides, and stained using the above procedure.
Growth rate analysis. Weight measurements of 10 wild-type, 17 WAVE1 (+/−), and 9 WAVE1 (−/−) mice were taken daily from P2 to P22. Six time points (P2, P5, P9, P12, P17, and P22) were selected to compute weight gains in the five corresponding time intervals. ANOVA was used to determine the variability in body weights within and between each genotype. To analyze these data as rates of growth, a linear mixed model was applied to log10-transformed body weights, which allowed us to interpret the weight changes as changes in the growth rates of these mice. The p values for testing weight changes over the five intervals, as well as pairwise comparisons of weight changes between genotypes, were adjusted by the Bonferroni method.
Pathology analysis. Wild-type and WAVE1 (−/−) mice (P20) were killed and their tissues harvested and fixed in buffered 10% formalin solution. Tissues were then trimmed, embedded in paraffin, and stained by hematoxylin–eosin. A board-certified veterinary pathologist evaluated all slides, and the observed lesions were graded for presence and severity.
Primary neuronal culture. WAVE1 (+/−) females impregnated by WAVE1 (+/−) males were killed by cervical dislocation when the embryos were approximately E16. Embryos were removed from the uterus and dissected under a microdissection scope. The cortical tissue was isolated, washed with HBSS and centrifuged at 1500 ×g for 1 min. The cells were incubated in trypsin solution (0.3 mg/ml trypsin and 250 U/ml DNase dissolved in HBSS) for 15 min at room temperature, after which trypsin inhibitor solution (trypsin inhibitor 0.5 mg/ml and DNase 250 U/ml dissolved in DMEM 10% FBS) was added. The cells were collected by centrifugation at 1500 ×g for 1 min, resuspended in DMEM 10% FBS and triturated until no cell clumps were visible. Cell density was determined by trypan blue staining and cells were plated out in DMEM 10% FBS at a density of 1 × 10⁵ cells/well of a six-well plate. Twenty-four hours after plating, the DMEM 10% FBS was replaced with DMEM containing B27 supplement (Invitrogen).
Cellomics analysis. The primary neurons were fixed in a 4% paraformaldehyde solution for 15 min 5 d after plating. Cells were stained using the neurite outgrowth hit kit according to the instructions of the manufacturer (Cellomics, Pittsburg, PA) and analyzed using a Cellomics Array Scan II at a magnification of 10×. For each field analyzed, the Cellomics neurite outgrowth software package was used to calculate the number of neurons, neurite outgrowth index, the average number of neurites per neuron, and the average neurite length per neuron. Approximately 70 fields were analyzed per genotype. For each parameter measured, the data from all fields were used to generate an average and standard error. Wild-type and WAVE1 knock-out values were compared using Student's t test (p< 0.05).
Golgi impregnation. Mice (P21–P24) from WAVE1 knock-out or wild-type were killed by cervical dislocation and their brains washed in 0.9% saline. A rapid Golgi stain was performed according to the specifications of the manufacturer (FD NeuroTechnologies, Germantown, MD). Briefly, whole brains were treated for silver impregnation for 2 weeks, cryoprotected for 48 hr, and sectioned at 120 μm on a cryostat. After sectioning and mounting on gelatin-coated slides, sections were developed, clarified, then coverslipped in resinous medium.
Results
Expression analysis of WAVE1 mRNA
We initially determined the expression of WAVE1 in adult human and mouse tissues to identify organs that may be affected in WAVE1 knock-out mice. Using Northern analysis, we demonstrated that in humans WAVE1 expression is limited to the CNS and that the WAVE1 mRNA is expressed in all of the brain regions examined (Fig.1A,B). We subsequently analyzed WAVE1 mRNA expression in the mouse brain using quantitative RT-PCR and determined that the WAVE1 transcript is similarly expressed in the mouse CNS. Our analysis of WAVE1 mRNA expression in mouse brain revealed that the highest levels are found in the hippocampus, cerebral cortex, and striatum (Fig. 1C). These findings suggested that WAVE1 plays an important role throughout the CNS and reaffirmed our interest in determining the role of WAVE1 in neuronal physiology.

Tissue and brain region expression of WAVE1. Expression analysis was performed using human multitissue (A) and brain region (B) Northern blots probed with a radiolabeled WAVE1 cDNA probe (see Materials and Methods). A single transcript ∼3000 nt in length corresponding to WAVE1 was restricted to the CNS but was widely distributed within the human brain. C, WAVE1 mRNA expression in the mouse brain was analyzed using Taqman quantitative RT-PCR. Data are expressed as the fold change relative to the WAVE1 mRNA levels in the hypothalamus.
Gene-trap insertion
To generate a line of mice with a targeted disruption of the WAVE1 gene we searched the Omnibank ES cell library (Lexicon Genetics) and were able to identify one embryonic stem (ES) cell clone (OST66260) that had a retroviral gene-trap insertion ∼20 nt upstream of the translation initiation site on the WAVE1 mRNA (Zambrowicz et al., 1998). The ES cell clone OST66260 was then used to generate a line of WAVE1 knock-out mice. The gene-trap allele was inherited in the predicted Mendelian manner, indicating that the WAVE1 disruption does not result in embryonic lethality.
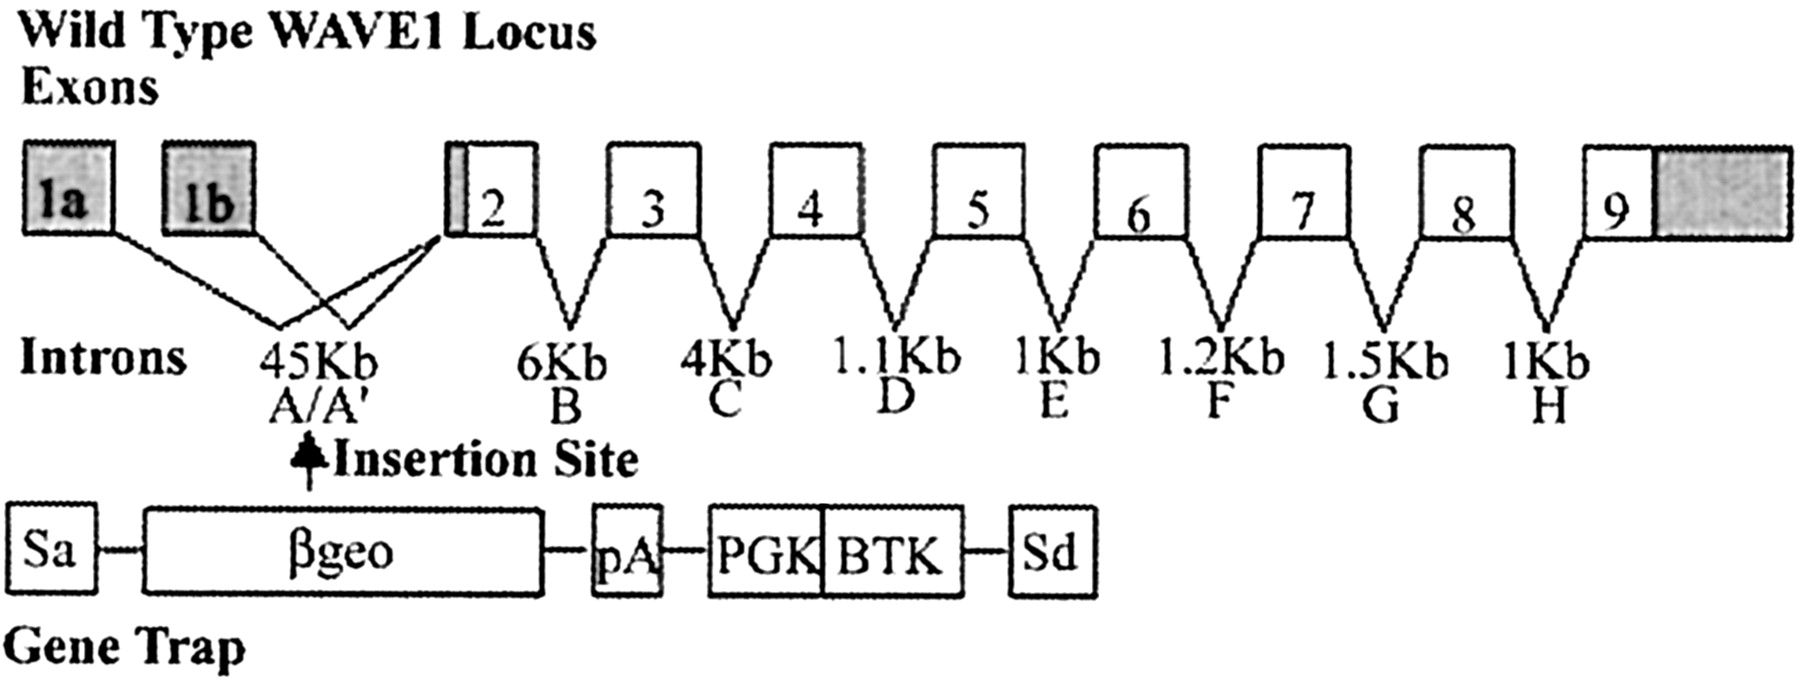
Additional characterization of the mouse WAVE1 gene was necessary to ensure that the gene-trap insertion had actually disrupted this gene. Using 5′ RACE PCR to clone the 5′ end of the mouse WAVE1 cDNA, we identified two distinct WAVE1 transcripts resulting from the alternate use of two independent 5′ exons. The gene-trap insertion was located in the intron upstream of exon 2 in the mouse WAVE1 gene (Fig.2). Because both transcripts use intron A, the gene-trap insertion led to complete inactivation of this allele (Fig. 2).

Disruption of the mouse WAVE1 gene. Structure of the mouse WAVE1 gene with boxes representing exons and the shaded areas representing the 5′ and 3′ UTR. Introns are lettered A through H and their approximate lengths are given. The structure of the retroviral gene trap used to disrupt the murine WAVE1 gene is shown with the splice acceptor (SA), the β-galactosidase neomycin resistance gene fusion (β-geo), polyadenylation consensus site (pA), the PGK promoter (PGK), the BTK OST sequence (BTK), and the splice donor site (SD). The site of insertion of the gene trap into the WAVE1 locus is marked with an arrow.
Analysis of WAVE family protein levels
Western analysis using a WAVE1-specific polyclonal antibody was performed on samples isolated from the cerebral cortex and hippocampus of P20 wild-type, WAVE1 (+/−), and WAVE1 (−/−) mice to confirm if the WAVE1 gene was functionally disrupted (Fig.3A). Quantitative analysis of these experiments indicated that mice heterozygous for the gene-trap insertion expressed ∼50% less WAVE1 protein than wild-type controls, whereas mice homozygous for the insertion did not have any detectable levels of WAVE1 protein in either brain region. Using this same approach, we were able to measure the expression levels of the two remaining WAVE family members in the brains of mice from all three genotypes. In quantifying the protein levels of both WAVE2 and WAVE3 in the cortex and hippocampus of wild-type, WAVE1 (+/−) and WAVE1 (−/−) mice, we determined that the expression levels of both of these proteins were similar in all three genotypes (Fig. 3B,C). These results indicated that WAVE2 and WAVE3 levels are unchanged irrespective of WAVE1 expression.

Analysis of WAVE1, WAVE2, and WAVE3 protein levels. Western analysis was performed on 50 μg of protein extracted from the cerebral cortex and hippocampus of wild-type (Wt) mice as well as from mice heterozygous (Het) and homozygous (KO) for the gene-trap insertion (n = 3). The analysis was performed using an anti-WAVE1 polyclonal primary antibody (A), an anti-WAVE2 polyclonal primary antibody (B), and an anti-WAVE3 polyclonal primary antibody (C). All blots were normalized by reprobing with an anti-actin primary antibody. Error bars indicate SEM.
Use of β-galactosidase as a surrogate marker for WAVE1 expression
In addition to disrupting WAVE1 expression, the retroviral gene trap inserted a reporter gene, bacterial β-galactosidase, under the control of the mouse WAVE1 promoter (Fig. 2). The knock-in potentially allows for the measurement of WAVE1 promoter activity using β-galactosidase as a surrogate marker. To ascertain the functionality of this marker, a colorimetric β-galactosidase assay was initially performed on protein samples taken from the brains of mice representing all three genotypes (Fig.4A). Mice heterozygous for the gene-trap insertion exhibited increased β-galactosidase activity over background levels, whereas mice homozygous for the insertion had a sevenfold increase in β-galactosidase activity compared with heterozygous littermates. Thus, it appears that the retroviral gene trap disrupted the WAVE1 gene and simultaneously inserted the reporter gene under the control of the WAVE1 promoter. The reciprocal relationship between WAVE1 expression and β-galactosidase activity suggested that, in the WAVE1 knock-out mice, β-galactosidase could function as a surrogate marker for WAVE1 expression.

β-galactosidase as a surrogate marker for WAVE1.A, β-galactosidase activity in all three genotypes was quantified using o-nitrophenyl β-d-galactopyranoside (ONPG) as a colorimetric substrate. An inverse relationship between WAVE1 protein levels and β-galactosidase activity was observed. B, The CNS expression pattern of WAVE1 in adult mice was determined usingin situ hybridization with a radiolabeled riboprobe directed against the 3′ UTR of the WAVE1 mRNA. WAVE1 mRNA is particularly enriched in the cerebral cortex (Ctx), striatum (Str), and hippocampus (Hipp). C, The CNS expression pattern of β-galactosidase was generated by incubating brain sections from adult mice heterozygous for the gene-trap insertion in a β-galactosidase staining buffer. An overlapping expression pattern was observed between β-galactosidase and WAVE1 mRNA.
To further validate the use of β-galactosidase as a surrogate marker for WAVE1 in anatomical or developmental studies, we compared WAVE1 and β-galactosidase expression patterns in the brains of adult mice. Neuroanatomical colocalization of WAVE1 and β-galactosidase in the adult animals was confirmed by comparing in situhybridization performed on brains prepared from wild-type mice using a WAVE1 antisense riboprobe and brain sections from WAVE1 (+/−) mice stained for β-galactosidase (Fig.5A,B). The in situhybridization data indicated that WAVE1 mRNA is enriched in the cerebral cortex, striatum, and hippocampus of adult mice (Fig.5A). The β-galactosidase staining produced similar results, indicating that β-galactosidase expression in WAVE1 (+/−) mice correlated with the neuroanatomical distribution of WAVE1 (Fig.5B).

Developmental expression of WAVE1. Embryos heterozygous for the gene-trap insertion were harvested at E9, E12, E15, and E18 and stained using a β-galactosidase staining buffer. Although WAVE1 is expressed throughout the E9 embryo, localization is more restricted in the older embryos. At E12 and E15, the expression of WAVE1 is highest in the brain and spinal cord. In the cortex of both E12 and E15 embryos WAVE1 expression is enriched in the outer cortical layers, including the cortical plate (CP), whereas it almost completely absent from the ventricular zone (VZ). In addition, at both of these ages WAVE1 expression is seen in peripheral organs, including the lung, intestine, heart, and limbs. By E18, WAVE1 expression is restricted to the CNS.
Developmental expression of WAVE1
To gain insight into the role of WAVE1 during development we performed a histological analysis of E9, E12, E15, and E18 embryos (Fig. 5). In E9 embryos, WAVE1 was expressed throughout the entire embryo as measured by β-galactosidase activity (Fig. 5). From E12 to E15, the expression of WAVE1 became more restricted, with the highest levels in the brain and spinal cord. Within the cerebral cortex, the highest levels of WAVE1 expression were found in the cortical plate, with very low levels of WAVE1 expression detected in the proliferative ventricular zones, indicating that WAVE1 is expressed primarily in differentiated neurons (Fig. 5). In addition, at both E12 and E15, peripheral tissues, including the intestines, lung, heart, and limbs, were shown to express WAVE1 (Fig. 5). However, the expression of WAVE1 was almost completely restricted to the brain and spinal cord by E18, reflecting the pattern of distribution found in adults, as described earlier (Fig. 5). Thus, the expression of WAVE1 becomes increasingly restricted to the CNS as embryos mature.
Phenotypic characterization of WAVE1 knock-out mice
To examine the biological role of WAVE1 during development as well as in postnatal animals we characterized the phenotype of mice homozygous for the gene-trap insertion. At E17 both the wild-type and WAVE1 (−/−) embryos were approximately the same size, and there were no apparent anatomical abnormalities observed in WAVE1 (−/−) animals (Fig. 6A). WAVE1 knock-out pups were distinguishable from wild-type and heterozygous littermates on the basis of their smaller size shortly after birth. By P18 the WAVE1 knock-out mice displayed a severely runted phenotype (Fig. 6B). In addition, WAVE1 knock-out mice also exhibited a resting tremor and hindlimb weakness.
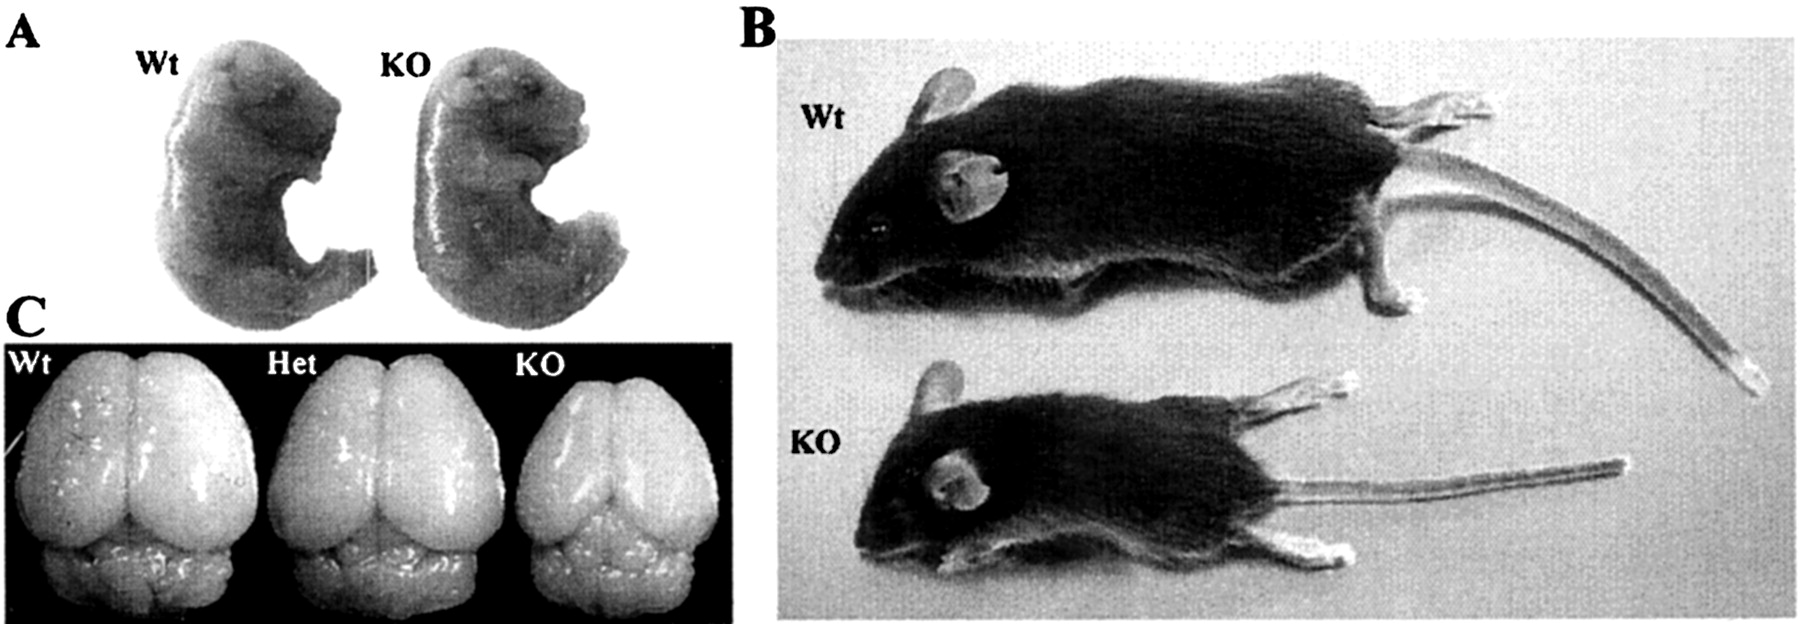
Morphological analysis of WAVE1 knock-out mice.A, At E17 WAVE1 knock-out embryos appear normal and do not display gross morphological abnormalities compared with wild-type littermates. B, WAVE1 knock-out mice at P20 display a severely runted phenotype compared with wild-type littermates.C, Comparison of brains taken from wild-type mice as well as from mice both heterozygous (Het) and homozygous (KO) for the gene-trap insertion reveals a dramatic reduction in the size of the cerebral cortex in the mice lacking a functional WAVE1 gene. Brains from heterozygous mice were indistinguishable from those of wild-type mice.
The phenotypic defects of WAVE1-deficient mice may stem in part from CNS dysfunction in that whole-mount analysis of brains from wild-type, WAVE1 (+/−), and WAVE1 (−/−) mice at P18 revealed a reduction in overall brain size as well as a marked decrease in the length of the cerebral cortex in the WAVE1 (−/−) mice (Fig. 6C). In wild-type and WAVE1 (+/−) mice the cerebral cortex extended caudally and covered most of the tectum, whereas in the WAVE1 (−/−) mice the cortex was generally reduced, leaving a large portion of the midbrain visible on inspection. The neuroanatomical abnormalities seen in the WAVE1 (−/−) mice most likely are not attributable to a generalized failure in brain development, because other brain regions, including the cerebellum, appear to have developed properly (Fig. 6C). It is interesting to note that although the cerebral cortex forms relatively early in CNS development, the cerebellum is one of the last structures to form, suggesting that the role of WAVE1 may be most critical during the earlier stages of CNS development. Alternatively, WAVE1 may have an impact on the development of specific brain regions, where its expression is particularly enriched, including the cerebral cortex, without affecting the development of other regions, such as the cerebellum, despite lower levels of WAVE1 expression in these tissues.
The morphological defects of the WAVE1 knock-out mice were associated with postnatal lethality. We monitored the lifespan of a cohort of wild-type, WAVE1 (+/−) and WAVE1 (−/−) mice and observed that all mice homozygous for the gene-trap insertion died between P21 and P26, with an average lifespan of 23.6 d (Fig.7A). Lethality among wild-type or WAVE1 (+/−) mice was not observed during the postnatal period.

Lifespan and growth rate of WAVE1 knock-out mice.A, Individual lifespans of WAVE1 knock-out mice. The WAVE1 knock-out mice survived 21–26 d after birth, with an average lifespan of 23.6 d (n = 13). B,Average weights for wild-type (n = 10), WAVE1 (+/−) (n = 17), and WAVE1 (−/−) (n = 9) mice at P2, P5, P9, P12, P17, and P22. The average weight of the WAVE1 (−/−) mice is significantly reduced compared with the other two genotypes. *p < 0.001, ANOVA. Within-group comparison reveals a decrease in the weight of WAVE1 (−/−) mice from P17 to P22. †p < 0.001. Error bars indicate SEM.
To examine the events leading to lethality in WAVE1 knock-out mice further we examined the postnatal weight gain of all three genotypes. Daily body weight measurements were recorded and subsequently subdivided into five segments (P2–P5, P5– P9, P9–P12, P12–P17, and P17–P22) for analysis. The average body weights at the six representative days are shown in Figure 7B. In examining weight data from the earliest time point, we identified significant differences in the starting weight between wild-type and WAVE1 (−/−) mice as well as between WAVE1 (+/−) and WAVE1 (−/−) mice. Because the initial weight of WAVE1 knock-out mice was already lower, we compared the growth rates of these mice by applying a linear mixed model to log10-transformed body weights. This analysis demonstrated that for all five time intervals examined, wild-type and heterozygous mice showed significant (p < 0.0001) weight gains. In contrast, WAVE1 knock-out mice gained weight in the first four time intervals but lost weight during the final interval (Fig. 7B). In addition, our growth-rate analysis indicated that there were no significant (p = 0.272) differences in the weight change between wild-type and heterozygous mice, signifying that mice with these two genotypes grew at similar rates. WAVE1 knock-out mice grew at a significantly (p < 0.0001) reduced rate compared with both wild-type and heterozygous animals. This study demonstrated that the runted phenotype displayed by the WAVE1 knock-out mice is attributable to a significantly reduced growth rate throughout the entire life of these animals. It is interesting to note that during the final interval (P17–P22), the pups became increasingly dependent on solid food. During this same period, the WAVE1 knock-out mice displayed a negative rate of weight gain, suggesting that these animals suffered from a reduction in nutrient intake. Not surprisingly, the health status of WAVE1 knock-out mice deteriorated during this final interval, with all of the knock-out mice dying within 4 d of the last weight measurement (Fig.7A).
The peripheral organs of WAVE1 knock-out mice were examined histologically in an attempt to identify pathology that may have contributed to the untimely death of these mice. Overall, the tissues and organs of the wild-type and WAVE1 knock-out mice were very similar in macroscopic and microscopic appearances. The primary difference between the two genotypes was in the size of the individual tissues, which was not surprising, given the runted phenotype displayed by the WAVE1 knock-out mice. The kidneys and lungs from WAVE1 knock-out mice were determined to be normal (Fig. 8). The WAVE1 knock-out mice displayed lengthened intestinal villi compared with wild-type controls (Fig. 8), which is indicative of reduced food intake by the WAVE1 knock-out mice because roughage normally wears the intestinal villi as it moves through the gastrointestinal tract. The skeletal muscle of the WAVE1 knock-out mice had an apparent increase in the number of nuclei as well as a decrease in the size of individual myocytes, whereas the hepatocytes of these animals displayed a normal morphology but were decreased in size (Fig. 8). The hepatocellular and myofiber atrophy observed in the WAVE1 knock-out mice, without any additional lesions detected in those tissues, is consistent with the idea that the knock-out mice suffered from a lack of nutrient intake. Given that WAVE1 expression appears to be restricted to the nervous system in postnatal mice, it is important to note that the myofiber atrophy observed in the WAVE1 knock-out mice is not typical of nerve-related changes in the muscle structure. In addition, although tremor and limb weakness were observed in WAVE1 knock-out mice, these phenotypes did not appear to be associated with motor neuron degeneration (data not shown). The histopathology of myofibers is consistent with the spinal cord analysis in that the patchy, atrophic bundles often seen in rodent models of neurodegeneration were not observed in WAVE1 knock-out mice. Interpretation of the histopathological analysis along with observations from the growth rate analysis outlined in Figure 7 suggested that the absence of WAVE1 during development has caused a defect in these mice that prevents them from being able to survive on a solid-food diet. However, WAVE1 knock-out mice appeared to be capable of the physical process of biting and eating solid food because these mice were observed to nibble on food pellets in their cages. Whether CNS defects, such as perturbations in the hypothalamic regulation of satiety, underlie the inability of WAVE1 knock-out mice to survive on a solid-food diet remains to be seen.

Histopathology of WAVE1 knock-out mice. Hematoxylin-and-eosin-stained sections were generated from the kidney, lung, skeletal muscle, liver, and small intestine of P20 wild-type and WAVE1 knock-out mice. These slides were evaluated for the presence and/or severity of macroscopic and microscopic lesions. The muscle fibers, liver, and intestinal villi of WAVE1 knock-out mice appeared different from those of wild-type controls.
Because our WAVE1 expression analysis indicated that WAVE1 is restricted to the CNS in postnatal animals, histological studies were performed on brains taken from P20 wild-type and WAVE1 knock-out mice. This analysis revealed significant neuroanatomical abnormalities in the mice lacking WAVE1, including a thinning of the cerebral cortex and reduction of striatum, lateral septum, and corpus callosum (Fig.9). The neuroanatomical defects observed in the WAVE1 (−/−) mice correlate with areas that express high levels of WAVE1 as seen by in situ hybridization and β-galactosidase histochemistry, with the exception of the hippocampus (Figs. 4B,C, 9). Our analysis indicated that although the cerebral cortex is significantly reduced in size, the cortical layers all appear to be present. Although the observed reduction in the corpus callosum did not appear to be attributable to the premature termination of decussating axons, it could potentially result from fewer neurons sending projections into this structure. The WAVE1 (−/−) mice also have substantially enlarged lateral ventricles, which may result from a decrease in the volume of the structures surrounding the ventricles. For instance, projecting fibers passing through the medial striatum appeared to be reduced. Terminal deoxynucleotidyl transferase-mediated biotinylated UTP nick end labeling analysis performed on P20 wild-type and WAVE1 knock-out mice did not show increased number of cells undergoing apoptosis in the brains of WAVE1 knock-out animals (data not shown), suggesting that neuronal cell death does not immediately precede morbidity. Taken together, these data suggest that the neuroanatomical abnormalities observed in the WAVE1 knock-out mice are attributable to a developmental decrease in the number of cells and/or projections that constitute the cerebral cortex, striatum, and lateral septum. Interestingly, this analysis did not reveal any neuroanatomical abnormalities in the hypothalamus of the WAVE1 knock-out animals.

CNS histology of WAVE1 knock-out mice. Brain sections from wild-type and WAVE1 knock-out mice were stained using cresyl violet (middle). Those sections are compared with sections from wild-type mice that have been labeled with a WAVE1-specific probe byin situ hybridization (ISH) (left). WAVE1 knock-out mice have enlarged lateral ventricles accompanied by reductions in the lateral septum, striatum, and corpus callosum (top insets). An abnormal reduction of the cingulate gyrus in the retrosplenial cortex underlying the superior colliculus was evident (bottom insets). All of these areas appear to express WAVE1 at high levels, as determined by ISH. LS, Lateral septum; CC, corpus callosum; Str, striatum; Ctx, cerebral cortex; Cg, cingulate gyrus.
In vitro analysis of WAVE1 (−/−) neuronal morphology
Based on our initial hypothesis that WAVE1 may play an important role in neuronal morphogenesis, as well as the idea that the neuroanatomical deficits displayed in the WAVE1 (−/−) mice were attributable to the inability of neurons to form the proper morphology, we examined the growth and morphology of primary neuronal cultures from the cerebral cortex of E16 wild-type and WAVE1 (−/−) mice. In these primary culture experiments, cortical neurons were cultured for 5 d, after which they were analyzed for various indices of neurite outgrowth. Using an automated approach, we were able to analyze the morphology of 1969 wild-type neurons and 1229 WAVE1-deficient neurons quantitatively. In wild-type neurons, the neurite outgrowth index, defined as percentage of neurons positive for neurite outgrowth, was 63.13%, whereas neurons lacking the WAVE1 protein had a neurite outgrowth index of 68.6% (Fig. 10). Wild-type neurons positive for neurite outgrowth had an average of 2.85 primary neurites per neuron, whereas knock-out neurons had an average of 2.92 primary neurites per cell (Fig. 10). We were unable to detect any significant differences in neurite outgrowth index, the number of neurites per cell, or the average neurite length per neuron between the wild-type and WAVE1 knock-out cultures (Fig. 10). These results were unexpected given the proposed role for WAVE1 in regulating cytoskeletal dynamics and indicated that WAVE1 is not essential for neurite outgrowth in vitro.

Morphological analysis of WAVE1 cortical neurons. Primary neuronal cultures were generated from E15 wild-type and WAVE1 knock-out embryos. After 5 d in culture, the cells were fixed and stained. The morphology of the neurons was analyzed at a magnification of 10× using the Cellomics Array Scan II and the accompanying neurite outgrowth software package. Average values are shown +/− the SD. Values generated for wild-type and knock-out neurons were compared using Student's t test (p < 0.05). For all of the parameters analyzed, no significant differences between the two populations of neurons were detected.
In vivo analysis of WAVE1 (−/−) neuronal morphology
We addressed whether WAVE1 is required for the formation of axons and dendrites in vivo by assessing the morphology of neurons in the cortex and hippocampus of wild-type and WAVE1 knock-out mice using Golgi impregnation. This analysis indicated that cortical neurons from layers III and IV of WAVE1 knock-out animals exhibit properly polarized apical dendrites and form multiple, highly ordered dendritic branches (Fig.11A,B). Layers within the hippocampus of WAVE1 knock-out mice were indistinguishable from those of wild-type animals, with pyramidal cells projecting axons toward the fimbria (Fig. 11A,B). These results demonstrated that mice lacking WAVE1 neurons could still generate the proper morphology, confirming that WAVE1 is not essential to the process of neuronal morphogenesis.

In vivo analysis of neuronal morphology in WAVE1 knock-out mice. Brain sections from wild-type and WAVE1 knock-out mice were processed for Golgi impregnation to assess neuronal morphology in the cortex (Ctx) and the CA1 field of the hippocampus (Hipp). Arrows indicate apical dendrites in the cortex. III, Cortical layer III; IV, cortical layer IV; V, cortical layer V; SO, strata oriens; PC, pyramidal-cell layer; SR, strata radiatum.
Discussion
WAVE1 is a candidate protein for regulating the process of neuronal morphogenesis because of its direct connections to rho–GTPase signaling, which has been implicated in many of the processes leading to the development of mature neurons, and the Arp2/3 complex, a key component in actin polymerization (Luo, 2000; Mullins, 2000; Higgs, 2001). To provide insight into the physiological role of WAVE1 in the CNS, we established a line of WAVE1 knock-out mice. The data generated using the WAVE1 (−/−) mice indicate that although WAVE1 expression is widespread in the CNS, it appears to be critical for the proper development of specific neuroanatomical structures and is not essential for neurite outgrowth.
In characterizing the phenotype of the WAVE1 knock-out mice we determined that the absence of WAVE1 during development leads to postnatal lethality, with mice homozygous for the gene-trap insertion surviving for an average of 23.6 d after birth. This information, combined with the wide pattern of WAVE1 expression during the early stages of mouse development and the overt postnatal phenotype displayed by mice homozygous for the gene-trap insertion, indicates that WAVE1 plays a crucial role in development. That WAVE1 might play such a role in development is not surprising given that mice lacking functional N-WASP are embryonic lethal and do not survive past E12 (Snapper et al., 2001). N-WASP knock-out embryos have defects in the development of multiple organ systems, indicating that N-WASP has a more extensive role during development than does WAVE1.
In comparison, anatomical defects seen in the WAVE1 knock-out mice are restricted primarily to the CNS. The fact that the neuroanatomical malformations seen in the WAVE1 (−/−) mice occur in brain structures that develop between E12 to E15 implies that the biological role of WAVE1 is critical to the process of CNS development during this period. Furthermore, the hippocampus and cerebellum, two brain regions that express high levels of WAVE1 but mature later in development, appear to develop normally in the WAVE1 (−/−) mice. These observations suggest that WAVE1 has an important role during specific stages of CNS development that coincide with a shift in expression toward a CNS-restricted pattern. The absence of WAVE1 expression from the subventricular zones of the developing CNS also implies that WAVE1 does not regulate the proliferation of neuronal progenitor cells. In fact, WAVE1 appears to be most highly expressed in the outer layers of the developing cortex, indicating that the WAVE1 functions in the later stages of neuronal differentiation.
Because our analysis of pathology failed to detect anatomical malformations in the WAVE1 (−/−) mice outside of the CNS other than those associated with nutrient intake, it is possible that additional WASP/WAVE family members may be compensating for the lack of WAVE1 in the periphery. Although the two other WAVE proteins, WAVE2 and WAVE3, are not highly expressed in the CNS, they are present in peripheral tissues, and may therefore offer one potential explanation for the lack of peripheral anatomical malformations in the WAVE1 (−/−) mice (Suetsugu et al., 1999). Within the CNS, expression levels of WAVE2 and WAVE3 proteins remain unchanged in the cerebral cortex and hippocampus, suggesting these two WAVE family members do not compensate for the complete loss of WAVE1 by increasing expression in the CNS of WAVE1 knock-out animals. Interestingly, WAVE1 (+/−) mice are normal despite a 50% reduction in WAVE1 protein levels. Whether the low levels of WAVE2 and WAVE3 are sufficient to augment WAVE1 activity functionally in these mice remains to be seen. Nevertheless, the overt phenotype of WAVE1 knock-out mice indicates that the other WASP/WAVE family members are not able to compensate fully for the absence of WAVE1 in the CNS of the knock-out animals and points to WAVE1 function that is, at least in part, distinct from the other WASP/WAVE family of proteins.
Our analysis of neurite outgrowth did not reveal any significant differences between cortical neurons isolated from wild-type and WAVE1 knock-out embryos across a number of morphometric parameters. However, these experiments were conducted using standard primary culture conditions and did not examine the morphology of neurons challenged with different growth conditions. Exposing the cultures to factors that effect neurite outgrowth or altering the substratum on which the neurons are grown, may potentially result in morphological differences between the two populations of neurons. Semaphorins would be one class of factors that could potentially elicit a differential response in neurite outgrowth from wild-type and WAVE1-deficient neurons, in part because the role of these proteins in regulating growth cone dynamics has been linked to the activity of rac1 (Jin and Strittmatter, 1997). Culturing neurons from wild-type and WAVE1 knock-out embryos in the presence of growth inhibitory ligands such as NogoA and myelin associated glycoprotein (MAG) may also be of interest. The neuronal receptor for both NogoA and MAG, Nogo receptor (NgR), has also been linked to the regulation of neuronal growth cones via rho-GTPase signaling (Woolf and Bloechlinger, 2002). Because signals mediated via NgR or semaphorins have not been linked to the activity of WAVE1, neurons from the WAVE1 knock-out mice may be applied to investigate the role of WAVE1 in regulating cytoskeletal dynamics in response to these proteins.
Although WASP/WAVE family members are known to play important roles in regulating cytoskeletal actin dynamics, they are not the only known intermediates that link signal transduction cascades to changes in the actin cytoskeleton. Members of the Ena/VASP (vasodilator-stimulated phosphoprotein) family of proteins have been localized to actin-rich structures, including focal adhesions and lamellipodia (Reinhard et al., 1992; Gertler et al., 1996). The Ena/VASP family of proteins is known to associate with various signaling molecules, including Abl and Src tyrosine kinases and the cAMP-dependent protein kinase (Butt et al., 1994; Gertler et al., 1996). The (+) isoform of Mena, the mammalian homolog of the Drosophila Ena protein, has been shown to stimulate the generation of actin-rich structures when expressed in fibroblasts. Interestingly, Mena(+) is expressed at high levels in the developing CNS (Gertler et al., 1996). Mena knock-out mice have pronounced defects in the corpus callosum and hippocampal commissure. The defects arise from the inability of neurons within these structures to send projections across the midline, resulting in prematurely terminated axons accumulating at thecis face of the fissure (Lanier et al., 1999). In contrast, our WAVE1 knock-out mice exhibit a surprisingly normal hippocampus. The corpus callosum was indeed reduced, although it appeared to result from a reduction in the overall number of fibers comprising the corpus callosum, with no evidence of accumulated predecussating axons. The differences between the neuroanatomical malformations detected in the Mena and WAVE1 knock-out mice suggests that these two proteins have specific but nonoverlapping roles in the developing CNS.
Recent studies have also demonstrated that interfering with the function of Ena/VASP proteins results in defects in neuronal migration. More specifically, embryonic neurons infected with a retroviral construct that causes all members of the Ena/VASP family to be sequestered in the mitochondria appears to increase the rate at which these neurons migrate from the ventricular zone into the developing cortex. Inhibiting Ena/VASP protein function caused pyramidal cells infected with the viral construct to migrate to more superficial layers of the cortex, suggesting that this family of proteins functions to regulate the positioning of neurons in the developing brain (Goh et al., 2002). In the WAVE1 knock-out mice, the layers of the cerebral cortex all appear to form normally, despite an overall reduction in tissue volume, indicating that the defects seen in these animals are not attributable to alterations in the rates of neuronal migration in the developing cerebral cortex. The difference in phenotypes seen in the Mena knock-out mice, the WAVE1 knock-out mice, and the mice infected with the dominant-negative Ena/VASP retrovirus are consistent with the suspected differences in the localization of these proteins within actin-rich structures and further distinguishes the function of the Ena/VASP homology domain versus the SCAR homology domain (Nakagawa et al., 2001).
Footnotes
- Received December 3, 2002.
- Revision received January 31, 2003.
- Accepted February 3, 2003.
We thank Dr. David Howland for critical evaluation of this manuscript, Yijin She for technical assistance, Jianying Su for generating the primary neuronal cultures, Brenda Lager for contributions to animal husbandry, and Dr. Youping Huang for assistance with statistical analysis.
Correspondence should be addressed to Dr. Seung P. Kwak, Department of Molecular Genetics, Wyeth Research, CN8000 Princeton, NJ 08543. E-mail:kwaks{at}wyeth.com.
- Copyright © 2003 Society for Neuroscience