
Abstract
Oxytocin- and vasopressin-producing magnocellular neurons (MCNs) of the hypothalamo-neurohypophysial system are the only neuronal phenotypes present in the rat supraoptic nucleus (SON). Laser microdissection of the SON, extraction and T7-based amplification of its RNAs, and analysis of the resulting cDNAs by hybridization on a 35, 319 element DNA microarray have provided a detailed composite view of the gene expression profile of the MCNs. The genes expressed in the SON were compared with those expressed in a reference tissue consisting of total hypothalamus, and this “expression ratio” indicated which genes were preferentially expressed in the SON. Of the 26,000 unique genes on the array, 1385 were found to be expressed in the SON at levels more than two times greater than in the hypothalamus as a whole. Of these, 123 were expressed ≥3.4-fold higher in the SON versus hypothalamus. Most of these preferentially expressed genes were not previously known to be expressed in the MCNs. Quantitative and double-label in situ hybridization histochemistry was used selectively to confirm a number of these microarray observations and to evaluate the osmotic regulation and cell-specific expression of these genes, respectively.
- oxytocin
- vasopressin
- hypothalamus
- gene expression
- microarray
- laser microdissection
Introduction
The hypothalamo-neurohypophysial system is the major neuroendocrine system through which the brain maintains body fluid homeostasis (Robertson, 1995; Antunes-Rodrigues et al., 2004). The axons of the vasopressin (VP)- and oxytocin (OT)-synthesizing magnocellular neurons (MCNs) located in the supraoptic and paraventricular hypothalamic nuclei of the hypothalamus terminate on the capillaries of the posterior pituitary, into which the peptides are secreted (Brownstein et al., 1980; Sladek, 1999). The high rates of neuropeptide synthesis, transport, and release by the VP- and OT-MCNs, and their discrete localization in the hypothalamus, have made these cells important experimental models for the study of peptidergic neuronal cell biology in the CNS (Young, 1992; Gainer and Wray, 1994; Burbach et al., 1995, 2001; Waller et al., 1998; Sladek, 1999).
The aim of this study was to determine which genes are selectively expressed in the supraoptic nucleus (SON) to identify genes that might regulate the expression of the neuropeptides and other characteristic features of the MCNs. Previous studies of hand-microdissected supraoptic nuclei (Glasgow et al., 2000) or single MCNs isolated from the SON (Glasgow et al., 1999; Yamashita et al., 2002) relied on PCR amplification of the extracted RNA and differential cloning procedures. Some osmotically regulated and MCN-specific genes were identified, but few transcription factors were discovered. This was attributable, in part, to the limitations of the nonlinear PCR amplification used in those studies and the generally low levels of expression of such factors. Therefore, in this study, we used laser microdissection of the SON and linear amplification of the extracted RNA, in combination with DNA microarray analysis of gene expression. Laser microdissection allows for the selective collection of cells of interest from tissue sections, and microarray techniques permit the analysis of several thousand genes in a single sample. The combination of the two techniques has been used to profile gene expression in adjacent neuronal subtypes within the CNS (Luo et al., 1999). We used a linear T7-based RNA amplification of total SON RNA isolated by laser microdissection, and the probes generated from this RNA were subsequently analyzed by hybridization on a 35,319 element cDNA microarray.
We used an approach in which genes in the tissue sample of interest (i.e., the SON) are compared with those in a reference tissue sample (Perou et al., 2000; Garber et al., 2001; Yang et al., 2002) on single arrays. Total hypothalamus tissue served as the reference tissue. The ratios of the SON to the hypothalamic signals are a measure of the preferential expression of specific genes in the MCNs in the SON relative to the hypothalamus, and we refer to this as the “expression ratio.” We selectively validated genes with high expression ratios by in situ hybridization histochemistry. Overall, this strategy resulted in the identification of 123 preferentially expressed MCN genes, most of them not previously known to be expressed in the MCNs. Among these, 19 of the preferentially expressed genes found in the SON are potentially involved in transcription or translation.
Materials and Methods
Animals
Adult male Sprague Dawley rats weighing 260-320 gm were housed individually in wire-mesh cages in a temperature-controlled room (21-23°C) with lights on from 7:00 A.M. to 7:00 P.M. All procedures were performed in accordance with National Institutes of Health (NIH) guidelines on the care and use of animals and an animal study protocol approved by the Georgetown University Animal Use and Care Committee. Hypernatremic rats were given 2% NaCl in their drinking water for 7 d. The plasma Na+ levels (mm) and plasma osmolarities (mOsm/kg H2O) were measured in blood samples drawn via jugular puncture in each animal after 7 d of treatment. The plasma Na+ levels were 139.8 ± 0.9 mm and 152.6 ± 6.7 mm and the plasma osmolarities were 288.8 ± 2.2 mOsm/kg H2O and 307.0 ± 9.7 mOsm/kg H2O in the normosmolar and hyperosmolar rats, respectively.
Tissues
Laser microdissection of the SON (see Fig. 1). After decapitation, the brains were removed quickly and frozen immediately on dry ice and stored at -80°C until further processing occurred. The tissue was placed in the cryostat for 10 min at the cutting temperature (-18°C) for temperature equilibration. Seven-micrometer-thick sections of the SON region were cut, placed on membrane-coated glass slides (glass foil polyethylennaphtalate slides; Leica Microsystems Inc., Bannockburn, IL), and stored immediately in a slide box embedded in dry ice until the sectioning was completed. The sections were stored at -80°C until they were used. Before laser microdissection, the tissue was fixed and dehydrated with ethanol as described previously (Luo et al., 1999). Briefly, the slides were thawed for 45 sec in 75% ethanol and further dehydrated by sequential immersion in 95%, 100% and again with 100% ethanol for 5 sec each. Then, the slides were cleared twice with xylene for 2 min and dried in a vacuum chamber. All of the solutions for fixation were prepared with DEPC water. Laser microdissection was performed under dark-field illumination using a laser-microdissection microscope (Leica Microsystems Inc.) (Kolble, 2000) immediately after dehydration of the slides. Brains from three animals were microdissected. The dissected supraoptic nuclei (Fig. 1 B) were collected into 0.5 ml tubes with 70 μl of lysis buffer containing guanidine thiocyanate and 0.5 μl of β-mercaptoethanol.

Illustration of a Nissl-stained coronal section of the rat hypothalamus and high-power views of an intact and laser-microdissected SON stained by Nissl. A, Arrows indicate the intense Nissl staining of MCNs in the SON and neurons in the suprachiasmatic nucleus (SCN). The dashed square indicates the region used as the reference for the array analysis (see Materials and Methods). OX, Optic chiasm. B, Nissl-stained SON region before (B1) and after (B2) laser microdissection. The arrow indicates MCNs in the SON, and the line in B1 indicates the border of the region that was actually dissected by the laser. Scale bar: (in A) A, 2 mm; B, 0.33 mm.
Collection of hypothalamic reference tissue. Blocks of hypothalamic tissue were obtained from 10 control male rats. After decapitation, the brains were removed from the skull and placed ventral side up on a rubber stopper. Coronal cuts were made rostral to the optic chiasm and caudal to the cerebral peduncle. The hypothalamus was removed from the resulting brain slices by making a cut at the top of the third ventricle and cuts at the lateral margins of the optic tracts (Fig. 1 A). The tissue samples were frozen in liquid nitrogen and stored at -80°C until they were extracted.
RNA extraction
Laser microdissected SON tissue. RNA isolation was preformed according to the manufacture's protocol with the Absolutely RNA Microprep kit (Stratagene, La Jolla, CA) (Dolter and Braman, 2001). After extraction, total RNA was measured using a Ribogreen RNA quantitation kit (Molecular Probes, Eugene, OR). The samples and the standard RNAs were excited at 485 nm, and the fluorescence emission intensity was measured at 535 nm using a fluorescence microplate reader (VICTOR2 1420 Multilabel counter; Wallac Oy, Turku, Finland). Fluorescence emission intensity of the samples was then plotted against an RNA standard curve. The average total RNA obtained from a pair of supraoptic nuclei from a single animal was 193.2 ng. Equal amounts of total RNA were pooled from each of three animals, and 150 ng per pool was used as the template for T7-based RNA amplification (see below). Two groups of pooled RNA samples were made.
Reference hypothalamic tissue. RNA extraction of the dissected hypothalamic blocks was done using Trizol (Life Technologies, Gaithersburg, MD) (Chomczynski and Sacchi, 1987), followed by DNaseI (GenHunter, Nashville, TN), and the product was cleaned up using an Absolutely RNA Microprep kit (Stratagene). Approximately 200 μg of total RNA was obtained from each block, and 5 μg of the RNA from each of the 10 animals was pooled together. One hundred fifty nanograms of the pool of RNA were amplified using T7-based RNA amplification. Thus, we used 150 ng of the pooled hypothalamic tissue RNA and the SON RNA in each reaction to obtain consistent amplification of the two samples.
T7-based RNA amplification
The RNA amplification was performed according to the manufacturer's protocol using the RiboAmp RNA Amplification kit (Arcturus, Mountain View, CA). The principles of this amplification have been described previously (Phillips and Eberwine, 1996). The first round of amplification was performed on 150 ng of the pooled hypothalamic reference and 150 ng of laser-microdissected SON material. For the second round, 500 ng of antisense RNA (aRNA) was collected from each of the samples and used as a template. The total amount of the RNA produced was measured using a spectrophometer (Ultrospec 2100 pro UV/Visible spectrophometer; Amersham Biosciences, Piscataway, NJ). The total amount of RNA produced in the first-round amplification of reference RNA was 10.6 μg, and the SON RNA was 6.6 μg. The total aRNAs from the second round were 138 μg and 198 μg for the hypothalamic reference and SON, respectively. The 260/280 ratios for the RNA sample after the second round ranged from 2.2 to 2.4, and the sample spectrum from OD230 to OD320 was that expected for pure RNAs. The length of the aRNAs ranged from 300 to 1300 bp after the first round and from 300 to 700 bp after the second round of amplification.
Microarray fabrication
Mouse DNA microarrays were printed on poly-l-lysine-coated slides. The cDNA libraries that were used to print the array were provided by Dr. Bento Soares (University of Iowa, Iowa City, IA; http://genome.uiowa.edu/projects/BMAP/; adult whole-brain cDNA library) and Dr. Minoru Ko (National Institute on Aging, NIH, Bethesda, MD; http://lgsun.grc.nia.nih.gov/cDNA/cDNA.html; embryonic brain cDNA library). Plasmids were extracted from the bacteria using QiaPrep Turbo kits (Qiagen, Valencia, CA) and a BioRobot 8000 (Qiagen). The cDNA inserts were amplified with modified M13 primers (M13F, 5′-GTTGTAAAACGACGGCCAGTG-3′; M13R, 5′-CACACAGGAAACAGCTATG-3′) and purified with MultiScreen PCR plates (Millipore, Bedford, MA). The PCR products were diluted in 50% DMSO to an average concentration of 200 ng/μl. These products (5 μl each) were transferred to 384-well plates (Genetix, St. James, NY) and then printed using an OmniGrid arrayer (GeneMachines, San Carlos, CA). The printed slides were aged for 1 week and then postprocessed before hybridization. For detailed descriptions of these procedures, visit the following web site: http://cmgm.stanford.edu/pbrown/mguide/index.html. To validate the dissections of the SON sample, we added rat VP and OT cDNAs to the arrays.
Microarray properties
The 35,319 elements printed include 11,720 product-defined clones and 23,599 product-undefined clones. The number of unigene clusters represented is 26,000. We found that cross-hybridization of mouse and rat hypothalamic RNAs on this array was 94%, indicating that it was appropriate for use for gene expression analysis of the rat hypothalamus (Fig. 2).

Comparison of rat and mouse hypothalamus cDNAs hybridized on a mouse array. A, Scanned images of an Mm36kd2 series mouse DNA array hybridized with Cy3-labeled (shown as a green signal) or Cy5-labeled (shown as a red signal) cDNA probes, which were generated from mouse and rat hypothalamus RNA, respectively. An image of half of the array is shown. The red signal indicates genes that are expressed at relatively greater levels in the rat hypothalamus compared with the mouse hypothalamus, and the green signal indicates genes that are expressed relatively more in the mouse hypothalamus compared with the rat hypothalamus. Yellow indicates genes that are expressed approximately equivalently in both species. Note that most of the spots on the array appear yellow, suggesting that most of the genes printed on the array are equivalently expressed in both the rat and the mouse hypothalamus. B, Scatter plot showing the correlation of the expression levels of rat and mouse hypothalamus cDNA probes hybridized on a mouse array. The data shown were normalized using ratio statistics (Chen et al., 1997, 2002). The log-transformed fluorescence intensity of each spot was compared between the two species. The light line in the center shows a correlation of 1.0, and the two light lines outside of the center line demarcate twofold differences. The dark lines demarcate fourfold differences between samples. Among the 35,099 genes that passed our quality criteria for hybridization (see Materials and Methods), 34,752 genes (99%) showed less than fourfold changes, and 32,486 genes (94%) showed less than twofold changes between the rat and the mouse. Approximately 19 genes (0.00054%) showed more than fourfold greater changes, and 544 genes (1.5%) showed more than twofold greater changes in the rat. There was a slight bias in favor of mouse cDNA hybridization on the array. Three hundred twenty-eight genes (0.0093%) showed more than fourfold greater changes, and 1709 genes (4.9%) showed more than twofold greater changes in the mouse than that of the rat cDNAs.
Probe labeling with amine-modified random primers
Probes were synthesized from 2 μg of amplified total RNA. The SON was labeled with cyanine 5 (Cy5), and the reference was labeled with cyanine 3 (Cy3). The labeling was performed as described previously (Xiang et al., 2002, 2003) with a minor modification. Briefly, the RNA was combined with 4 μg of amine-modified random primer (amine-C6-TNNNNNN; Sigma Genosys, The Woodlands, TX) and 5 U of RNase inhibitor (RNasin; Promega, Madison, WI) in a total volume of 18.5 μl, incubated at 70°C for 10 min, and chilled on ice for 10 min. The primer/RNA solution [6 μl of 5× first-strand buffer (Life Technologies), 0.6 μl of 50× aminoallyl dUTP/dNTPs (25 mm dATP, dGTP, and dCTP; 15 mm dTTP; and 10 mm aminoallyl dUTP; Sigma, St. Louis, MO), 3 μl of 0.1 m DTT, 2 μl of SuperScript II reverse transcriptase (Life Technologies)] was then added and incubated at 42°C for 2 hr. The reaction was terminated with 10 μl of 0.5 m EDTA, and the RNA was hydrolyzed with 10 μl of 1N NaOH at 65°C for 30 min. The solution was neutralized with 10 μl of 1 m HCl, and the MinElute PCR purification kit (Qiagen) was used to purify the products. The samples were concentrated to 9 μl in a vacuum centrifuge, and then 1 μl of 1 m sodium bicarbonate, pH 9.3, was added to the cDNA solution, followed by 14.5 μl of dye solution [NHS-ester Cy3 or Cy5 (Amersham Biosciences), 62.5μg/μlin DMSO]. The resulting solution was mixed by pipetting it up and down several times and was incubated at room temperature for 1 hr in the dark. The labeling reaction was stopped with 4.5 μl of 4 m hydroxylamine hydrochloride (Sigma). The contents of the tube were mixed, briefly centrifuged, and incubated for 30 min at room temperature in the dark. The probes were purified using the QIAquick PCR purification kit (Qiagen). The products were concentrated to 17μl in a vacuum centrifuge. Then, 4.5μl of 20× SSC, 2 μl of poly(A) (A60mer, 10 mg/ml; Sigma Genosys), 1 μl of human Cot-1 DNA (10 mg/ml; Life Technologies), and 1 μl of yeast tRNA (4 mg/ml; Life Technologies) was added, and the probes were denatured at 98°C for 2 min. The arrays were prehybridized to 5× SSC/0.1% SDS/1% BSA solution at 42°C for 1 hr, washed in H2O for 2 min, rinsed in isopropanol, and centrifuged at 800 rpm for 2 min to dry. The denatured probes were combined with 20 μl of 2× hybridization buffer (50% formamide, 10× SSC, and 0.2% SDS). The hybridization solution was pipetted onto the array, coverslips were applied, and the slides were placed in a hybridization chamber (Corning, Corning, NY). The slides were incubated in a 42°C water bath for 16 hr, the coverslips were removed in 2× SSC/0.1% SDS, and the slides were washed in 0.5× SSC, 0.01% SDS, and 0.06× SSC for 5 min each. The slides were centrifuged at 800 rpm for 2 min to dry before scanning.
Array scanning and data analysis
The arrays were scanned with a GenePix 4000A scanner (Axon Instruments, Foster City, CA) at a 10 μm resolution. The photo multiplier voltage settings were varied to obtain the maximum signal intensities with <1% probe saturation. The color images were formed by assigning the SON intensity in red and the hypothalamic reference intensity in green (Fig. 3). The resulting images were analyzed using IPLab (Scanalytics, Fairfax, VA) and ArraySuite (National Human Genome Research Institute, NIH, Bethesda, MD) software, and the ratios of the red over the green intensity for all targets were determined. Calibrated ratios were obtained by a normalization method based on the ratio statistics (Chen et al., 1997, 2002), and elements with ratios >2or <0.5 were considered to represent differentially expressed genes in the SON versus hypothalamic reference. To determine the reliability of each ratio measurement, a set of quality indicators were used, as follows: (1) association of sufficiently large numbers of pixels with the element; (2) flat local background; (3) uniform signal consistency within the target area; and (4) unsaturation of the majority of the signal pixels. Based on these indicators, a quality rank (Q) was measured ranging from 1 to 0, and genes with a Q score <0.1 were excluded from our analysis. A detailed description of this procedure was described previously (Chen et al., 1997, 2002). Also, genes that showed intensity <250 (which is four times the average background plus 3 SDs of the arrays in this experiment) in the red (SON) channel were excluded from the analysis. All data points were done in triplicate or more. Previous “self-on-self” control experiments using this amine-modified indirect labeling method gave high correlation coefficients (Xiang et al., 2002). The data indicated that the relative expression ratios obtained from these comparisons are reproducible and do not show sequence or dye bias.

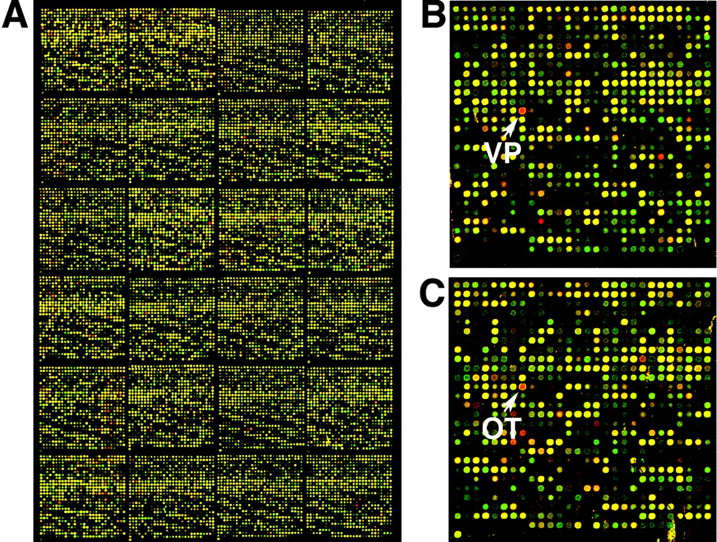
Scanned images of an Mm36kd2 series mouse DNA array hybridized with Cy3-labeled (shown as a green signal) or Cy5-labeled (shown as a red signal) cDNA probes, which were generated from amplified rat hypothalamus reference and laser-microdissected rat SON RNA,respectively. A, An image of half of the array is shown. The number of genes that showed a signal more than average background plus 3 SDs (∼60) is 33,599 genes (95% occupancy) for the SON-derived cDNA and 34,412 genes (97% occupancy) for the hypothalamus reference-derived cDNA. B, C, Higher-power views of individual panels on the array are shown including the VP (B) and OT (C) target cDNAs. The arrows indicate the printed spot for the VP and OT genes. The red signal indicates genes that are expressed relatively more in the SON compared with the total hypothalamus, and the green signal indicates genes that are expressed relatively more in the hypothalamus compared with the SON. Yellow indicates genes that are approximately equivalently expressed in both of the tissues.
In situ hybridization histochemistry
In this study, we used a quantitative in situ hybridization histochemistry (ISHH) protocol described previously (Young et al., 1986), with minor variations. The rat VP probe was a 229 bp fragment of the rat VP gene subcloned into pGEM-32 (Young et al., 1986). T7 and SP6 primers were used to PCR amplify the fragment, and the resulting PCR product was used as a template for the riboprobe synthesis. Plasmids contained selected expressed clones on the array that were studied by ISHH. First, we sequenced the plasmid to confirm the annotation. Then, these were PCR amplified using either T7 and a T3 primer [for Riken cDNA 2210012L08 gene; guanine nucleotide binding protein, α stimulating (GNAS); and Zinc finger 312] or a gene-specific primer sequence conjugated to a T7 or T3 primer sequence [for opsin, C1q domain containing 1 (C1q), expressed sequence tag (EST) similar to FLJ20037, glutathione peroxidase 3, eukaryotic translation elongation factor 1 α2, calreticulin (Calr), Rho GDP dissociation inhibitor (GDI) β, LIM only 4, PIPPIN, and putative homeodomain transcription factor] depending on the size of the insert. See Table 1 for PCR primer design and length of encompassing region in the clone. Each PCR product was used to obtain both sense and the antisense probes. Hybridization of each sense probe was performed as a negative control. The length of the resulting PCR product ranged from 500 to 600 bp and was used as a template for the labeling. Riboprobe synthesis was performed using 30-40 ng of the PCR product and 50 μCi of [α-35S]uridine 5′-triphosphate (UTP; Perkin-Elmer Life Sciences, Boston, MA), 10 mm DTT, along with the MAXIscript in vitro transcription kit (Ambion, Austin, TX).
Primer design and sequence information for the riboprobes used in the ISHH analysis
Serial 10 μm brain sections were cut on a cryostat and placed onto poly-l-lysine-coated slides (Fisher Scientific, Newark, DE), dried on a slide warmer for 10-30 min at 37°C, and then stored at -80°C. Before hybridization, the sections were fixed in 4% formaldehyde for 10 min at room temperature, rinsed once and washed twice for 5 min in 1× PBS, put into 0.1 m triethanolamine-HCl, pH 8.0, containing 0.25% acetic anhydride for 10 min at room temperature, rinsed with 2× SSC buffer and transferred through graded ethanol (75-100%), and then air dried. Hybridization was performed in an 80 μl hybridization solution (20 mm Tris-Cl, pH 7.4, 1 mm EDTA, pH 8.0, 300 mm NaCl 50% formamide, 10% dextran sulfate, 1× Denhardt's solution, 100 μg/ml salmon sperm DNA, 250 μg/ml yeast total RNA, 250 μg/ml yeast tRNA, 0.0625% SDS, and 0.0625% sodium thiosulfate) containing 106cpm denatured S 35-labeled riboprobe. After an overnight hybridization at 55°C, the sections were washed four times in 4× SSC, incubated with TNE buffer (10 mm Tris-Cl, pH 8.0, 0.5 m NaCl, and 0.25 mm EDTA, pH8.0) containing 20 μg/ml ribonuclease A for 30 min at 37°C, and then washed twice in 2× SSC, once in 1× and 0.5× SSC at room temperature, and twice in 0.1× SSC at 65°C. The sections were rinsed in graded ethanol solutions and then air dried. Finally, the sections were apposed to a low-energy storage phosphor screen (Amersham Biosciences) for 1-14 d and developed using a phosphorimager (Storm 860; Amersham Biosciences).
To evaluate the levels of mRNA in the supraoptic nuclei (Herman et al., 1991), the average densities and unit areas per SON of phosphor screen was measured in the sections from each rat bilaterally using the Image Quant software (version 5.2; Amersham Biosciences). Statistical significance of differences between groups was calculated by Student's t test. Differences between groups were considered statistically significant when p values were <0.05. Experiments were repeated on four animals, and results are expressed as mean ± SEM.
For double-label ISHH, digoxigenin (DIG)-labeled VP or OT anti-sense riboprobes and 35S-labeled antisense riboprobes of the novel genes were cohybridized to identify whether the genes we found on the array were VP or OT specific. DIG labeling was done per the manufacturer's instructions (Roche Diagnostics, Indianapolis, IN) using PCR-amplified VP (30 ng) and OT (100 ng) sequences as templates (see Table 1 for details of the primer design). Overnight hybridization at 55°C was done using a 106 cpm 35S-labeled antisense riboprobe and 1 μl of the 50 μl purified DIG-labeled antisense riboprobe per slide in a total of 80 μl of hybridization solution (same as the hybridization solution used in a single ISHH hybridization). Then, the slides were washed as in the single-probe hybridization method, processed for the DIG labeling probe by incubating in anti-DIG-AP (1:2000; Roche Diagnostics) made in 1× TBS (0.1 m Tris-Cl, pH7.5, fand 150 mm NaCl) and 5% normal goat serum (Vector Laboratories, Burlingame, CA) at 37°C for 5 hr, and developed with 0.33 mg/ml nitro blue tetrazolium chloride/0.165 mg/ml 5-bromo-4-chloro-3-indolyphosphate (BCIP/NBT combo from Invitrogen, Carlsbad, CA) and Levamisole (Vector Laboratories) in 0.1 m Tris-Cl, pH 9.5, 0.1 m NaCl, and 50 mm MgCl2 for 30 min to 1 hr at room temperature. The slides were coated with Ilford K.5D nuclear emulsion (Polysciences, Warrington, PA) and developed using D-19 (Eastman Kodak, Rochester, NY) after 7-60 d of exposure when the grains were visible. The slides were mounted with Cytoseal 60 mount medium and coverslipped.
Results
Representations of SON and hypothalamic RNAs on the microarray
RNA isolated from laser-microdissected supraoptic nuclei (Fig. 1B) and comparable levels (150 ng) of RNA from whole hypothalami from male rats used as a reference in all the experiments underwent two rounds of linear amplification using a T7-based in vitro transcription method (see Materials and Methods). In a preliminary study, we found that to obtain a sufficient amount of amplified RNA to generate probes for microarray analysis, two rounds of amplification from the SON samples were necessary. The average amplification was 17,424-fold for the SON and 19,504-fold for the hypothalamus after two rounds of amplification. The SON cDNAs were labeled with Cy5 (and assigned a red fluorescence signal when the image was processed), and the hypothalamic reference cDNAs were labeled with Cy3 (and assigned a green fluorescence signal when the image was processed). Fluorescent probes generated from the amplified RNA samples were hybridized on a microarray containing 35,319 genes (Fig. 3A). After hybridization, slides were scanned, independent images of the hypothalamic reference and SON channels were generated, and fluorescence intensities were calculated. After calculation, normalization was performed to adjust differences in labeling and detection efficiencies for the fluorescent labels from the two samples examined in the assay [normalization methods are reviewed elsewhere (Quackenbush, 2002)]. The number of elements with signals >3 SD above the average background (∼60) was 33,599 genes (i.e., 95% of the genes on the array) for the SON-derived cDNA and 34,412 genes (i.e., 97% of the genes on the array) for the hypothalamus-derived reference cDNA. The high occupancy rates show that both the hypothalamic and the SON samples have comparable and very high representations of genes on the microarray.
To identify genes that are preferentially expressed in the SON, we used the SON/hypothalamus expression ratio. The SON/hypothalamus expression ratio is the normalized value of the expression level for a particular gene in the SON sample, divided by the normalized value of this gene in the hypothalamic reference sample (see Materials and Methods). Among the 34,972 genes that passed our quality criteria for hybridization (see Materials and Methods), 1385 genes (0.040%), including the VP (Fig. 3B) and OT (Fig. 3C) genes, showed more than a twofold greater expression in the SON relative to the whole hypothalamus (see Table 2 and supplemental Tables 1S-3S, available at www.jneurosci.org/cgi/content/full/24/32/7174/DC1), and 1237 genes (0.035%) showed more than twofold greater expression in the whole hypothalamus relative to the SON. Among the latter were various glial-specific genes, such as myelin basic protein (see supplemental Table 4S, available at www.jneurosci.org/cgi/content/full/24/32/7174/DC1). The average Pearson correlation coefficient for replicate arrays was 0.86.
Genes on the array that are preferentially expressed in the SON compared with the total hypothalamus (with expression ratios ≥3.4)
To establish criteria for “preferential expression” in the SON, we first analyzed expression ratios for ubiquitous “housekeeping” genes, such as actin, tubulin, etc. The mean expression ratios (±SEM) of β-actin, α-tubulin, β-tubulin, and glyceraldehyde-3-phosphate dehydrogenase were 1.07 ± 0.04 (n = 8), 1.10 ± 0.05 (n = 8), 1.49 ± 0.07 (n = 3), and 1.50 ± 0.04 (n = 4), respectively, where n is the number of distinct elements (DNA sequences) on the array. On this basis, we defined that an expression ratio <2 reflected essentially equivalent levels of the expression of a gene in both tissues, and our subsequent analysis focused on genes with expression ratios between 2 and 3.4, between 3.4 and 9.4, and ≥9.4. Although genes with expression ratios from 2 to 3.4 are likely to be preferentially expressed in the SON, we did not attempt to validate this inference by ISHH, and hence we only present this list of these genes in supplemental Tables 1S-3S (available at www.jneurosci.org/cgi/content/full/24/32/7174/DC1) for interested readers. An expression ratio of 3.4 represented our threshold for preferential expression in the SON that was validated by ISHH (Fig. 4F). Expression ratios ≥9.4 include the OT and VP genes (Table 2), which are known to be very highly and selectively expressed in the SON.

ISHH analysis of genes determined by quantitative microarray analysis to be expressed at higher levels in the SON compared with the hypothalamus (see Table 1). The SON/hypothalamus expression ratio for each gene that was obtained by microarray analysis is indicated at the top right of each panel. ISHH was performed on coronal sections through the SON of a control rat. C1q, C1q domain containing 1; ZFP 312, zinc finger protein 312; Gpx 3, glutathione peroxidase 3; opsin, encephalopsin; Rho GDI, GDP dissociation inhibitor β; PIPPIN, cold shock protein; Lmo 4, LIM only 4. The arrows indicate the location of the SON.
ISHH validation of genes determined to be preferentially expressed in the SON
To determine whether the expression ratio measured by microarray analysis truly reflected preferential gene expression in the SON, a preliminary single-label ISHH analysis was performed on 20 genes, the expression ratios of which ranged from 0.6 to 44.0. This ISHH analysis was used to determine which clones could be detected in the SON and how predictive the expression ratio was with regard to preferential expression of a given gene in the SON. For this purpose, we used coronal hypothalamic frozen sections from normal male rats. All of these transcripts could be detected in the SON by ISHH, but the extent of hybridization in other regions of the brain greatly varied among mRNAs. Examples of the data obtained are shown in Figure 4. When the expression ratio was ≥3.4, an intense and clearly preferential expression was observed in the SON (Fig. 4A-F). When the expression ratio was ≤1.0 (Fig. 4G, H), there was detectable hybridization in the SON, but hybridization was comparable or greater in other regions of the hypothalamus.
Thus, we determined that an expression ratio ≥3.4 consistently reflected the preferential expression of genes in the SON. Table 2 shows a list of 77 genes with expression ratios ≥3.4. These genes have a wide variety of functions in the MCNs and are classified by presumed function in Table 2. The 54 other genes that showed an expression ratio ≥3.4 were unclassified ESTs, and these are presented in supplemental Table 1S (available at www.jneurosci.org/cgi/content/full/24/32/7174/DC1). Genes with moderate expression ratios (2-3.4) are presented in supplemental Tables 2S and 3S (available at www.jneurosci.org/cgi/content/full/24/32/7174/DC1), which show both functionally classified genes and unclassified ESTs, respectively. Finally, supplemental Table 4S (available at www.jneurosci.org/cgi/content/full/24/32/7174/DC1) presents a list of 83 genes with fourfold lower expression in the SON than in the whole hypothalamus (i.e., where the expression ratio was <0.25).
Osmotic regulation of preferentially expressed genes in the SON
We also used ISHH analysis to determine whether various preferentially expressed genes are regulated by osmotic perturbations. For this analysis, we compared the expression level of each gene in normal and hyperosmolar rats. Figure 5 illustrates the effect of chronic hyperosmolality on VP (Fig. 5A), C1q domain containing 1 gene (Fig. 5B), Rho GDP dissociation inhibitor β (Fig. 5C), and encephalopsin (Fig. 5D) gene expression. Quantitative analysis of the changes in SON mRNA levels of the transcripts illustrated in Figure 5 showed a significant increase in gene expression in all of the mRNAs examined during the hyperosmolar condition (Fig. 6). Table 3 shows the changes in gene expression in hyperosmolar versus control conditions for VP and nine other genes with expression ratios ≥3.4 that we selected from Table 2 and for four genes with expression ratios <3.4. All of the clones in Table 3 had increases in mRNA levels during the hyperosmolar condition. Among these genes, C1q domain containing 1 gene, Rho GDP dissociation inhibitor β, EST similar to FLJ20037, calreticulin, and encephalopsin had greater increases in expression in the supraoptic nuclei of hyperosmolar rats than did the VP gene.

Illustrations of ISHH analysis of changes in the expression level of various high-ratio genes as a result of chronic hyperosmolality (see Materials and Methods). C1q, C1q domain containing 1; Rho GDI, GDP dissociation inhibitor β; opsin, encephalopsin. The expression of mRNA in response to hyperosmolar stress is shown. The left panels show ISHH for SON in the control rat, and the right panels show ISHH results for SON in the hyperosmolar rat. The ISHH data shown were representative of four independent animal experiments. In this figure, the controls (also shown in Fig. 4 A, B, E, F) were normalized to tissue background of the hyperosmolar rats (for quantitative ISHH analysis, see Fig. 6).

Quantitative ISHH data showing changes in mRNA levels in response to hyperosmolar conditions. mRNA levels are shown for VP (A), encephalopsin (opsin) (B), C1q domain containing 1 (C1q) (C), and GDP dissociation inhibitor β (Rho GDI) (D). mRNA in control (□) and hyperosmolar (▪) rats are shown. The data are averages from four rats. *p < 0.05, compared with the control rat mRNA. Average values are shown as a percentage of the controls. Bars indicate the mean ± SEM. Statistical significance of difference between groups was calculated by the Student's t test. Note that each gene showed a prominent increase in the mRNA expression in response to the hyperosmolar stimulation.
Changes in mRNA levels of genes expressed in the SON, as a result of hyperosmolar stimulation, and determined by quantitative ISSH
OT- and VP-MCN-specific gene expression as evaluated by double-label ISHH
Double-labeled ISHH was also used to determine whether selected examples of the preferentially expressed genes were differentially expressed in OT versus VP neurons in the rat SON (Fig. 7, Table 3). Figure 7 shows examples of the data from these experiments. The MCNs were visualized by the hybridization of either an OT or VP riboprobe labeled with DIG (shown as a brownish precipitate), and the riboprobes derived from the genes on the array (see Table 1) were radioactively labeled with 35S-UTP and visualized as autoradiographic grains (shown as pseudocolor red in the figure). Of the three genes shown in Figure 7, the results with GNAS (Fig. 7 A, B) was typical of RNAs that were present at equivalent levels in the OT- and VP-MCNs, and C1q (Fig. 7C, D) and an EST similar to FLJ20037 (Fig. 7 E, F) represent RNAs that are preferentially expressed in VPMCNs. The last column in Table 3 summarizes these double-label ISHH data. Of the eight genes studied, C1q, EST similar to FLJ20037, and the Riken cDNA 2210012L08 gene, all with expression ratios ≥10, are preferentially expressed in VP-MCNs, and the other five were found in equivalent levels in OT- and VP-MCNs. Surprisingly, none of the selected preferentially expressed genes were expressed predominantly in OT-MCNs.

Illustrations of cell-specific gene expression in MCNs in the SON. Frozen sections were made from the SON of male rats and used in double-label ISHH experiments. The double-label ISHH was performed using 35S-UTP-labeled antisense riboprobes, as was done in the single ISHH experiments (see Figs. 4, 5, 6 and Table 1 for probe designs), and a DIG-labeled antisense riboprobe, generated from either an OT or a VP cDNA clone (see Table 1) to identify the phenotype of the MCN. Hybridization of DIG-labeled VP or OT riboprobes stains the cells brownish-purple, and radioactive grains, detected by polarized epifluorescence, were changed to pseudo-red in the figure to improve their visualization. A, C, E, Hybridization with DIG-labeled VP probe. B, D, F, Hybridization with DIG-labeled OT probe. A, B, Cohybridized with GNAS. C, D, Cohybridized with C1q domain containing 1 (C1q) gene. E, F, Cohybridized with FLJ20037 (EST similar to FLJ20037) radioactive probes. In A, the arrow shows an example of the mRNA coexpression in VP-DIG (positive) cells, and the arrowhead shows an example of the mRNA expression in a non-VP-expressing (i.e., DIG-negative) cell.
Discussion
In this study, we used laser microdissection, T7-based RNA amplification, and DNA microarrays to characterize the gene expression profiles of OT- and VP-MCNs in the SON. We were particularly interested in identifying genes, other than OT and VP, that are preferentially expressed in the SON. The microarray data from this study are presented in the form of expression ratios (i.e., the ratio of the signal in the SON relative to the total hypothalamus). Most of the genes that were previously known to be expressed in the MCNs resided in the 2-3.4 expression ratio category (see supplemental Tables 2S and 3S, available at www.jneurosci.org/cgi/content/full/24/32/7174/DC1) or had expression ratios <2 (data not shown). However, there is a wide variety of novel genes with expression ratios ≥3.4 that were found in the SON (Tables 2 and supplemental Table 1S, available at www.jneurosci.org/cgi/content/full/24/32/7174/DC1). Most notable are 19 genes related to transcription and translation (Table 2) and miscellaneous genes of unknown function (Table 2). It is in the latter category in which most of the genes with expression ratios ≥9.4 were found.
Genes with expression ratios equal to or >3.4 are shown in Table 2 (annotated and organized according to presumed function) and in supplemental Table 1S (as unannotated ESTs; available at www.jneurosci.org/cgi/content/full/24/32/7174/DC1). Some of these genes already known to be expressed in MCNs (Burbach et al., 2001) include OT, VP, prodynorphin and the GABA-A γ2 receptor subunit (Table 2). Other genes that are known to be expressed in the MCNs are absent from Table 2 because they have expression ratios <2; these include cholecystokinin, enkephalin, cocaine-amphetamine-regulated transcript, the GABAA receptorα1 and β2 subunits, GABAB receptor 1, several subtypes of AMPA (AMPA1, -2, -3, and -4), kainate (KA1, -2, and -5), NMDA (NMDA1, -2C, -2D, -3B), and metabotropic (mGLUR3) receptors. Similarly, the relative paucity of neuropeptides and secretion-related genes in Table 2 is an expected consequence of using the neuroendocrine-rich hypothalamus as the reference tissue. A very low expression ratio for the AMPA-2 subunit of 0.18 (see supplemental Table 4S, available at www.jneurosci.org/cgi/content/full/24/32/7174/DC1) supports the report that the functional AMPA receptor in the SON lacks this receptor subtype (Hollmann et al., 1991).
A relatively large number of genes with expression ratios ≥3.4 were found in the transcription- and translation-related category (Table 2). This may be because of the high rates of peptide biosynthesis in the MCNs (Burbach et al., 2001). The highest expression ratio among the transcription factors was 9.7 for the zinc finger protein 312 (also known as forebrain embryonic zinc finger, Fez). Zinc finger protein 312/Fez contains six C2H2-type zinc finger domains and is highly conserved in diverse species (Hashimoto et al., 2000; Matsuo-Takasaki et al., 2000; Yang et al., 2001; Levkowitz et al., 2003). Figure 4C shows that zinc finger protein 312 is robustly expressed in the SON and cortex (see also Matsuo-Takasaki et al., 2000) and increases more than twofold during hyperosmolar conditions (Table 3). This is the first study to identify the zinc finger protein 312 as an osmotically regulated transfactor in the rat SON, and future experiments will be directed at its possible role in the osmotic regulation of OT and VP gene expression.
Other genes shown in Table 2 are generally or ubiquitously expressed genes (e.g., ribosomal proteins, translation elongation/initiation factors, imprinted genes, etc.). Among these are general transcription factor IIA (Roeder, 1991; Cortes et al., 1992; Ma et al., 1996), transcription factor E2A (Murre et al., 1989; Melloul et al., 2002), Hu antigen D (Keene, 2001; Perrone-Bizzozero and Bolognani, 2002; Park-Lee et al., 2003), and Sox 17 (Kanai et al., 1996; Kanai-Azuma et al., 2002). It is interesting that these widely expressed, transcriptionally related gene products are preferentially expressed in the SON relative to the hypothalamus, with expression ratios ranging from 3.8 to 5.1 (Table 2), again likely correlating with the high rates of transcription that occur in the SON (Burbach et al., 2001). There are a number of miscellaneous genes presented in Table 2 that are selectively expressed in the SON, and these are highlighted in Table 3. The highest expression ratio in this group of genes is 24.6 for the C1q domain containing 1 gene. C1q domain containing 1 (also known as EEG-1) has been identified as a novel growth-related gene involved in hematopoetic differentiation and is also believed to also play a general role in terminal differentiation (Aerbajinai et al., 2004). This gene is of particular interest not only because it has an exceptionally high expression ratio, but also because its expression during chronic hyperosmolar conditions increases to 926% of control levels (Fig. 6, Table 3). The results of double-label ISHH indicate that the C1q gene is primarily expressed in VP-MCNs (Fig. 7, Table 3).
Several other ESTs with high expression ratios in Table 3 have no significant annotations in the database, to date, but are also clearly of interest. These include EST similar to FLJ20037, with a ratio of 10.7, and Riken cDNA 2210012L08, with a ratio of 10.0. Both genes are osmotically regulated in the SON, and FLJ20037 (Lagali et al., 2002) is expressed preferentially in VP-MCNs, whereas the Riken cDNA is expressed equivalently in OT- and VP-MCNs (Table 3). These two ESTs as well as two other EST clones, BE984462 and AW04654, shown in supplemental Table 1S (available at www.jneurosci.org/cgi/content/full/24/32/7174/DC1) with expression ratios >10 (but with no annotation), represent important sequences to archive, because as for C1q, valuable information about their identity and function may surface with time. Full-length clones from SON RNA must be obtained for all of these genes.
Other genes listed in Table 3 with expression ratios ≥3.4 were studied with regard to their osmotic regulation and cell specificity of expression. These include encephalopsin (ratio, 6.2) (Blackshaw and Snyder, 1999); guanine nucleotide binding protein, α stimulating (ratio, 5.4), reported previously in the SON (Young et al., 1987); calreticulin (ratio, 3.8) (Burns et al., 1994; Dedhar et al., 1994; Platet et al., 2000), glutathione peroxidase 3 (ratio, 10) (Mirault et al., 1994; Chen and Berry, 2003), and Rho GDP dissociation inhibitor β (ratio, 3.4) (Bito, 2003). All of these genes increased in expression more than twofold in the SON during hyperosmolar conditions (Table 3). Encephalopsin is a mouse G-protein-coupled receptor gene that was cloned as the first putative extraocular opsin in mammals specifically expressed in the brain (Blackshaw and Snyder, 1999). However, the expression pattern we observed in our ISHH analysis differed from the previous report in that we found a strong and specific expression in the SON and in the subfornical region (Figs. 4E, 5D). It is possible that the difference in ISHH data could be attributable to use of alternative splice variants of the encephalopsin gene. Additional sequencing and cloning will be necessary to definitively identify this gene in the SON. Calr is a multifunctional protein that acts as a major Ca-binding protein in the lumen of the endoplasmic reticulum. Calreticulin is also located in the nucleus and interacts with DNA-binding domains of nuclear receptors (Burns et al., 1994; Dedhar et al., 1994; Platet et al., 2000). Hence, calreticulin may be involved in the function of estrogen receptor β in the MCNs (Somponpun and Sladek, 2003). The Rho GTP dissociation inhibitor β (Rho GDI) regulates the GTP-bound and GDP-bound state cycle of Rho GTP-binding protein by decreasing the rate of dissociation from ras-like GTPases. Rho GTPases have an important role in neuronal morphogenesis (Bito, 2003), in large part by interacting with the intracellular actin fiber network. What its specific role is in MCNs remains to be determined.
A recent microarray study of the SON (Ghorbel et al., 2003) used a functional criterion (i.e., changes in gene expression with chronic dehydration) to identify potentially interesting genes expressed in the SON. Using a hand-dissection of the SON and an array assay of 1152 gene sequences, they identified 9 genes that were regulated by dehydration. Sequences for four of these genes were also present on our DNA array, and their expression ratios ranged from 0.71 to 1.48 (e.g., the IL-6 gene ratio was 1.48 ± 0.05). Interestingly, however, none of these genes met our expression ratio criterion of >2, let alone ≥3.4, and therefore were not SON specific and would have not been pursued using our identification strategy. This point emphasizes that tissue- and cell-specific expression, as reflected by the expression ratio, and functional regulations are independent parameters. We also demonstrate this point by the study of several genes that similarly did not reach an expression ratio of >2, but the expression of which was markedly increased by hyperosmolality (Table 3). These include the transcription-related genes PIPPin (Castiglia et al., 1996; Raimondi et al., 2003), and LIM only 4 (Kenny et al., 1998; Sugihara et al., 1998). Future experiments will focus on genes exhibiting exceptionally large (in comparison with VP) increases in expression in response to hyperosmolar conditions, such as zinc finger protein 312 (Fez), C1q domain containing 1, EST similar to FLJ20037, opsin, and Rho GD1, because of their potential important roles in regulating OT and VP gene expression in the SON.
Footnotes
- Received May 25, 2004.
- Revision received June 24, 2004.
- Accepted June 28, 2004.
This work was supported in part by the Japan Society for Promotion in Science. We thank Dr. Ying Tian (Georgetown University, Washington, DC) for help with preparation of the animals, Dr. Eva Mezey and Sharon Key [National Institute of Neurological Disorders and Stroke (NINDS), National Institutes of Health (NIH), Bethesda, MD] for help with in situ hybridization histochemistry, Dr. Yidong Chen (National Human Genome Research Institute, NIH, Bethesda, MD) for help with statistical analysis for microarray data, Catherine Campbell for suggestions about microarray analysis, Raymond L. Fields for technical assistance, and James W. Nagle and Debbie Kauffman (NINDS, DNA sequencing Facility, NIH, Bethesda, MD) for DNA sequencing.
Correspondence should be addressed to Dr. Harold Gainer, Laboratory of Neurochemistry, National Institute of Neurological Disorders and Stroke, National Institutes of Health, Bethesda, MD 20892. E-mail: gainerh{at}ninds.nih.gov.
Copyright © 2004 Society for Neuroscience 0270-6474/04/247174-12$15.00/0