
Abstract
To look for membrane potential oscillations that may contribute to sensory coding or amplification in the ear, we made whole-cell and perforated-patch recordings from hair cells and postsynaptic afferent neurites in the explanted frog sacculus, with mechanoelectrical transduction (MET) blocked. Small depolarizing holding currents, which may serve to replace the in vivo resting MET current, evoked all-or-none calcium spikes (39–75 mV amplitude) in 37% of hair cells tested, and continuous membrane potential oscillations (14–28 mV; 15–130 Hz) in an additional 14% of cells. Spiking hair cells were on average taller and thinner than nonspiking hair cells, and had smaller outward currents through delayed rectifier channels (IKV) and noninactivating calcium-activated potassium channels (IBK,steady), and larger inward rectifier currents (IK1). Some spiking hair cells fired only a brief train at the onset of a current step, but others could sustain repetitive firing (3–70 Hz). Partial blockade of IBK changed the amplitude and frequency of oscillations and spikes, and converted some nonspiking cells into spiking cells. Oscillatory hair cells preferentially amplified sinusoidal stimuli at frequencies near their natural oscillation frequency. Postsynaptic recordings revealed regularly timed bursts of EPSPs in some afferent neurites. EPSP bursts were able to trigger afferent spikes, which may be initiated at the sodium channel cluster located adjacent to the afferent axon's most peripheral myelin segment. These results show that some frog saccular hair cells can generate spontaneous rhythmic activity that may drive periodic background activity in afferent axons.
Introduction
As a detector of seismic waves and airborne sounds in the 5–200 Hz frequency range (Eatock et al., 1987; Yu et al., 1991), the frog sacculus contains mechanosensory hair cells specialized for sensitivity to these low-frequency stimuli. One specialization, electrical tuning, amplifies membrane potential changes at frequencies near the hair cell's “resonance” frequency and causes transient oscillatory responses to current steps (Ashmore, 1983; Lewis and Hudspeth, 1983). The mechanism of electrical tuning in the frog sacculus was previously studied using whole-cell voltage clamp of isolated (i.e., enzyme treated and mechanically dissociated) hair cells (Hudspeth and Lewis, 1988a,b) and found to be similar to electrical tuning of auditory hair cells in other nonmammalian vertebrate species (reviewed by Fettiplace and Fuchs, 1999). These results support a model in which sensory inputs pass through several stages of “graded” signal processing, including mechanoelectrical transduction (MET), electrical resonance, and specialized synaptic transmission (Rutherford and Roberts, 2006), before a nerve impulse is generated in the afferent neurite (reviewed by Roberts and Rutherford, 2008).
Some of the data that support this model are inconsistent with in vivo frequency selectivity and experiments using hair cells in more intact preparations. For example, frog saccular hair cells isolated using papain have sharply tuned resonances at frequencies >100 Hz, but the sacculus is broadly tuned and most sensitive at 50 Hz. This discrepancy has been explained by the effects of this enzyme on IBK, IKV, and the voltage-gated Ca2+ current (ICa) (Armstrong and Roberts, 1998, 2001). Isolation procedures using other enzymes may have less severe effects on hair cell properties (Catacuzzeno et al., 2003a,b), but there are no reports of any isolation procedure that preserves the capacity of frog saccular hair cells to generate all-or-none spikes, which have been observed only in more intact preparations using sharp electrodes (Hudspeth and Corey, 1977; Ashmore, 1983) or patch pipettes (Armstrong and Roberts, 1998). Spikes and spontaneous oscillations have been reported for low-frequency hair cells isolated with papain from the sacculi of fish (Sugihara and Furukawa, 1989; Steinacker and Romero, 1992) and the cochleae of alligators (Fuchs and Evans, 1988; Eatock et al., 1993) and chicks (Fuchs et al., 1988).
Some experiments on isolated frog saccular hair cells have shown spontaneous membrane potential oscillations and other instabilities (Ospeck et al., 2001; Catacuzzeno et al., 2004; Jørgensen and Kroese, 2005). Spontaneous electrical activity in hair cells may be involved in bidirectional feedback interactions with active hair bundle motility (Denk and Webb, 1992; Martin et al., 2003) to maximize sensitivity to small sensory signals (Eguíluz et al., 2000). It could also influence both the background spike pattern (Manley, 1979; Crawford and Fettiplace, 1980) and the precise spike timing in afferent axons from the frog sacculus (Koyama et al., 1982; Christensen-Dalsgaard and Narins, 1993).
We studied nonisolated frog saccular hair cells, and show that some generate spontaneous and evoked spikes and oscillations. We describe the ionic currents associated with these phenomena, and show that spontaneous hair cell activity can cause transmitter release that triggers impulses in afferent neurites.
Materials and Methods
Experimental preparation.
Rana pipiens (Niles Biological) were maintained at 17°C and killed (double pithed, then decapitated) before dissection in accordance with the regulations of the Institutional Animal Care and Use Committee of the University of Oregon. All experiments were performed in a temperature-controlled room at 20–22°C and were completed within 4 h. Approximately 100 frogs were used in this study. The sacculus was isolated and the otolithic membrane removed under a dissecting microscope before transferring the tissue to a rectangular well cut into silicone elastomere (Sylgard 184; Dow Corning) on a microscope slide. The tissue was secured by sliding the edges of the epithelium under steel pins stuck horizontally into the Sylgard, and the sensory epithelium was furrowed to the minimum depth required to expose nerve fibers and the basolateral surfaces of hair cells. Furrowing began by making a small tear in the apical surface of the macula with a piece of dog hair (0.5 cm long) glued to a stick (Armstrong and Roberts, 1998; Rutherford and Roberts, 2006). The chamber was then transferred to a fixed-stage upright microscope and viewed under differential interference contrast (DIC) optics (63× objective with 10× eyepieces), and the furrow was extended using fine-tipped glass probes mounted on micromanipulators. A wide-tipped (5–20 μm) capillary glass suction pipette was then used to gently clear away dead cells and debris. A suitable recording site was located on hair cell basolateral membranes, or on a submicron diameter nonmyelinated neurite 5–20 μm from the closest synaptic terminal.
Electrophysiology.
Dissection and electrical recording were performed in extracellular saline solution (normal artificial perilymph) that contained the following (in mm): 112 Na+, 2 K+, 1.8 Ca2+, 119 Cl−, 5 HEPES, and 3 d-glucose. High-K+ artificial perilymph (40 mm K+) was made by equimolar substitution for Na+. The concentration of Ca2+ (1.8 mm) in the extracellular solution greatly diminishes resting MET (Corey and Hudspeth, 1983; Farris et al., 2006), which in 21 of 49 hair cell recordings and all postsynaptic afferent recordings was additionally blocked by adding 100 μm amiloride (Jørgensen and Ohmori, 1988). Recording pipettes were filled with intracellular solution that contained the following (in mm): 104 K+, 8 Na+, 2 Mg2+, 0.274 Ca2+, 109 Cl− or aspartate, 1 EGTA, 10 HEPES, 5 glutathione, 3 ATP, and 1 GTP. For perforated-patch recording, we used filament-glass pipettes and dipped the back end in normal intracellular solution for 5–10 s to draw a small amount of fluid into the tip before filling with intracellular solution that contained both a lipophilic polyene (solubilized amphotericin B, 500–1500 μg/ml) to create transmembrane channels and a membrane-impermeant fluorescent marker (3000 MW fluorescein–dextran, 30 μg/ml, Invitrogen) to monitor patch rupture. All solutions were titrated to approximately pH 7.25 and 220 mOsm. Except as noted, all reagents were purchased from Sigma.
Data were acquired using an EPC10 intracellular amplifier (HEKA Elektronik), low-pass filtered (7 kHz cutoff), and digitized (20 or 40 kHz sample rate). Pipettes for intracellular recording were pulled from borosilicate filament-glass on a model P-2000 electrode puller (Sutter Instruments). To minimize access resistance, pipettes were pulled to taper steeply at the tip and subsequently shaped by heating the tip while applying pressure to the lumen (Goodman and Lockery, 2000).
The pipette voltage offset was adjusted to null the current at −6 mV or −13 mV (the calculated liquid junction potential between the intracellular and extracellular solutions for potassium chloride or potassium aspartate, respectively) before advancing the pipette into contact with the hair cell or neurite. Hair cell recordings had access resistances generally below 15 MΩ for whole-cell (ruptured-patch) and below 20 MΩ for perforated patch. The current-clamp traces displayed have not been corrected for errors due to series resistance (12.9 ± 1.0 MΩ, mean ± SEM). For the voltage-clamp I–V curves (see Fig. 6; supplemental Figs. S2, S3, available at www.jneurosci.org as supplemental material) the command potential was corrected for errors due to series resistance based on the net current in each 0.5 ms time window. The fits in Figure 5 are for voltage-clamp commands to −120 and −30 mV, not corrected for errors due to series resistance. We did not apply active Rs compensation in the present study. For voltage-clamp recordings, the average Rs (mean ± SEM) was 12.6 ± 1.2 MΩ for all cells, and this mean was not significantly different from the mean Rs for spiking (13.3 ± 0.9 MΩ, n = 10, p = 0.74), oscillating (11.4 ± 1.5 MΩ, n = 4, p = 0.70), or nonoscillating (12.5 ± 0.6, n = 13, p = 0.97) hair cells.
Successful recordings from afferent neurons were identified by the ability to elicit spikes upon current injection, and verified by filling the process with dye from the recording electrode. Spikes in afferent neurons were reversibly abolished by 1 μm tetrodotoxin (TTX, Sigma), and synaptic events were attenuated by 75% by 10 μm 6-cyano-7-nitroquinoxaline-2,3-dione (CNQX, Sigma), an AMPA-type glutamate receptor antagonist that blocks hair cell afferent synapses (Glowatzki and Fuchs, 2002; Keen and Hudspeth, 2006). Diffusion barriers between the bath and the synaptic clefts in the semi-intact epithelium may have been responsible for the incomplete block by CNQX, as evidenced by the prolonged onset and recovery times (minutes).
Fitting of currents.
We used the known activation time course of each of the six major voltage-gated and calcium-gated conductances to separate the total currents evoked by command steps from a holding potential of −70 mV to −30 mV, and from −70 mV to −120 mV, into the sum of individual components:
 where I−30(t) and I−120(t) are the leak-subtracted data, Ih is the hyperpolarization-activated K+/Na+ current, “*” is the convolution operation, and F(t) is the impulse response of the low-pass filter associated with the recording. F(t) resulted primarily from the electrode resistance and cell capacitance, but also included the 7 kHz anti-aliasing filter, which further smoothed and delayed the recorded currents. For F(t), we used the transient response to a small (2–4 mV amplitude) depolarizing voltage command from −70 mV, normalized to have area = 1. The response to the small command step was also used for leak subtraction and to determine the charging time constant, τRC. To account for the delay in applying voltage-clamp commands through the electrode series resistance, the command was also assumed to be delayed by 0.6τRC.
We did not include the A-type K+ current in our analysis because, if present, it is almost completely inactivated at −70 mV (Catacuzzeno et al., 2003b), or the small-conductance Ca2+-activated K+ current (ISK), because it is small (<70 pA) for step commands from −70 mV to −30 mV and is present in only some frog saccular hair cells (Chabbert, 1997). If present, ISK would be included in IKV because the two currents have similar activation kinetics.
We used Hodgkin-Huxley models to describe ICa, IKV, IK1, and Ih (Armstrong and Roberts, 1998, 2001; Catacuzzeno et al., 2003b):


 where τCa = 110 μs, τK1 = 1 ms, τh = 100 ms, and ĪCa, ĪKV, ĪK1, and Īh were the fitted asymptotes of the currents at t = ∞. We found it necessary to fit τKV separately for each cell, with the constraint that τKV >5 ms.
We modeled separate populations of inactivating (IBK,transient) and noninactivating (IBK,steady) calcium-activated potassium channels (Armstrong and Roberts, 2001). IBK,steady was modeled using a kinetic scheme with three closed states (C0, C1, C2) and two open states (O2, O3) (Hudspeth and Lewis, 1988b; Catacuzzeno et al., 2004):
 where O2(t) + O3(t) is the probability that a BK channel is open and ĪBK,steady is the current that would flow if all noninactivating BK channels were open. We used the same kinetic constants as Hudspeth and Lewis (1988b), except that we increased the rate constant C2→O2 from 1.0 ms−1 to 3.0 ms−1 to obtain sufficiently rapid BK channel activation to fit the data. In keeping with the model, we assumed that free Ca2+ accumulated in proportion to ICa and decayed exponentially:
 where k = 2.8 ms−1 and ρ was a fitted parameter that specifies the coupling between Ca2+ channels and BK channels (units: millimolar per picoampere).
We modeled IBK,transient as a separate population of channels with three closed states (C′0, C′1, C′2), two open states (O′2, O′3,), and one inactivated state:

We used the same activation gating scheme as for IBK,steady, and assumed that inactivation occurred only after the channel opened, with a rate constant of 3.3 ms−1 from either open state. This produced a peak open probability of ∼0.3, consistent with the increased IBK following application of papain, and a macroscopic inactivation time constant of 1–2 ms (Armstrong and Roberts, 2001).
We used a combination of linear least-squares fitting and a trial-and-error search algorithm to find the values of ĪCa, ĪKV, ĪBK,transient, ĪBK,steady, ĪK1, Īh, ρ, and τKV that minimized the mean squared error. The procedure always converged to the same solution in <1000 iterations. The reported values of ICa, IKV, IBK,steady, IK1, and Ih are the fitted currents at the end of the voltage-clamp step. The reported value of IBK,transient is the maximum transient BK current during the step.
Confocal imaging.
For cytoplasmic nerve fill (see Fig. 8A), the VIIIth cranial nerve was sectioned close to the brainstem, and the isolated sacculus (not furrowed) was transferred to a Petri dish containing artificial perilymph +100 μm amiloride. The cut end of the nerve was placed in a small well formed by a petroleum jelly dam and incubated for 12 h at 4°C in 30 mg/ml fluorescein–dextran (3000 MW; Invitrogen) dissolved in intracellular saline. In some experiments, 5 μm FM1-43 (Invitrogen) was included in the artificial perilymph, followed by a wash in perilymph with 100 μm Cd2+ (see Fig. 8A, bottom inset). For viewing on the confocal microscope (Bio-Rad), the sacculus was mounted in artificial perilymph + 100 μm amiloride under a coverslip on a microscope slide.
For immunochemistry afferent neurites were labeled with a monoclonal neurofilament antibody (neurofilament-associated antigen 3A10, Developmental Studies Hybridoma Bank) or a pan-specific monoclonal voltage-gated sodium channel antibody (anti-pan-Na+ channel, mouse IgG1, Sigma) (Rasband et al., 1999). The tissue was dissected and isolated in artificial perilymph + 100 μm amiloride, then fixed for 45 min at room temperature in artificial perilymph + 4% paraformaldehyde. Following a wash at room temperature (3 × 15 min) in PBS (in mm: 137 NaCl, 2.7 KCl, and 20 phosphate buffer), the tissue was permeabilized for 1 h at room temperature in PBDT (PBS with 1% BSA, 1% DMSO, 0.1% Triton, and 2.5% goat serum), rocked overnight at 4°C in primary antibody (1:2000 in PBDT), washed at room temperature (3 × 15 min on a rocker) in PBDT, and incubated in secondary antibody (1:200 in PBDT) on a rocker for 1 h at room temperature. The tissue was rinsed once more on a rocker (3 × 15 min in PBDT) at room temperature before being mounted under a coverslip in FluoroGuard (Bio-Rad). Control sections with primary antibody omitted were processed in parallel and in no cases did the controls fluoresce above background levels.
Data analysis.
Hair cell spike or oscillation amplitude and frequency were calculated at different levels of holding current between −50 and +300 pA (see Figs. 2, 3, 5E,F). The holding current was held constant for several seconds, and the maximum (peak-to-trough) voltage excursion in the data record was measured, excluding the initial 100 ms. The peak-power frequency of the data sample was determined from the power spectrum, computed by taking the Fourier transform of the non-circular autocorrelation function of the data, using the FFT and CORRELATE operations in IGOR software (Wavemetrics).
In hair cells that generated spikes at holding current = 0 pA, resting potential was measured, when possible, as the interspike baseline. For all other hair cells, including those that generated spontaneous oscillations, resting potential was measured by time averaging a representative data sample obtained with a command of 0 pA. Some hair cells (24%) displayed a form of membrane potential instability at holding currents between +50 pA and −50 pA in which the membrane potential flipped spontaneously between two states (Jørgensen and Kroese, 2005). In these cells, resting potential and all other measurements were made using the state with the greatest dwell time. These transitions between two relatively hyperpolarized membrane potentials were excluded from analyses of amplitude and frequency for spiking, oscillating, and nonoscillating cells (i.e., their amplitudes were not measured for consideration as a spike or oscillation, nor were data segments containing such transitions included in the analysis of the power spectra).
In one series of experiments we used the length:apical diameter ratio (see Fig. 3F,G) as a measure of hair cell morphology (Chabbert, 1997). When allowed by the spatial relationship between hair cells on the edge of the furrowed epithelium and the microscope objective, we estimated the apical diameter and the distance from apical plate to basal pole, using an eyepiece micrometer and DIC optics (see Fig. 8C) before the recording. To aid in this measurement, a suction pipette was used to gently pull on the neighboring epithelium to cause the target hair cell to protrude horizontally in the x–y plane of the microscope.
EPSC waveforms (low-pass filtered at 7 kHz) (see Figs. 9, 10) were analyzed to determine event amplitudes and occurrence times using the Mini Analysis Program (Synaptosoft), and verified by eye. Waveforms with more than one inward current peak were considered to consist of multiple events, and the time of each peak was recorded as a time of occurrence. Event amplitude was measured as the difference between the current measured at the peak and at the event onset. For the autocorrelation of a hair cell oscillation or afferent EPSC train (supplemental Fig. S1B,E, available at www.jneurosci.org as supplemental material), the noncircular autocorrelation function was computed using the CORRELATE operation in IGOR software.
Statistical averages are presented as mean ± SEM. Comparisons were made with two-tailed t tests assuming unequal variances.
Results
The data in this study were obtained from 49 hair cell recordings (35 ruptured patch, 14 perforated patch) and 22 recordings from postsynaptic afferent neurites, all from the isolated frog sacculus in which both the apical and basolateral hair cell surfaces were exposed to artificial perilymph. The high Ca2+ concentration in perilymph (1.8 mm) compared with endolymph (50–100 μm) inhibits the resting excitatory MET current, thereby hyperpolarizing hair cells relative to the in vivo resting potential (Holton and Hudspeth, 1986; Eatock et al., 1987; Shepherd and Corey, 1994; Vollrath and Eatock, 2003; Farris et al., 2006). Averaged across all hair cells, the resting potential was −63.9 ± 1.9 mV (n = 28) with no additional blockade of MET, and −73.2 ± 3.0 mV (n = 21) in another group of hair cells with 100 μm amiloride in the bath to block residual MET. No other effects of amiloride were noted; therefore data from both groups have been combined. Spikes, oscillations, and nonoscillating resting potentials were observed in both whole-cell and perforated-patch recordings, as well as with and without amiloride. All recordings from afferent neurites were made in the presence of 100 μm amiloride.
Hair cell spikes and oscillations at rest and in response to depolarizing holding currents
Hair cells exhibited several types of spontaneous activity (under current clamp at I = 0) in normal artificial perilymph. In addition to cells with relatively stable resting potentials (Fig. 1C), we observed spikes (Fig. 1A), oscillations (Fig. 1B), and membrane potential bistability [rapid transitions between a stable hyperpolarized level and a depolarized level around which oscillations occurred (Fig. 1D), or between two relatively hyperpolarized membrane potentials (Jørgensen and Kroese, 2005)]. Spikes were uniform in size and shape within a given hair cell, with occasional failures to reach threshold (Fig. 1A), indicating that they are all-or-none events. Spike waveforms varied between cells, but typically had sharp peaks separated by a slower voltage ramp during the interspike interval. Unlike spikes, oscillations were not all-or-none events with sharp peaks, but instead were sinusoidal with amplitudes that fluctuated on a timescale of hundreds of milliseconds (Fig. 1B). Spikes and oscillations coexisted in some hair cells (Fig. 1D).

Spontaneous activity in hair cells. Current-clamp recordings (I = 0) from four hair cells (two timescales in A–C). A, Repetitive spikes (39 mV amplitude) with occasional failures. B, Variable amplitude oscillations. C, Small voltage fluctuations with no obvious periodicity. D, Oscillations interrupted by a spike followed by a hyperpolarization and gradual return to oscillation. A second hyperpolarization later in the trace was not preceded by a spike. When depolarized by ≥20 pA, this cell fired a repetitive spike train (data not shown). Ruptured-patch recordings without (A–C) or with (D) amiloride in the bath.
Depolarizing holding currents modulated the amplitude and increased the frequency of both spikes (Fig. 2A) and oscillations (Fig. 2B), and initiated spiking or oscillation in some hair cells that did not spike or oscillate at the resting (zero-current) potential. Spikes and oscillations were distinct from the transient responses following current-clamp steps, which have been studied previously in this preparation (Armstrong and Roberts, 1998). For example, in their Figure 2, Armstrong and Roberts (1998) show damped sinusoidal waveforms (B, D) or waveforms that first decay in amplitude before growing again (C) during the first 100 ms following a current step. In the present study, we observed spikes and oscillations that occur at I = 0 and during prolonged depolarizations (e.g., Figs. 1, 2; and see Fig. 6, right panels).

Holding current modulates spikes and oscillations. Each panel shows two current-clamp recordings (red, black) from one cell, with holding current and spike or oscillation frequency shown in the corresponding color. A, Depolarization increased the spike rate and reduced timing variability. B, Depolarization increased oscillation frequency and decreased the amplitude.
By measuring the largest spike, oscillation, or small membrane potential fluctuation observed over a range of holding currents (2–10 s duration, excluding the transient response during the initial 100 ms), we were able to classify hair cells into three groups (Fig. 3E). Forty-nine percent (24/49) had only small membrane potential fluctuations (≤7 mV) and were categorized as “nonoscillating”; 14% (7/49) produced maximum oscillations of 14–28 mV and were classified as “oscillating”; and 37% (18/49) produced large (39–75 mV) voltage waveforms at some holding currents, and were classified as “spiking.” We note that 44% of the spiking hair cells also produced smaller oscillations (e.g., supplemental Figs. S2A, S3A, right panels, available at www.jneurosci.org as supplemental material). In our dataset, the distinction between oscillations and spikes could be based solely on amplitude because spikes always exceeded 39 mV, whereas oscillations were always <30 mV. Given our limited sample size, and the highly variable amplitudes of the membrane potential oscillations that we observed, we note that the operational definition of spikes and oscillations based solely on amplitude is somewhat arbitrary.

Spike or oscillation amplitude and frequency as a function of holding current, and in relation to cell morphology. A, Spike amplitudes at different holding levels for nine hair cells that fired repetitive spike trains. The abrupt appearance of full-size spikes with increased holding current reveals their all-or-none character. B, Spike frequencies for the same cells as in A. C, Maximum oscillation amplitudes at different holding levels in seven nonspiking hair cells. D, Oscillation frequencies for the same cells as in C. Different colored lines in A and B and in C and D are for corresponding cells. E, Distribution of maximum amplitudes of voltage fluctuations observed in 49 hair cells: spiking (red), oscillating (blue), and nonoscillating (black). F, Positive relationship between hair cell length:apical diameter ratio and maximum amplitude. G, Negative relationship between length:apical diameter ratio and peak-power frequency at the holding current that produced the maximum amplitude. Markers in F and G are colored as in E.
Another distinguishing characteristic of spikes was their clear threshold. As the depolarizing holding current was increased, spiking began abruptly, with the largest spike amplitudes for the smallest holding currents that evoked spikes and slightly smaller spikes during larger depolarizations (Fig. 3A). In contrast, oscillation amplitudes grew with increasing depolarization, attained a maximum for holding currents between 25 and 150 pA (Fig. 3C), and declined with further depolarization.
Half (9/18) of the spiking hair cells were capable of sustained repetitive firing (e.g., Figs. 1A, 2A; see Fig. 3A,B for summary of amplitudes and frequencies for all 9 cells). Most of these were located in the outer three rows of the saccular macula (supplemental Figure S5A, available at www.jneurosci.org as supplemental material), where nearly all (7/8) of the spiking hair cells fired repetitively. In contrast, only 2 of 10 more centrally located hair cells could sustain repetitive firing. We determined the repetitive firing rate from the power spectrum of the membrane potential. Six cells had spike rates that increased to a maximum of 7–10 Hz (n = 2) or 25–40 Hz (n = 4) over a narrow range of depolarizing currents. The other three fired repetitively at higher frequencies (>50 Hz) and did not reach a maximum firing rate for the largest currents tested.
All but one of the repetitively spiking hair cells (8/9) were active for less than or equal to +100 pA (Fig. 3A,B), with spike rates that decreased only slightly over several seconds of depolarizing current, suggesting that they may fire spikes in vivo when depolarized by the resting MET current. Five of these were active for less than or equal to +50 pA (e.g., Fig. 2A), and two fired repetitively at I = 0.
Among the nine spiking hair cells that did not generate persistent repetitive activity at any holding current, and therefore did not have a well defined firing rate, five fired irregular low-frequency spikes at zero current, and four required depolarization to elicit a train of spikes that adapted over seconds (e.g., see Fig. 6A, right; supplemental Figs. S2A, S3A, right panels, available at www.jneurosci.org as supplemental material).
Oscillation frequency, measured as the peak of the power spectrum (see Materials and Methods) was typically <15 Hz at zero holding current and reached a plateau between 45 and 70 Hz for holding currents greater than +50 pA (Fig. 3D). Data from five of seven oscillating hair cells were consistent with this pattern. Although oscillations showed great variability in amplitude, the oscillation frequency in response to a particular holding current remained relatively constant over many cycles (supplemental Fig. S1A–C, available at www.jneurosci.org as supplemental material).
Within the central field of the saccular macula (i.e., excluding the outer 3–4 rows that comprise predominantly tall, thin hair cells), spiking hair cells were on average taller and thinner than the others and sometimes had peanut-shaped profiles, while nonspiking hair cells were typically more cylindrical. We quantified these morphological differences by measuring the ratio of cell length to apical diameter before recording from each of 28 hair cells from the central field. Cells were selected based on accessibility for recording, without preference for specific morphology. The mean ratios were significantly larger for spiking hair cells (4.4 ± 0.52, n = 10) than for the others (2.7 ± 0.18, n = 18, p = 0.013), and did not differ significantly between oscillating (2.8 ± 0.52, n = 5) and nonoscillating (2.7 ± 0.18, n = 18, p = 0.90) hair cells. Overall the ratios of length to apical diameter (mean, 3.3 ± 0.26; range, 1.5–7.6) were 30–60% greater than those reported previously for papain-treated and dissociated frog saccular hair cells (Holt and Eatock, 1995), and closer to those reported for other methods of isolation or for nondissociated cells (Chabbert, 1997). Tall and extremely thin hair cells with length to apical diameter ratios of 10–20 were observed in the central and peripheral fields of the macula but attempts to record from them were unsuccessful. Despite the differences in length:apical diameter ratio between spiking and nonspiking cells (Fig. 3F,G), there were no significant differences in Cm between the three classes of hair cells (spiking, 12.9 ± 1.0 pF, n = 10; oscillating, 14.5 ± 1.7 pF, n = 4; nonoscillating, 14.1 ± 0.72 pF, n = 12).
Hair cell responses to sinusoidal current stimulation
To test the frequency selectivity of frog saccular hair cells, a sinusoidal current stimulus was applied, with frequency swept over the range of vibratory sensitivity for the frog sacculus. Spiking hair cells fired multiple spikes per cycle at low frequencies, with fewer spikes per cycle and skipped cycles appearing as the frequency increased, until firing stopped above some frequency that varied among cells (Fig. 4A,B). Oscillating hair cells had bandpass response properties (Fig. 4C, black) when the small sinusoidal stimulus was delivered around a holding level that generated spontaneous oscillations, and only passive RC responses (Fig. 4C, gray) in response to sinusoidal stimulation around hyperpolarized holding levels that did not generate spontaneous oscillations. Within the oscillating range, shifting the holding current in the depolarizing direction shifted the bandpass envelope to higher frequencies (e.g., from 4 to 30 Hz in Fig. 4D). In each oscillating hair cell tested, the frequency of highest gain in response to sinusoidal currents matched the frequency of the spontaneous oscillations at the same DC offset. Hair cells classified as nonoscillating (maximum amplitude of spontaneous fluctuations <7 mV) showed broader bandpass properties (e.g., Fig. 4E, black traces) than cells classified as oscillating. Larger depolarizing DC offsets shifted amplification to higher frequencies (Fig. 4D), up to ∼150 Hz in nonoscillating hair cells and <100 Hz for oscillating hair cells (data not shown).

Responses to sinusoidal currents. A, Spiking hair cell was held at I = 0 before application of a DC + sinusoid stimulus (50 ± 50 pA) beginning at time 0. The frequency was swept from 0 to 34 Hz (top axis) in 15 s (bottom axis). Spikes ceased above ∼20 Hz (red arrow), leaving a smaller oscillatory response to the higher-frequency stimulus. B, Another spiking hair cell ceased firing at ∼30 Hz (red arrow) when stimulated as in A, but without a DC offset (0 ± 50 pA). C, An oscillating hair cell showed bandpass amplification centered near 20 Hz in response to stimulation by 80 ± 20 pA (black) but not 40 ± 20 pA (gray). Note the slow appearance of oscillations during the first 2 s after application of the 80 pA offset. D, In another oscillating hair cell (perforated patch), changing the stimulus from 15 ± 20 pA to 55 ± 20 pA shifted the envelope of amplification to a higher frequency. E, A hair cell (perforated patch) that did not oscillate at any constant holding current amplified oscillatory inputs in a broad band centered near 20 Hz (black). Application of 100 nm iberiotoxin (blue) to block IBK caused this cell to generate 20 mV oscillations for DC stimuli, and shifted the center frequency for amplification down by approximately one octave.
Frequency-selective amplification (electrical tuning) by hair cells has previously been reported to involve the interaction of ICa and IBK (Crawford and Fettiplace, 1981; Lewis and Hudspeth, 1983; Hudspeth and Lewis, 1988a,b; Fettiplace and Fuchs, 1999). In these cases, frequency selectivity is determined primarily by the amplitude and kinetics of IBK. However another study of isolated frog saccular hair cells (Catacuzzeno et al., 2004) recently reported oscillations that do not involve IBK or ICa. To test for the involvement of IBK we applied the BK-specific blocker, iberiotoxin. Partial block of IBK via bath application of 100 nm iberiotoxin (Fig. 4E, blue traces) caused larger responses to low-frequency stimuli, and 20 mV oscillations in response to constant holding current, suggesting that IBK is involved in this cell's responses to sinusoidal and constant-current stimuli. The role of membrane currents in shaping the electrical properties of spiking, oscillating, and nonoscillating hair cells in our semi-intact preparation was further investigated in the voltage-clamp experiments described below (Figs. 5⇓–7; supplemental Figs. S2–S4, available at www.jneurosci.org as supplemental material).

Membrane currents vary between spiking and nonspiking hair cells. A, Mean responses to Vcmd steps from −70 to −30 mV for spiking (n = 10), oscillating (n = 4) and nonoscillating (n = 13) hair cells, leak subtracted (P/10 or P/20) with no series resistance compensation. B, Same cells as in A but for Vcmd steps from −70 to −120 mV. C, Scatter plot of steady-state current densities evoked by depolarizing versus hyperpolarizing steps in individual cells. In all but one spiking hair cell, the magnitude of the inward current density at Vcmd = −120 mV exceeded the outward current density at Vcmd = −30 mV. The opposite was true for nonoscillating hair cells, and oscillating hair cells were intermediate. For Vcmd = −120 mV, there was little overlap in the distributions of current densities between spiking and nonoscillating cells. D, Negative correlation between zero-current potential (Vrest) and inward current density at Vcmd = −120 mV. E, F, Amplitude (E) and frequency (F) of the largest spike, oscillation, or small fluctuation in each cell plotted versus current density at Vcmd = −30 mV. Pearson product-moment correlation coefficients (r) were 0.29 for E and −0.52 for F. G, Voltage-clamp data (thick black traces, top and bottom) from an oscillating hair cell were well fit (red traces, top and bottom) by the sum of four depolarization-activated currents (top traces: ICa, green; IBK,transient, light blue; IBK,steady, dark blue; IKV, yellow) or two hyperpolarization-activated currents (bottom traces: IK1, gray; Ih, purple). Note the small Ih and IK1 at Vcmd = −120 mV in this cell. H, same as G, for a spiking hair cell that had larger IK1 and smaller IBK,steady and IKV. I, Average fitted current densities (mean ± SEM) for spiking, oscillating, and nonoscillating hair cells (*p < 0.05; **p < 0.01).

Variability within the class of spiking hair cells. A–C, Voltage clamp (left), current–voltage relationships (middle), and current clamp samples from three different spiking hair cells. Voltage-clamp records are individual traces of net current without RC compensation or leak subtraction. From the holding potential of −70 mV, 50 ms steps were delivered in 10 mV increments in the range of −150 to +30 mV. Some traces were removed for clarity. Red traces are for Vcmd = −40 mV. After the capacitive transient crossed zero current (at ∼0.4 ms), the trace was divided into 0.5 ms windows (rainbow colored markers) for calculating the current–voltage relationships, which were corrected for series resistance errors based on the net current in each time window. Note the different x-axis scales for the current-clamp data. The red arrows denote the onset of a current step of +50 pA in A and +100 pA in B and C. A, In current clamp, a “phasic” (completely adapting) hair cell fired a train of large amplitude spikes at step onset and then stopped. In the current–voltage plot, note the small but persistent net inward current for potentials between −45 and −15 mV. B, Repetitively firing hair cell at low frequency. C, Repetitively firing hair cell at higher frequency (perforated-patch recording).
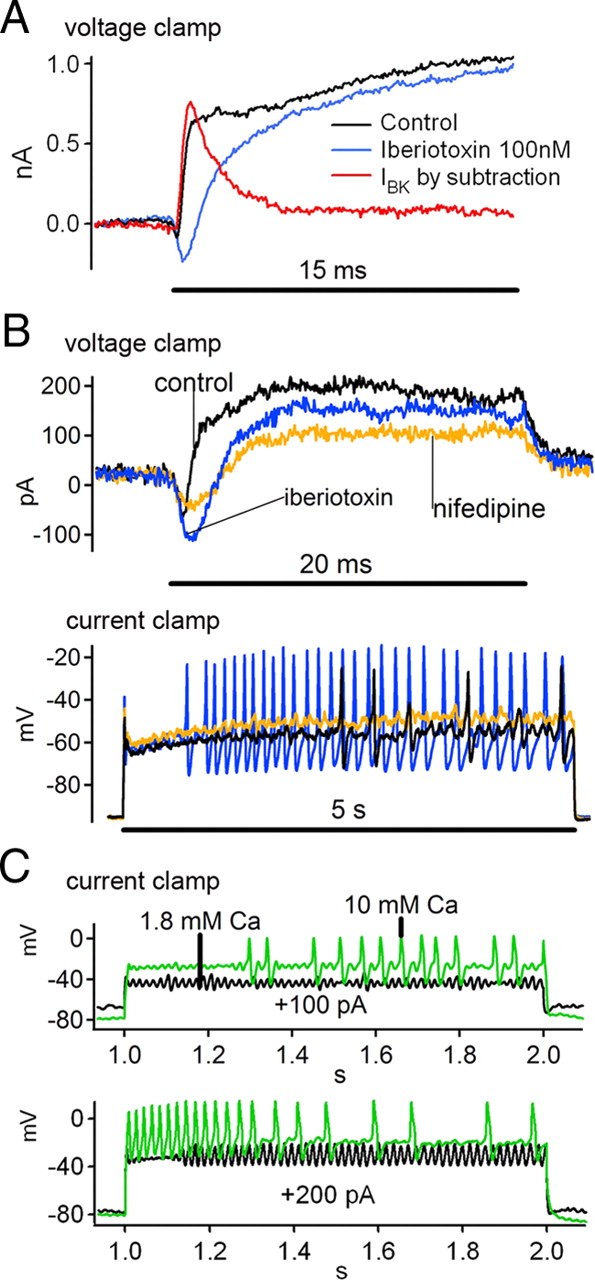
Influence of ICa and IBK on hair cell spikes in the frog sacculus. A, Leak-subtracted (P/10) voltage-clamp traces in response to depolarizing commands from −70 to −30 mV before (black) and after (blue) adding 100 nm iberiotoxin to the bath to partially block IBK. The blocked current was calculated by subtraction (red). Note the more obvious inward Ca2+ current after removing IBK by treatment with iberiotoxin. B, Top, Leak-subtracted (P/10) voltage-clamp traces for 20 ms steps to −30 mV for control (black), 100 nm iberiotoxin (blue), and 100 nm iberiotoxin + 50 μm nifedipine (yellow). Bottom, Current-clamp records for 5 s steps from 0 to +100 pA delivered to the cell in B under each pharmacological condition. Spikes were promoted by iberiotoxin, and then abolished by nifedipine. C, An oscillating hair cell in response to 1 s current clamp stimuli to +100 pA (top) and +200 pA (bottom) in normal (1.8 mm, black) or high (10 mm, green) extracellular Ca2+.
Hair cell heterogeneity and the underlying transmembrane currents
Voltage-clamp stimuli were used to assess the amplitudes of depolarization-activated and hyperpolarization-activated membrane currents present in spiking, oscillating, and nonoscillating hair cells. Spiking cells had smaller outward currents evoked by depolarization (Fig. 5A) and larger inward currents evoked by hyperpolarization (Fig. 5B) than nonspiking hair cells. The variability between individual hair cells can be seen in responses to families of voltage-clamp steps, I–V curves, and the corresponding current-clamp traces shown in supplemental Figures S2 and S3 (available at www.jneurosci.org as supplemental material). When the steady-state outward current density for a voltage command (Vcmd) to −30 mV was plotted against the steady-state inward current density for Vcmd = −120 mV, the spiking and nonoscillating cells segregated, with oscillators scattered in between (Fig. 5C). The zero-current potentials (Vrest) ranged from −45 to −93 mV and were correlated with the steady-state current density in response to hyperpolarization (Fig. 5D). Although they spanned the full range of zero-current potentials and hyperpolarization-activated current densities, on average spiking hair cells had greater hyperpolarization-activated current density (−73 ± 11 pA/pF; n = 10) than nonspiking cells (−32 ± 5.8 pA/pF; n = 17; p = 0.0019) and more negative zero-current potentials (−74 ± 3.4 mV) than nonspiking cells (−64 ± 1.9 mV; p = 0.010). Larger steady-state outward current density in response to depolarization (Vcmd = −30 mV) was associated with smaller voltage fluctuations (Fig. 5E) and higher frequencies (Fig. 5F) in current clamp, although the correlations were weak (see Fig. 5E,F legend).
Previous studies of dissociated (Hudspeth and Lewis, 1988a,b; Holt and Eatock, 1995; Catacuzzeno et al., 2003a,b, 2004) and nondissociated (Armstrong and Roberts, 1998, 2001) frog saccular hair cells have indicated the importance of six ionic currents for hair cell function. Four are activated by depolarization: ICa, IKV, IBK,steady, and IBK,transient. The other two currents are activated by hyperpolarization: IK1 and mixed potassium/sodium h-current (Ih). In addition, there have been conflicting reports regarding the presence of an appreciable A-type K+ current (Hudspeth and Lewis, 1988a; Holt and Eatock, 1995; Catacuzzeno et al., 2003b) and the small-conductance Ca2+-activated K+ (SK) current in frog saccular hair cells (Chabbert, 1997; Armstrong and Roberts, 1998, 2001). If present, the A-current would not be visible in our voltage-clamp recordings due to its voltage-dependent inactivation at the holding potential of −70 mV. The SK current was found in only some cells and was small compared with IBK or IKV. We therefore focused our analysis on the six aforementioned currents to ask whether any of them could be responsible for the differences between spiking, oscillating, and nonoscillating hair cells.
We separated ICa, IBK,transient, IBK,steady, IKV, IK1, and Ih by their known differences in activation kinetics and voltage dependence (Fig. 5G–I) (see Materials and Methods). We did not routinely attempt using channel blockers to characterize ionic currents because there was insufficient time to make the multiple solution changes needed for a full pharmacological separation of the currents in each cell before the recording degraded in quality. Instead, each hair cell was first characterized in current clamp before we rapidly acquired responses to a family of voltage-clamp steps to assess the ionic currents present. The responses to one depolarizing step (Vcmd = −30 mV) and one hyperpolarizing step (Vcmd = −120 mV) were sufficient to separate the six currents. The separation of ionic conductances was based on published models of ion channel kinetics in frog saccular hair cells, except for BK channel inactivation, which required modification of the published model to obtain good fits to our data (see Materials and Methods). The fitting procedure always converged to the same set of parameter values regardless of the seed values, indicating that the solution was well constrained. Nevertheless, we regard the fitted values as approximate.
Examples of the fits are shown for an oscillating hair cell (Fig. 5G) and a spiking hair cell (Fig. 5H). Separation of the depolarization-activated currents relied on the fact that for Vcmd = −30 mV, ICa activated very rapidly (τCa = 110 μs) compared with IKV and IBK (Armstrong and Roberts, 1998). IBK requires Ca2+ influx provided by ICa, ensuring a brief delay before IBK activation produced a net outward current, which occurred by t = 2 ms following a step to −30 mV. In most hair cells IBK partially inactivated, resulting in transient and steady components. IKV was the slowest outward current to activate (τKV >5 ms). An important check of the validity of the fitting procedure was that the mean ICa (407 ± 41 pA; mean ± SEM, n = 26) was similar to the value measured by pharmacological isolation in previous studies using the same semi-intact preparation [Armstrong and Roberts (1998): 363 ± 46 pA, n = 10; Rutherford and Roberts (2006): 335 ± 15 pA, n = 95]. IK1 and Ih were easily separated at Vcmd = −120 mV because of their thousandfold difference in activation time constants (1 ms vs 1000 ms). Most of the hair cells in our sample expressed all six of the currents, but in different amounts.
The main difference in the currents activated by depolarization was that spiking hair cells had smaller net outward current than nonspiking hair cells (Fig. 5A) because they had only about half as much IBK,steady and IKV (Fig. 5I). There were no significant differences in ICa or IBK,transient (Fig. 5I). Spiking hair cells had lower IKV current density (21.9 ± 4.9 pA/pF; n = 10) than oscillating hair cells (43.9 ± 5.9 pA/pF; n = 4; p = 0.023) or nonoscillating hair cells (49.5 ± 6.8 pA/pF; n = 12; p = 0.003), and lower IBK,steady current density (31.4 ± 8.5 pA/pF; n = 10) than nonoscillating hair cells (63.9 ± 7.1 pA/pF; n = 12; p = 0.008) or all nonspiking hair cells (67.4 ± 6.8; n = 16; p = 0.003). In addition to being smaller, IKV activated more slowly in spiking hair cells (τKV = 13.6 ± 2.0 ms, n = 9, one cell excluded because IKV was too small to measure τKV) than in nonspiking cells (τKV = 6.1 ± 0.3, n = 16; p = 0.004).
Although IBK,transient current densities did not differ significantly by cell type (Fig. 5I), IBK,transient was most prominent in spiking hair cells because they typically had smaller steady-state outward currents (Fig. 5A). In some spiking hair cells, inactivation of IBK,transient resulted in a net inward current 5 ms after a step to −40 mV (red traces in the left panels of Fig. 6A and supplemental Figs. S2A, S3A, available at www.jneurosci.org as supplemental material). In nonspiking hair cells, IBK,transient was a smaller fraction of the total outward current (Fig. 5A,G,I; supplemental Figs. S2B,C, S3B–D, available at www.jneurosci.org as supplemental material), and its inactivation did not result in net inward current.
IK1 was the predominant hyperpolarization-activated current in all three groups, and significantly larger in spiking hair cells (69.8 ± 10.6 pA/pF; n = 10) than in nonoscillating hair cells (22.7 ± 6.2 pA/pF; n = 12; p = 0.001) or all nonspiking hair cells (26.5 ± 6.4 pA/pF; n = 16; p = 0.003). We found no significant differences in Ih across groups. Thus the predominant determinant of the relationship between hyperpolarization-activated current density (in picoamperes per picofarad at Vcmd = −120 mV) and zero-current potential (Vrest) in Figure 5D appears to be IK1; hair cells with greater IK1 current density have a more negative resting potential and tend to be spiking hair cells.
Heterogeneity among spiking hair cells
Variability within the spiking phenotype was assessed by comparing voltage- and current-clamp data between cells (Fig. 6). Cells with similar currents evoked by hyperpolarization (IK1 and Ih) had different depolarization-activated currents and different spike patterns. The cell with the smallest fast outward current (IBK) (Fig. 6A, left, center) had the largest spike (75 mV) (Fig. 6A, right) and a low spike frequency (note the different timescales for current clamp in Fig. 6, right). The cell with the largest fast and steady outward currents (IBK + IKV) (Fig. 6C, left) had the smallest spike (39 mV) (Fig. 6C, right) and the highest repetitive firing frequency (67 Hz in response to +100 pA). As expected, the fast, large, and sustained outward current was associated with fast repolarization in current clamp, generating small spikes with a short duration required for a high firing rate (Fig. 6C, right). Also note the presence of unusually large initial net inward current apparent in the rainbow I–V plot (Fig. 6C, middle), to support rapid spike depolarization. The hair cell with the smallest steady outward current (IBK,steady + IKV) (Fig. 6B) had slow postspike repolarization, broad spikes, and a low firing rate (6 Hz in response to +40 pA).
Spikes are generated by Ca2+ influx through L-type channels and suppressed in hair cells that have large IBK
To test for the involvement of ICa and IBK in hair cell spikes, we recorded voltage-clamp and current-clamp data in normal extracellular saline, then added the BK-specific blocker iberiotoxin (100 nm) to the extracellular solution to reduce the amplitude of IBK, or nifedipine (50 μm) to reduce calcium influx through L-type channels. Because ICa tends to run down over several minutes in the ruptured-patch configuration, perforated patch was used in these experiments.
The current blocked by 100 nm iberiotoxin (e.g., Fig. 7A, red trace) had a transient component (peak amplitude = 413 ± 138 pA for voltage commands to −30 mV, n = 8) and a smaller sustained component. Some of these cells did not fire spikes in normal extracellular saline, but did after addition of iberiotoxin (see supplemental Fig. S4, available at www.jneurosci.org as supplemental material). The cell shown in Figure 7B fired spikes only sporadically under control conditions (current clamp, black trace). After addition of iberiotoxin (blue trace) the spikes became larger and much more frequent. On average, the maximum oscillation or spike amplitude in current clamp was increased significantly upon bath application of 100 nm iberiotoxin (22.2 ± 11.5 vs 25.7 ± 12.3 mV, n = 8, p = 0.034, one-tailed paired t test). The effect of iberiotoxin on frequency was more complex. Spiking hair cells tended to increase their firing rate, while oscillating cells began spiking at a lower frequency. On average, the frequency that corresponded to the maximum amplitude decreased with application of iberiotoxin (55.4 ± 14.9 vs 51.7 ± 19.7 Hz, n = 8, p = 0.43), but the difference was not significant. The effects of iberiotoxin on amplitude and frequency in current clamp experiments were in agreement with the general trends across all cells: as the outward current density at −30 mV decreased, the amplitude increased and the frequency decreased (Fig. 5E,F).
Bath application of 50 μm nifedipine reduced but did not completely block the initial inward current evoked by depolarization (Fig. 7B, yellow voltage-clamp trace), and abolished spiking in 3 out of 3 hair cells that fired spikes in normal extracellular saline. Nifedipine also blocked spikes induced by iberiotoxin (Fig. 7B, yellow current-clamp trace). These observations demonstrate that spikes in frog saccular hair cells require ICa through L-type channels. Conversely, augmenting the calcium current with high extracellular calcium promoted spikes. The cell shown in Figure 7C was converted from oscillating in normal (1.8 mm Ca2+) extracellular saline (black traces) to spiking in 10 mm Ca2+ (green traces).
Afferent neuronal innervation and postsynaptic sodium channel labeling in the saccular macula
Hair cells in the frog sacculus make synaptic connections onto postsynaptic boutons of afferent VIIIth nerve fibers, as shown in Figure 8. We reasoned that if ongoing spikes or large oscillations triggered neurotransmitter release from hair cells, the pattern of presynaptic voltage fluctuations should be reflected in recordings of EPSPs and perhaps action potentials from the afferent neurites in the semi-intact preparation. From the cell body (Fig. 8A, bottom right), each afferent neuron sends one myelinated axon centrally to the brainstem (data not shown) and another peripherally to the sensory epithelium (saccular macula) (Fig. 8A, top). Afferent axons shed their myelin as they cross the basement membrane a few μm below the synaptic layer and immediately branch into two or more nonmyelinated neurites, sometimes from a varicosity that could be seen in the furrowed living epithelium (Fig. 8D) and in fixed tissue that had not been furrowed (Fig. 8A, top inset). Nonmyelinated neurites make postsynaptic contacts with multiple hair cells (schematized in Fig. 8B). A monoclonal pan-voltage-gated sodium channel (NaV) antibody strongly labeled the first branch point (forked structures in Fig. 8E). We did not observe the diffuse NaV labeling on distal afferent neurites or at postsynaptic terminals that was seen in the mammalian cochlea using the same antibody (Hossain et al., 2005). A monoclonal neurofilament antibody (3A10) strongly labeled nonmyelinated neurites throughout the sensory epithelium (Fig. 8F), similar to the amphibian papilla of the frog (Keen and Hudspeth, 2006).

Innervation of the frog sacculus. A, Axons visualized by confocal microscopy after backfilling the anterior branch of the VIIIth cranial nerve with fluorescein–dextran. Afferent neuron somata (bottom right) that innervate the sacculus, utriculus, and the anterior and lateral semicircular canals can be seen proximal to the divergence of the saccular branch. The saccular macula (top center) glows with the diffuse fluorescence of many small axons. Most of the brightly stained (large-diameter) axons shed their myelin near the proximal margin of the macula, a few at the lateral and distal margins. Top inset, Small-diameter neurites make multiple synaptic contacts (bright spots) as they weave between hair cells (dark circles). Bottom inset, Numerous terminal and en passant boutons (green; fluorescein–dextran) contact each hair cell (red; FM1-43 stain). For electrical recordings from the semi-intact epithelium, the nerve was cut short (red line). B, Schematic shows placement of the recording electrode (blue) on a fine neuritic branch. C, DIC image of a furrowed epithelium shows a neurite (arrow) making a bouton contact (arrowhead) onto a hair cell (hc). D, At the level of the basement membrane, a myelinated axon (arrows) expands into an nonmyelinated varicosity (*). It then branches into slender nonmyelinated neurites (arrowheads) that extend into the synaptic layer above the basement membrane, becoming accessible to recording electrodes. To the top left is a damaged axon in which the varicosity has been disconnected from the myelinated segment. E, A monoclonal pan-NaV channel antibody (Rasband et al., 1999) labeled neurites near the basement membrane, often at the first branch point (entire macula shown above, enlargement below). Na channel clusters extended 2–5 μm into each branch (forked structures in bottom; red arrow points to a trifurcation). F, Neurofilament antibody (3A10) strongly labeled nonmyelinated neurites (entire macula shown above, enlargement below). Scale bars (in μm): A, 50 (right), 20 (top inset), 15 (bottom inset); B, 10; C, D, 5; E, F, 50 (top), 10 (bottom).
To determine whether spontaneous activity in hair cells could cause transmitter release, we made whole-cell recordings from postsynaptic afferent neurites, exercising care to preserve the delicate synapses in the semi-intact preparation. The recordings sites were located between postsynaptic boutons and the branch points containing the NaV labeling. One or more hair cell-afferent contact sites were often visible within 20 μm of the recording site (Fig. 8B,C) and additional unseen synaptic contacts may have been present. Furrowing the epithelium severed some neurite branches and disrupted some synapses. Some neurites had resting potentials near −70 mV, but many were more depolarized, possibly due to damage at the recording site, at the cut end of the myelinated axon, or in other branches of the neurite. We therefore applied a holding potential in voltage clamp, or holding current in current clamp, to bring the baseline membrane potential to near −80 mV. Amiloride (100 μm) was present in the bathing medium to block MET.
Intracellular recordings from postsynaptic afferent neurons
Approximately half (10/22) of the successful intracellular recordings (see Materials and Methods) showed vigorous synaptic activity. The remainder (12/22) had only irregular low-frequency synaptic events or no evidence of synaptic activity. Of the 10 recordings with vigorous synaptic activity, two had continuous highly periodic (∼5 Hz) bursts of EPSP events for the duration of the recording (60–300 s), four had intermittent bouts of periodic synaptic events at 25–70 Hz separated by longer silent periods, and four had complex patterns that in some cases appeared to consist of several uncoupled rhythms. This spontaneous periodic excitation in afferent neurites suggests that frog saccular hair cells are capable of periodic transmitter release in the same frequency range as their spontaneous spikes and oscillations.
Figure 9A presents voltage-clamp data from an afferent fiber with intermittent periodic synaptic activity. EPSC activity first appeared as unitary events (Fig. 9A, top trace) that then began to superimpose into small bursts. Subsequent EPSC bursts became larger and more periodic (Fig. 9A, bottom trace), sometimes eliciting action potentials, evident as action currents. The periodicity of this afferent activity over many cycles is demonstrated in supplemental Figure S1 (available at www.jneurosci.org as supplemental material).

Bursts of background synaptic activity in postsynaptic fibers are composed of brief individual events sensitive to CNQX. A, Two lines of continuous data acquired at the onset of periodic synaptic activity show discrete EPSC-events that superimpose into bursts. Large bursts triggered all-or-none action potentials (evident as action currents) in afferent neurites that escaped voltage clamp (Vcmd = −80 mV). B, Examples of subthreshold activity in current clamp (B1) and voltage clamp (B2). Each of the four traces shows one burst. C, EPSC bursts (C1) from a different cell were 75% blocked by adding 10 μm CNQX to the bath (C2). No action potentials occurred in B and C.
In other afferent fibers as well, bursts of EPSPs in current clamp (Fig. 9B1) and EPSCs in voltage clamp (Fig. 9B2,C) were usually composed of many superimposed events (Fig. 9B1,B2, bottom traces), but occasionally contained only a few widely spaced events (top traces). Individual events typically had submillisecond rise times, durations of ∼5 ms, and could vary tenfold in amplitude within a single burst (compare the largest and smallest of the five events in the top trace of Fig. 9B1). Bursts were separated by periods of inactivity that lasted for tens to hundreds of milliseconds. Figure 9C1 shows EPSCs from another cell, in which bath application of CNQX (10 μm) reduced the EPSC amplitude by >75% (Fig. 9C2), confirming their identity as glutamatergic EPSCs through AMPA-type receptors (Glowatzki and Fuchs, 2002; Holt et al., 2006; Keen and Hudspeth, 2006).
To look for the effects of hair cell K+ currents on EPSC properties, we replaced the normal artificial perilymph (2 mm K+) with high-K+ artificial perilymph (40 mm K+), which depolarizes hair cells by ∼30 mV (data not shown). TTX was present in the bath to block spikes in the afferent axon throughout this experiment. Before application of high K+ (Fig. 10A), EPSCs occurred in bursts that repeated at intervals of ∼150 ms, or integer multiples thereof. The periodicity of EPSC bursts despite frequent skipped fundamental intervals [Fig. 10A1 (bottom trace), A2] demonstrates that failures of synaptic vesicle exocytosis can occur while the periodicity of subsequent synaptic activity is preserved. Upon addition of high K+, periodic EPSC bursts disappeared and were replaced by a high-frequency barrage of irregularly timed EPSCs (Fig. 10B,C). This increase in EPSC rate (14 s−1 to 52 s−1, mean over 30 s) was accompanied by an increase in the size of EPSC events (Fig. 10D). A similar result was reported in the frog's amphibian papilla when hair cells were depolarized using a whole-cell pipette (Keen and Hudspeth, 2006). In contrast, depolarizing mouse cochlear inner hair cells with high K+ or current injection increased the rate but not the size of EPSCs (Glowatzki and Fuchs, 2002; Goutman and Glowatzki, 2007).

Periodic EPSC burst activity at rest is abolished in high K+. A1, EPSP bursts displayed on three different timescales, with 1 μm TTX in the bath to prevent spiking. Bursts were 10–35 ms in duration and contained a variable number of EPSC-events of variable amplitude (top trace). EPSCs were absent between bursts (middle trace). The intervals between bursts (bottom trace) were approximately integer multiples of 150 ms. A2, Autocorrelation (normalized log scale, y-axis) of EPSC-event times for the same cell showed preferred EPSC-event intervals (in milliseconds, x-axis). The large peak near 0 ms represents the short intervals within a burst. The broad peaks centered near 150 ms and multiples thereof represent the periodicity of successive bursts, despite skipped fundamental intervals. B, Data obtained later in the same recording, immediately before (black) and after (blue) a change of the extracellular medium from 2 to 40 mm K+. C, Histogram of intervals between EPSC-events before solution exchange (black) shows short intervals that correspond to closely spaced EPSC-events within each burst, and long intervals that correspond to the time between the last event in one burst and the first event in the next. After solution exchange (blue), the interval histogram showed an exponential distribution characteristic of a Poisson process. D, Bath depolarization with high K+ resulted in larger EPSC events compared with control. Data from 30 s in each condition. E, EPSC event times were measured at the peaks (red x's). Current amplitudes were measured as the difference from baseline (green x's) to peak.
Discussion
Frog saccular hair cells expressed a diverse range of spontaneous electrical activity. Half had small (<7 mV) steady-state membrane potential fluctuations, while the others produced all-or-none spikes or variable-amplitude sustained oscillations. Spikes and oscillations sometimes occurred without any applied current (Fig. 1), while other cells required small (25–100 pA) steady depolarizing current (Figs. 2, 3). In vivo, a depolarizing current of this magnitude (50–100 pA) is generated by the 15–20% activation of MET with the hair bundle in the resting position (Corey and Hudspeth, 1983; Shepherd and Corey, 1994). Thus, it is possible the oscillations and spikes we observed in response to small depolarizing holding currents represent resting behaviors of some frog saccular hair cells in vivo.
Spikes and oscillations occurred in a voltage range that evokes calcium-dependent exocytosis of neurotransmitter (Rutherford and Roberts, 2006), and thus could establish the background spike pattern in afferent neurons. To test this possibility, we recorded from neurites close to postsynaptic sites, and found periodic EPSCs that were sensitive to CNQX (Figs. 9, 10), indicating glutamatergic transmission involving AMPA receptors. Hair cells provide the only known source of glutamatergic input to afferent neurites. In some postsynaptic recordings EPSC bursts occurred with remarkable long-term periodicity that was not interrupted by missed cycles (Fig. 10A), suggesting that a presynaptic hair cell was generating a spontaneous periodic oscillation or repetitive spike train that evoked periodic transmitter release, with failures on some cycles. Transmission may be further enhanced at some frequencies by intrinsic frequency selectivity of synaptic exocytosis (Rutherford and Roberts, 2006). As expected for a voltage-dependent presynaptic mechanism, depolarization by high K+ increased the EPSC frequency and disrupted the timing (Fig. 10B,C). A tight association of afferent action potentials with bursts of excitatory synaptic input was seen in current-clamp recordings and under voltage clamp in cases where the spike generator escaped voltage control (Fig. 9A), indicating that neural spikes were triggered periodically in response to cycles of presynaptic depolarization. In vivo, some frog saccular afferent axons have a periodic spike pattern in the absence of a stimulus, and respond to weak vibratory stimuli by phase locking to the stimulus without an increase in spike rate (Koyama et al., 1982; Christensen-Dalsgaard and Narins, 1993). This can be explained by entrainment of spontaneous hair cell spikes or oscillations (Fig. 4).
The properties of nonspiking hair cells were consistent with their involvement in electrical tuning. We classified nonspiking hair cells as oscillating or nonoscillating depending on whether or not they generated large oscillations during steady holding currents, but both types showed frequency selectivity when a sinusoidal stimulus was applied (Fig. 4C–E). In oscillating hair cells, the peak sensitivity to sinusoidal current coincided with the oscillation frequency evoked by the holding current alone. If spontaneous oscillations occur in vivo, the faintest sounds would be encoded by modulation of the ongoing pattern rather than by the appearance of a signal upon an otherwise stable resting potential.
Oscillation frequencies were within the range of best frequencies for saccular afferents in this species (20–70 Hz) (Christensen-Dalsgaard and Narins, 1993), which coincides with the power spectrum of seismic waves in response to impulsive stimuli such as footsteps (Lewis and Narins, 1985; Lewis et al., 2001). In most oscillating hair cells, frequency increased with holding current up to a plateau at 40–70 Hz (Fig. 5F). The peak-power frequency of nonoscillating hair cells also increased with holding current, and extended to somewhat higher frequencies (Fig. 5F). In vivo, frequency selectivity in these nonspiking hair cells is therefore expected to vary with steady-state activation of MET channels and other factors, such as efferent inhibition.
Spiking hair cells fired at up to 66 Hz in response to sustained holding currents (Figs. 3B, 6C), and responded to sinusoidal inputs in the low-frequency range of saccular sensitivity (Fig. 4A,B). They were found throughout the macula but were concentrated in the outer 3 hair cell rows, where cells are predominantly tall and thin (Chabbert, 1997), express both calretinin (Edmonds et al., 2000) (supplemental Fig. S5A, available at www.jneurosci.org as supplemental material) and parvalbumin 3 (Heller et al., 2002), and have long kinocilia (Díaz et al., 1995). Most spiking cells in the outer three rows sustained repetitive firing at a rate that varied with the holding current (Figs. 2A,B, 3B), suggesting that they respond to very-low-frequency stimuli, possibly including steady-state hair bundle deflection associated with head orientation with respect to gravity. Most spiking cells in the central zone fired rapidly adapting spike trains (Fig. 6A). These cells also had a tall-thin morphology, which may correspond to the central flask-shaped hair cells (Chabbert, 1997). Central flask-shaped hair cells express calretinin (Edmonds et al., 2000) while other hair cells in the central region do not (Heller et al., 2002). Future experiments are needed to investigate the relationships between hair cell physiology, morphology, and calcium buffer expression.
Spiking and nonspiking hair cells appear to have a similar complement of ion channels, but in different ratios. We did not find a larger ICa in spiking hair cells (Fig. 5I), but they did have smaller outward currents (IBK,steady and IKV) that oppose depolarization. Spiking can be induced in nonspiking hair cells by increasing ICa (Fig. 7C) or promoted in reluctantly spiking hair cells by blocking IBK (Fig. 7B) [see also Catacuzzeno et al. (2003b) and Jørgensen and Kroese (2005)]. In addition, the large inward rectifier current (IK1) in spiking hair cells may provide positive feedback that contributes to spiking (Goodman and Art, 1996b).
Our results from the semi-intact preparation differed substantially from previous studies of isolated hair cells (Hudspeth and Lewis, 1988a; Holt and Eatock, 1995; Chabbert, 1997; Catacuzzeno et al., 2003a,b, 2004; Jørgensen and Kroese, 2005). Dissociation with papain has been shown to remove BK channel inactivation, abolish IKV, shift the voltage dependence of Ca2+ channel activation, and increase the frequency and sharpness of electrical tuning in the frog sacculus (Armstrong and Roberts 1998, 2001; Catacuzzeno et al., 2003a), although it does not have this effect in hair cells from the turtle cochlea (Goodman and Art, 1996a). Isolation using bacterial protease VIII preserves IBK,transient and IKV (Catacuzzeno et al., 2003a), but not the spikes and oscillations we observed in current clamp. Spikes occur in the excised frog sacculus (Hudspeth and Corey, 1977; Ashmore, 1983; Armstrong and Roberts, 1998) but not in isolated cells. Spikes are dependent on Ca2+ current through L-type channels (Fig. 7B), which decays in amplitude over the duration of an experiment (data not shown). It is possible that, in addition to direct effects of enzymes on ion channels, the time and handling involved in cell isolation procedures contributes to abolishing spikes. Voltage oscillations and “instabilities” have been reported in hair cells dissociated using bacterial protease VIII (Catacuzzeno et al., 2004) or XXIV (Jørgensen and Kroese, 2005), but these occur at hyperpolarized membrane potentials (−60 to −90 mV) and are not expected to evoke release of neurotransmitter.
Experiments with intact preparations are needed to understand how basolateral voltage spikes and oscillations may be interconnected with hair bundle mechanics in vivo. Hair cells possess a feedback mechanism by which changes in membrane potential cause forces to be exerted on the hair bundle. In a frog saccular preparation similar to ours but with MET intact, spontaneous mechanical oscillations of the hair bundle with peak frequencies in the range of 19–46 Hz were observed in some hair cells (Ramunno-Johnson et al., 2009). Given the reported efficiency of reverse transduction (up to 600 pm/mV) (Denk and Webb, 1992), the 50 mV spikes we observed could cause a 30 nm movement of the hair bundle, sufficient to elicit a large MET current, which is 90% saturated by a bundle deflection of only 50–120 nm (Hudspeth, 1989). Thus, spikes and voltage oscillations may drive hair bundle oscillations via reverse transduction, potentially exerting forces on the overlying otolithic membrane in vivo. The presence of sensitive bidirectional feedback in vivo presents difficulties for interpreting experimental results from reduced preparations (Lewis, 1988).
The spontaneous electrical and mechanical oscillatory behavior of hair cells may represent the behavior of a high-gain amplifier that operates close to a transition between stability and instability (Eguíluz et al., 2000; Hudspeth et al., 2000; Ospeck et al., 2001). In vivo, adaptation of MET or other feedback processes may hold the cell near the transition point (Hopf bifurcation), where amplification is greatest. This interpretation is consistent with our finding that small changes in holding current can cause some hair cells to undergo a transition from stability to oscillatory or spiking activity. We hypothesize that this resulting periodic hair cell activity triggers periodic calcium-dependent neurotransmitter release that determines the timing of background (i.e., spontaneous) spike activity in some frog saccular afferent axons.
Footnotes
- Received April 14, 2009.
- Revision received June 25, 2009.
- Accepted July 6, 2009.
-
This work was supported by National Institutes of Health Grant R01 NS27142 to W.M.R. We thank Shawn Lockery and the Institute of Neuroscience Cellular Physiology discussion group for comments on figures and Mike Wehr for comments on this manuscript.
- Correspondence should be addressed to Dr. William M. Roberts, Institute of Neuroscience, 1254, University of Oregon, Eugene, OR 97403. billr{at}uoregon.edu
- Copyright © 2009 Society for Neuroscience 0270-6474/09/2910025-13$15.00/0