
Abstract
Imaging studies show that Parkinson's disease (PD) alters the activity of motor- and cognition-related metabolic brain networks. However, it is not known whether the network changes appear at or before symptom onset. In this study, we examined 15 hemiparkinsonian patients who underwent serial metabolic imaging with [18F]-fluorodeoxyglucose (FDG) PET at baseline and again 2.1 ± 0.6 (mean ± SD) and 3.9 ± 0.7 years later. We assessed longitudinal changes in network activity in each cerebral hemisphere, focusing specifically on the “presymptomatic” hemisphere—ipsilateral to the initially involved body side. At the network level, the activity of the PD motor-related pattern (PDRP) increased symmetrically in both hemispheres over time (p < 0.001), with significant bilateral elevations at each of the three time points. Hemispheric expression of the PD cognition-related pattern likewise increased symmetrically (p < 0.001), although significant elevations were not evident on either side until 4 years. At the regional level, putamen metabolism contralateral to the initially affected body side was elevated at all three time points, without longitudinal change. In contrast, in the initially presymptomatic hemisphere, putamen metabolic activity increased steadily over time, reaching abnormal levels only at 4 years. Metabolic activity in the contralateral precuneus fell to subnormal levels by the final time point. These findings suggest that abnormal PDRP activity antecedes the appearance of motor signs by ∼2 years. The timing and laterality of symptom onset relates to focal asymmetric metabolic changes at the putamenal node of this network.
Introduction
The study of neurodegenerative processes in human subjects has generally been limited to individuals with demonstrable disease manifestations. Yet in the interest of assessing potential disease-modifying therapies, especially those designed to retard clinical onset, it is crucial to understand the progressive changes in brain function that occur in the prodromal period during which there are no overt signs and symptoms of disease. This information is also critical for distinguishing the neurological changes that underlie the appearance of symptoms from those that develop preclinically in the latent phases of the disease.
Although asymptomatic carriers of neurodegenerative disease mutations can provide meaningful information concerning such latent effects of the disease process, as demonstrated by numerous functional imaging studies (e.g., Buhmann et al., 2005; Feigin et al., 2007b; Mosconi et al., 2007; Carbon and Eidelberg, 2009), such findings are not necessarily generalizable to the majority of affected individuals who bear no genotypic abnormality. Classical Parkinson's disease (PD) is unusual in that it lends itself to an alternative strategy to study the brain changes that take place before symptom onset: at clinical presentation, the motor manifestations of PD are typically restricted to one side of the body (Hughes et al., 1992), a condition known as hemiparkinsonism. In the context of PD, the cerebral hemisphere ipsilateral to the initially affected limbs can be considered “presymptomatic”—at least until symptoms appear on the opposite body side, which usually occurs within 3 years of clinical onset (Pourfar et al., 2007). The gradual appearance of motor symptoms on the initially unaffected body side allows for the monitoring of concurrent changes in brain function in each hemisphere, over time, by metabolic imaging. The pattern of alterations in resting state metabolic activity in the initially presymptomatic hemisphere is particularly relevant in defining the functional changes associated with the emergence of motor symptoms.
The metabolic images from each hemisphere can also provide unique information concerning the development of disease-related changes at the network level. PD is characterized by the expression of two distinctive spatial covariance patterns associated with the motor and cognitive manifestations of the illness (PDRP and PDCP, respectively) (see Eidelberg, 2009 for review). We have documented discrete longitudinal changes in the expression of these metabolic networks in early PD for the brain as a whole (Huang et al., 2007). We did not, however, investigate the lateralized hemispheric effects that are likely to be present before and during symptom onset.
In the current study, we used a novel hemisphere-by-hemisphere approach to determine whether the network abnormalities described previously in association with established symptoms are also present preclinically on the side ipsilateral to the initially involved limbs. To this end, we separately quantified the expression of the motor- and cognition-related metabolic networks on a hemispheric basis in hemiparkinsonian subjects undergoing serial metabolic imaging at baseline and again after ∼2 and 4 years follow-up. In addition to clinical assessments, the subjects also underwent [18F]-fluoropropyl-βCIT (FPCIT) PET to quantify hemispheric changes in dopamine transporter (DAT) binding over time. The results were used to identify the functional changes leading to symptom onset and their association with the progressive loss of nigrostriatal dopaminergic projections.
Materials and Methods
Subjects
We studied 15 right-handed subjects (11 men and 4 women; age: 58.0 ± 10.2 years, mean ± SD) with hemiparkinsonism at baseline (Hoehn and Yahr 1–1.5; off-state Unified Parkinson's Disease Rating Scale (UPDRS) motor ratings 9.0 ± 4.5). We defined hemiparkinsonism as the presence of unilateral symptoms of PD. Motor manifestations were limited to the symptomatic body side; UPDRS motor ratings were either 0 or 1 for each of the limbs on the opposite body side. The PD diagnosis was made according to the UK Brain Bank criteria (Hughes et al., 1992). Nine participants had right hemiparkinsonism; the remaining six had left hemiparkinsonism. No subject had a history of known causative factors such as encephalitis or neuroleptic treatment, nor did they have dementia, supranuclear gaze abnormalities, or ataxia. In each PD subject, presynaptic nigrostriatal dopaminergic dysfunction (i.e., reduced binding) was evident on review of the individual FPCIT PET images (cf. Dhawan and Eidelberg, 2006). All patients were within 2 years of diagnosis at the time of enrollment.
All 15 hemiparkinsonian subjects underwent clinical assessment and PET imaging at baseline and at a follow-up visit (mean interval 2.1 ± 0.6 years), at which all had become bilaterally symptomatic (Hoehn and Yahr stage: 2–2.5; motor UPDRS: 14.8 ± 4.3). Ten of the patients underwent further evaluations at a third time point (mean interval 3.9 ± 0.7 years), at which motor ratings had further deteriorated (17.8 ± 4.6). At baseline, eight subjects were drug-naive; the remaining seven subjects were chronically treated with levodopa monotherapy (n = 1), levodopa in combination with selegiline and/or dopamine agonists (n = 3), or monotherapy with either selegiline (n = 1) or dopamine agonists (n = 2). By the second time point, seven of the eight initially unmedicated patients were treated with either levodopa (n = 3) or dopamine agonists (n = 4). By the third time point, all patients were treated with levodopa singly or in combination with a dopamine agonist. The mean left/right striatal DAT binding and regional/network metabolism data for the whole brain (i.e., averaged over the two hemispheres) of these subjects have been reported previously (Huang et al., 2007). There has been no prior report of the progression data for each hemisphere or of the relationship of these changes to the timing of symptom onset.
Positron emission tomography
At each of the three time points (baseline, 2, and 4 years), subjects were scanned with FDG and FPCIT PET in separate imaging sessions to quantify caudate/putamen DAT binding as well as regional and network-related measures of glucose metabolism. The subjects fasted overnight and were off antiparkinsonian medications for at least 12 h before imaging. UPDRS motor ratings were obtained for each subject immediately before imaging. PET imaging was performed in 3-D mode using a GE Advance tomograph (General Electric) (Asanuma et al., 2006; Huang et al., 2007). Ethical permission for these procedures was obtained from the Institutional Review Board of North Shore University Hospital. Written consent was obtained from each subject following detailed explanation of the procedures.
Data analysis
Hemispheric changes in metabolic activity.
Regional and global rates of glucose metabolism were computed on a voxel basis for each FDG PET scan using a single arterial sampling method (Huang et al., 2007). The metabolic images were processed using SPM (Wellcome Department of Cognitive Neurology, University College, London) running on Matlab 6.0 (MathWorks). Scans from each subject were realigned to the baseline image, spatially normalized to a Talairach-based FDG PET template, and then smoothed using a Gaussian kernel at FWHM = 10 mm.
Scans from the PD patients with left hemiparkinsonism were flipped so that all hemispheres contralateral to the clinically more affected limbs appeared on the left. Each scan was then split in half using ScanVP software so as to create separate contralateral and ipsilateral hemiscans. We quantified the expression of the motor- and cognition-related PD covariance patterns (PDRP and PDCP, respectively) (Hirano et al., 2008; Eidelberg, 2009) separately for each PD patient at each time point on a hemispheric basis (i.e., on FDG hemiscans) using a fully automated voxel-based algorithm (Spetsieris et al., 2006; 2009; Ma et al., 2007, software available at http://www.fil.ion.ucl.ac.uk/spm/ext/#SSM). These computations were performed blind to subject, hemisphere (contralateral, ipsilateral), time point (baseline, 2, or 4 years), baseline treatment status (drug naive or initially treated), or clinical severity (UPDRS motor rating). Network computations were also performed on a hemispheric basis on FDG PET scans from 15 age-matched, right-handed healthy volunteer subjects (8 men and 7 women; age 56.7 ± 12.3 years). These control scans were conducted during the same time period as the patient scans, using the same PET system. In the controls, PDRP and PDCP scores for the left and right hemispheres were averaged for comparison with hemispheric values from the PD patients. For each network, subject scores for the entire cohort (PD patients and healthy controls) were z-transformed and offset so that the control mean was zero.
We hypothesized that hemispheric differences in metabolic activity, if they were to be found, would be more likely to occur in regions known to be abnormal in PD. Therefore, to evaluate metabolic differences between the hemispheres at the regional level, we conducted a whole brain voxelwise search. We used a mask to identify regions within a network previously found to be metabolically abnormal in PD, i.e., the basal ganglia, thalamus, pons, cerebellum, and motor, premotor, anterior cingulate, prefrontal, and posterior parietal cortical regions (Asanuma et al., 2006). Within this prespecified hypothesis testing space, voxels on the contralateral and ipsilateral sides were compared at each time point with the “paired t test” option in SPM. Contrasts were defined binarily as “1 −1” and “−1 1” to assess respective increases and decreases in regional metabolism in the contralateral relative to the ipsilateral side at each time point. Because any metabolic changes within this space are occurring within the network of regions disrupted in PD, they are not considered to be independent of each other. They were therefore considered significant at p < 0.001, uncorrected for multiple regional comparisons. Moreover, metabolic changes in regions outside this space were viewed as hypothesis generating and were considered significant only if they survived an additional correction for multiple comparisons at p < 0.05. Coordinates were reported in the standard anatomical space developed at the Montreal Neurological Institute. The localization of each reported cluster was confirmed using the Talairach space utility (available at http://www.ihb.spb.ru/∼pet_lab/TSU/TSUMain.html).
For each asymmetrical region detected with SPM, we performed a post hoc analysis in which we measured metabolic activity within a sphere (radius = 4 mm) centered on the peak voxel of each of the significant clusters. Ipsilateral and contralateral volumes of interest (VOIs) values were ratio-normalized by the global metabolic rate of each hemiscan. We also measured longitudinal changes in each of these hemispheric regions. In each region identified in the baseline SPM analysis, metabolic activity was quantified prospectively within the same VOIs of the scans at the two follow-up time points. In regions with significant hemispheric differences at the second time point, metabolic activity was quantified within the same VOIs in the hemiscans at baseline and the third time point. In regions with significant hemispheric differences at the third time point, we quantified metabolic activity retrospectively within the same VOIs of the baseline and second time point scans.
Hemispheric changes in DAT binding.
In the baseline FPCIT PET images, standardized regions of interest (ROIs) were placed on the caudate, putamen, and occipital cortex of the hemispheres contralateral and ipsilateral to the affected limbs. The scans of each subject were realigned to the baseline scan such that identical ROI templates were applied to the analysis of the baseline scans as well as to the 2 and 4 year scans (Huang et al., 2007). At each time point, we estimated caudate and putamen DAT binding separately for each hemisphere by the striatal-to-occipital ratio (SOR), defined as (striatum − occipital)/occipital counts in a single 10 min frame, beginning 90 min after tracer injection (Ma et al., 2002). Caudate and putamen SOR values were computed in the FPCIT PET scans of 10 age-matched, right-handed healthy volunteers (4 men and 6 women; age 60.0 ± 9.9 years). Right and left caudate–putamen DAT binding values for the normal subjects were averaged for comparison with the corresponding PD values.
Statistical analysis
At each time point, we compared limb UPDRS motor ratings between the two body sides, as well as differences in caudate/putamen DAT binding, PDRP/PDCP expression and regional metabolism between hemispheres using paired Student's t tests. At each time point, we also compared caudate/putamen DAT binding, PDRP/PDCP scores, and regional metabolism for the contralateral and ipsilateral hemispheres of the PD patients with the left-right average of the hemispheric values of the healthy control subjects using two-tailed, two-sample Student's t tests. Longitudinal changes in the UPDRS motor ratings of the two body sides, as well as caudate/putamen DAT binding, PDRP/PDCP activity, and regional metabolism of the two hemispheres were assessed separately using two-way repeated-measure ANOVA (RMANOVA), in which time (i.e., time points 1, 2, and 3) and limb/hemisphere were both included as within-subject repeated variables. Post hoc comparisons with Bonferroni correction were performed between time points (e.g., 2–1, 3–2, 3–1) on the data of each limb/hemisphere when there was a significant time × limb/hemisphere interaction, and on the pooled data from both limbs/hemispheres given a nonsignificant time × limb/hemisphere interaction.
For each RMANOVA, a mixed model was performed using PROC MIXED procedure in SAS 9.1 (SAS Institute), which allowed for the analysis of three time point data from the entire cohort, including the five subjects with missing data at the third time point (Little and Rubin, 2002). To compute the average rate of change in caudate/putamen DAT binding in each hemisphere, we divided the difference in binding values between baseline and the final time point for each subject; the mean rate of change was then calculated for the whole group. In addition, for each time point, we calculated Pearson's correlation coefficients to correlate measures of metabolic activity (PDRP/PDCP values; normalized metabolism in significant brain regions) with caudate/putamen DAT binding values and limb UPDRS motor ratings using data from both hemispheres. In this study, the results shown in the tables and figures reflect data acquired from all subjects at each of the three time points. Statistical analyses were performed using SAS 9.1 (SAS Institute), and the significance level was set at p < 0.05.
Results
Limb ratings and hemispheric striatal DAT binding
Off-state UPDRS motor ratings were higher on the affected than on the initially unaffected body side at all three time points (p < 0.01, paired t tests). Motor ratings (Fig. 1) increased bilaterally over time (p < 0.001) at similar rates for both body sides (limb × time interaction: p = 0.37, two-way RMANOVA). These increases were significant with respect to baseline on both body sides at 2 years (p < 0.005) and 4 years (p < 0.0001; post hoc Bonferroni tests).
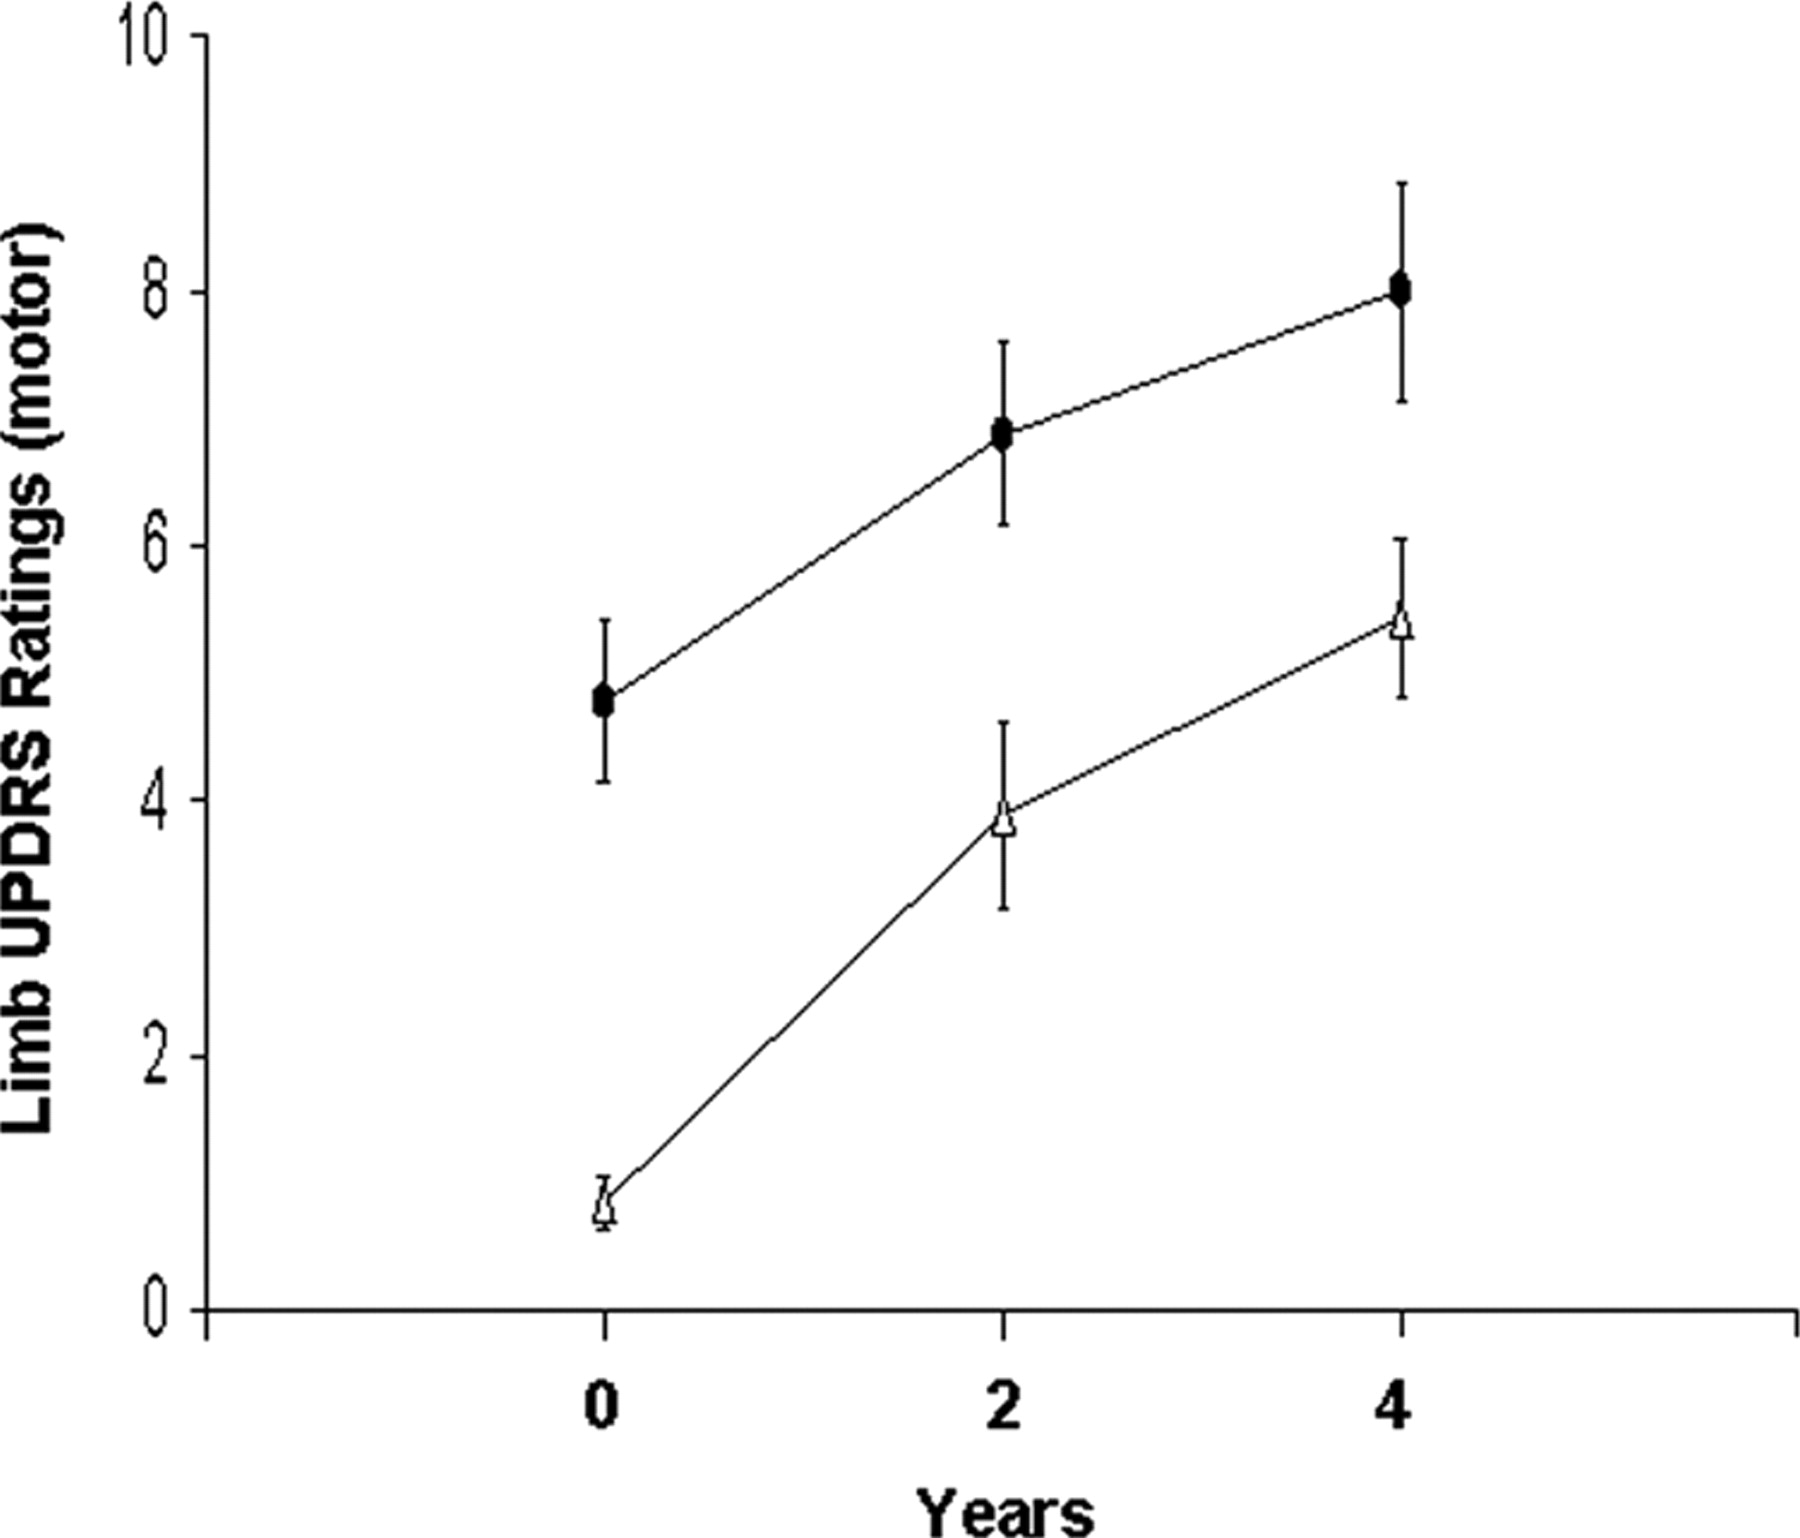
Time course of limb UPDRS motor ratings. Off-state UPDRS motor ratings increased over time (p < 0.001) at a similar rate for the initially affected (circles) and presymptomatic (triangles) body sides. The error bars represent one SEM at each time point.
Caudate and putamen DAT binding values for the two hemispheres are presented in Table 1. At all three time points, DAT binding for the striatum contralateral to the more affected limbs was lower than ipsilateral values for both caudate (p < 0.01, paired t tests) and putamen (p < 0.05). At baseline, caudate DAT binding did not differ from control values in either hemisphere (91.6 and 102.9% of the normal mean for the contralateral and ipsilateral hemispheres, p > 0.37) (Fig. 2A). Over time, caudate DAT binding declined in parallel for the two hemispheres, with a significant main effect of time (p < 0.01, two-way RMANOVA) and a nonsignificant hemisphere × time interaction (p = 0.52). Post hoc tests revealed significant reductions in caudate binding relative to baseline in both hemispheres at 4 years (p < 0.01). The average rate of decline in caudate DAT binding was 4.34% and 4.31% of the normal mean per year for the contralateral and ipsilateral hemispheres, respectively. At the third time point, caudate binding was lower than control values in both contralateral (p < 0.01) and ipsilateral (p < 0.05) hemispheres.
DAT binding in the contralateral and ipsilateral striatum at baseline and at 2 and 4 years

Time course of hemispheric DAT binding. A, DAT binding values in the caudate were lower (p < 0.01) in the hemisphere (circles) contralateral to the clinically more affected limbs compared to the ipsilateral side (triangles) at baseline and at 2 and 4 years. Over time, caudate binding declined (p < 0.01) at similar rates for the two hemispheres. B, Putamen DAT binding values were lower (p < 0.05) in the contralateral hemisphere (circles) compared to the ipsilateral side (triangles) at each of the three time points. Over time, putamen binding declined at different rates (p < 0.005) for the two hemispheres, with a faster rate on the ipsilateral hemisphere relative to the contralateral side. Binding values in each hemisphere and each region are represented as percentage of the normal mean (100%, broken line) at each time point. Dotted lines represent one SEM above and below the normal mean for each region. *p < 0.05, **p < 0.01, ***p < 0.001, Student's t tests compared to normal controls.
In contrast, putamen binding values for the PD patients at baseline were lower than controls in both contralateral (41.1% of the normal mean, p < 0.001) and ipsilateral (68.5% of the normal mean, p < 0.01) hemispheres (Fig. 2B). Longitudinal changes in putamen DAT binding differed for the two hemispheres, as indicated by a significant hemisphere × time interaction effect (p < 0.005; two-way RMANOVA). Post hoc tests were performed separately on the two hemispheres. Relative to baseline, significant declines in ipsilateral putamen DAT binding were evident at both 2 years (p < 0.01) and 4 years (p < 0.001), corresponding to an average progression rate of 4.11% of the normal mean per year. In the contralateral hemisphere, declines in putamen binding relative to baseline were also significant at 2 (p < 0.05) and 4 years (p < 0.005), but at the slower rate of 1.63% of the normal mean per year.
Longitudinal changes in hemispheric network activity
PDRP expression in both hemispheres (Fig. 3A) was elevated in the PD patients relative to healthy controls at baseline (p < 0.05) and at each of the subsequent time points (p < 0.001). In contrast, hemispheric PDCP expression did not differ from control values at either of the first two time points (p > 0.48), but the activity of this network reached supernormal levels in both hemispheres (p < 0.01) at the final time point (Fig. 3B). There was no interhemispheric difference in PDRP or PDCP expression at any of the three time points (PDRP: p > 0.22; PDCP: p > 0.45, paired Student's t tests). The activity of both networks increased in parallel in both hemispheres over the three time points (main effect of time: PDRP: p < 0.001; PDCP: p < 0.005, two-way RMANOVA), with nonsignificant hemisphere × time interactions (PDRP: p = 0.80; PDCP: p = 0.79). PDRP expression in both hemispheres showed a trend toward increase at 2 years (p = 0.10, relative to baseline) as well as a significant increase at 4 years (p < 0.001). Hemispheric PDCP expression did not change between baseline and the second time point (p = 0.73), but exhibited a significant increase at the third time point (p < 0.005, relative to baseline).

Time course of hemispheric PD-related network activity. Subject expression of the PD-related motor (A, PDRP) and cognitive (B, PDCP) spatial covariance patterns in the contralateral (circles) and ipsilateral (triangles) hemispheres at baseline and at 2 and 4 years. For both metabolic networks, hemispheric activity was symmetric at each time point. For PDRP, pattern expression in the PD patients was elevated (p < 0.05) in both hemispheres relative to controls at each time point. In contrast, PDCP expression reached abnormally elevated levels (p < 0.01) in both hemispheres only at the third time point. For both sides, the activity of each network increased in parallel over time. Scores for each network were computed for each hemisphere and time point and displayed relative to the mean value (broken line) of 15 age-matched healthy subjects. Dotted lines represent one SEM above and below the normal mean for each pattern. *p < 0.05, **p < 0.01, ***p < 0.001, Student's t tests compared to normal controls.
Longitudinal changes in hemispheric regional metabolism
To assess hemispheric differences in metabolic activity at the regional level, we compared the contralateral and ipsilateral hemiscans at each of the three time points on a voxel-by-voxel basis. Global rates of glucose metabolism did not differ significantly between hemispheres at any of the three time points (contralateral: 4.89 ± 1.07, 4.68 ± 0.85, and 4.29 ± 1.07 mg/min/100 g; ipsilateral: 4.96 ± 0.98, 4.75 ± 0.77, and 4.37 ± 1.16 mg/min/100 g at baseline, 2 years, and 4 years, respectively; p > 0.10, paired Student's t tests). Global metabolic rates did not differ from normal in either of the two hemispheres (contralateral: p > 0.22; ipsilateral: p > 0.32; normal left-right average: 4.80 ± 0.94 mg/min/100 g).
Regions exhibiting significant hemispheric differences at each time point are presented in Table 2. At baseline, relative increases in contralateral hemisphere metabolic activity (p < 0.001, uncorrected) were evident in the putamen (Fig. 4A, left) and in the anterior cingulate cortex (Fig. 4B, left). Interhemispheric differences in these regions were not significant at 2 and 4 years. In the putamen, longitudinal changes in metabolic activity differed across the two hemispheres, as indicated by a significant hemisphere × time interaction effect (p < 0.01, two-way RMANOVA), although these changes did not reach significance on either side (p > 0.07, post hoc tests). In the contralateral hemisphere, putamen metabolic activity was above normal (p < 0.05) at all three time points. In contrast, metabolic activity on the ipsilateral side reached abnormal levels (p < 0.05) only at the final time point, with steady increases in mean values over time (Fig. 4A, right). At baseline, measures of putamen metabolic activity for the two hemispheres correlated (Table 3, top) with limb UPDRS motor ratings (r = 0.40, p < 0.05) and with putamen DAT binding (r = −0.45, p < 0.05) (Fig. 5A). There was also a significant correlation between UPDRS motor ratings and putamen DAT binding (r = −0.49, p < 0.05). At 2 years, the correlations between putamen metabolism and limb UPDRS motor ratings, and between putamen DAT binding and UPDRS motor ratings no longer reached significance, but that between putamen metabolism and DAT binding remained significant (r = −0.46, p < 0.05). At 4 years, no significant correlations were present between these measures (p > 0.12). Moreover, the putamenal measures did not correlate with hemispheric PDRP or PDCP expression at any of the three time points (p > 0.11).
Regions with significant differences in hemispheric glucose metabolism at baseline and at 2 and 4 years

Time course of hemispheric differences in regional metabolism. A, B, At baseline, voxelwise searches revealed hemispheric differences in glucose metabolism in the putamen (A, left) and in the anterior cingulate cortex (B, left), with relatively higher metabolism in the contralateral hemisphere compared to the ipsilateral side. Regional metabolism in these regions, however, did not show significant hemispheric differences at 2 and 4 years. In the putamen (A, right), metabolic activity in the contralateral hemisphere (black bars) remained above normal (p < 0.05) at all three time points, while metabolism on the ipsilateral side (white bars) progressively increased, reaching abnormal levels (p < 0.05) only at the third time point. In the cingulate cortex (B, right), contralateral metabolism was elevated at baseline and 2 years (p < 0.05), while ipsilateral metabolism did not differ from normal at all three time points (p > 0.11). C, At 2 years, hemispheric differences in regional metabolism were present in the SMA (left), with relatively higher metabolism in the contralateral hemisphere compared to the ipsilateral side. Hemispheric differences were not significant at baseline and 4 years. Metabolic activity in this region (right) did not differ significantly from normal on either side at any time point (p > 0.16). D, At 4 years, hemispheric differences in metabolism were present in the precuneus (left), with relatively lower metabolic activity in the contralateral hemisphere compared to the ipsilateral side. Hemispheric differences were not significant at baseline and 2 years. In this region, metabolic activity significantly declined in both hemispheres over time (p < 0.05), however, metabolic reductions became abnormal (p < 0.05) only in the contralateral hemisphere at the third time point (right). Relative metabolic increases are displayed in a red–yellow scale and metabolic decreases in a blue–green scale. SPM {t} maps are superimposed on a single-subject MRI brain template and thresholded at t = 2.62, p = 0.01 (peak voxel, uncorrected) within a prespecified hypothesis-testing mask (see Materials and Methods). The hemisphere contralateral to the initially affected body side is displayed on the left. The coordinates refer to the Montreal Neurological Institute standard space. In the bar graphs, the y-axis represents globally adjusted metabolic activity for each region; the normal mean is indicated by the position of the x-axis. The error bars on the right of the x-axis represent one SEM above and below the normal mean for each region. *p < 0.05, **p < 0.01, ***p < 0.001, Student's t tests compared to normal controls.
Clinical/imaging correlations at each time point

Correlations between regional metabolism and other imaging measures. A, At baseline, putamen DAT binding values correlated significantly (p < 0.05) with metabolic activity in this region measured in the contralateral (circles) and ipsilateral (triangles) hemispheres. B, At baseline, PDCP activity across hemispheres correlated significantly (p < 0.05) with regional metabolism in the anterior cingulate cortex.
In contrast to the different hemispheric trajectories observed for metabolic activity in the putamen, the longitudinal changes in anterior cingulate metabolism (Fig. 4B, right) did not differ between hemispheres (hemisphere × time interaction effect: p = 0.51; two-way RMANOVA). The changes were also nonsignificant (p = 0.78) in either hemisphere over time. On the contralateral side, cingulate metabolism was elevated above normal (p < 0.05) at baseline and 2 years, but not at 4 years. In contrast, metabolic activity on the ipsilateral side did not differ from normal at any of the three time points (p > 0.11). Cingulate metabolic activity correlated with PDCP expression across hemispheres at baseline (r = −0.39, p < 0.05) (Fig. 5B) and at both subsequent time points (2 years: r = −0.69, p < 0.001; 4 years: r = −0.63, p < 0.01; Table 3, bottom), but did not correlate with the other measures (p > 0.11).
At 2 years, significant hemispheric differences (p < 0.001) were present in the supplementary motor area (SMA), with relative metabolic increases on the contralateral side (Table 2, Fig. 4C, left). No significant hemispheric differences in this region were evident at baseline or 4 years. Over time, the changes in SMA metabolic activity did not differ for the two hemispheres (hemisphere × time interaction effect: p = 0.44; two-way RMANOVA) and were nonsignificant (p = 0.82) on either side. Metabolic activity in this region (Fig. 4C, right) did not differ from normal in either of the two hemispheres at any of the three time points (p > 0.16). There were no significant correlations (p > 0.06) between hemispheric metabolic activity in this region and the other measures at the three time points.
At 4 years, relative contralateral metabolic reductions (p < 0.001) were present in the precuneus (Table 2, Fig. 4D, left). These reductions were not present at baseline or at 2 years. In this region, metabolic activity declined significantly in both hemispheres over time (p < 0.05), but did not differ between hemispheres (hemisphere × time interaction effect: p = 0.79; two-way RMANOVA). Metabolic reductions in this region reached subnormal levels (p < 0.05) on the contralateral side, but only at the final time point (Fig. 4D, right). No significant correlations (p > 0.13) were found between hemispheric metabolic activity in this region and other measures at any of the three time points.
No areas of hemispheric difference were identified outside the hypothesis testing mask in the SPM analysis at any of the three time points.
Discussion
In this longitudinal metabolic imaging study, we tracked individuals with hemiparkinsonism as they developed bilateral limb involvement. We delineated a set of progressive functional changes in the initially presymptomatic cerebral hemispheres that were associated with the subsequent development of clinical signs on the opposite body side. Over the 4 years of follow-up, putamen DAT binding progressively declined in both hemispheres, at a faster rate on the side ipsilateral to the initial symptoms. Symptom onset in the initially unaffected limbs was associated with a critical degree of nigrostriatal dopaminergic deafferentation, as well as reciprocal increases in the metabolic activity of this structure. In contrast, the time course of hemispheric expression of the two disease-related metabolic networks was symmetrical, with parallel increases in activity on both sides. It is noteworthy that at baseline, PDRP expression was significantly elevated on the presymptomatic side. Thus, this network change anteceded the onset of motor signs on the opposite body side by ∼2 years. Analogously, although these subjects were behaviorally intact, the late development of bilateral elevations in PDCP activity is consistent with incipient cortical degeneration, leading ultimately to cognitive dysfunction (Huang et al., 2008).
Relationship of symptom onset to lateralized functional changes in the putamen
In the putamen, the ipsilateral DAT binding values were higher than the contralateral values at all three time points, with a faster rate of decline on the initially presymptomatic side. These findings are consistent with previous observations (e.g., Pirker et al., 2003; Filippi et al., 2005). In this study, we also found that the reductions in putamen DAT binding were inversely related to increases in the metabolic activity of this structure. At baseline, putamen metabolism was relatively higher on the contralateral side. At the second time point, the subjects began to exhibit symptoms on the previously asymptomatic body side, with concurrent increases in the metabolic activity of the opposite putamen. In that hemisphere, putamen metabolism increased steadily over time, reaching abnormally elevated levels at the final time point. On the contralateral side, in contrast, putamen metabolic activity was elevated at baseline and remained at similarly high levels at 2 and 4 years, such that the hemispheric differences noted initially in this brain region declined in magnitude over time. Thus, the appearance of symptoms on the initially unaffected body side is associated with the loss of dopaminergic input to the corresponding putamen. This neurochemical change is accompanied by increases in local metabolic activity, as indicated by the significant negative correlation that was found between these regional measures.
It is likely that the observed metabolic increases in the putamen are a functional response to nigrostriatal dopamine depletion beyond a specific threshold (Bezard et al., 2003; Hirano et al., 2008). In the case of putamen DAT binding, this threshold is in the vicinity of 60% of the normal mean, consistent with the observed ipsilateral decline from 68.5% at baseline to 58.7% at the second time point. Classically, critical loss of dopaminergic input to this structure gives rise to increases in the activity of its inhibitory projections to the external globus pallidus (GPe), which in turn results in a disinhibition of the STN and its excitatory output to GPi/SNr (Wichmann and Delong, 2007). Our data are consistent with this basic model, and further suggest that the onset of limb manifestations in PD is closely linked to increases in the metabolic activity of the contralateral putamen.
Presymptomatic elevation of disease-related network activity
We previously reported longitudinal correlations between changes in whole-brain PDRP network activity, UPDRS total motor ratings, and DAT binding (Huang et al., 2007). These correlations, although significant, were of moderate magnitude, accounting for no more than a third of the total variability between any two measures (Eckert et al., 2007). In the present study, we found that PDRP activity was symmetric and significantly elevated on both hemispheres at each of the three time points. This contrasts with the asymmetric loss of putamen dopaminergic innervation and concomitant increase in local metabolism observed in hemiparkinsonism, as well as with different time course of clinical progression on the two body sides. These findings demonstrate that increases in PDRP activity are not a direct reflection of striatal loss of dopamine or of the motor symptomatology of PD. Indeed, the activity of this metabolic network was found to be above normal in the presymptomatic hemisphere at the initial time point, ∼2 years before clinical onset on the opposite body side. This suggests that PDRP abnormalities are already evident in the late stages of the preclinical period in PD.
Consistent with the highly symmetrical nature of the network changes, there was no evidence of focal metabolic asymmetries in downstream elements of the motor cortico-striato-pallido-thalamocortical (CSPTC) loop, even when limb involvement was unilateral. The essential symmetry of hemispheric network activity is attributable to the fact that the regions with the greatest local contributions to PDRP activity (i.e., those with the highest voxel weights on the pattern) stem mainly from structures with little or no metabolic lateralization during disease progression. These salient network-related regions include the GPi, ventral thalamus, and dorsal pons (Huang et al., 2007; Ma et al., 2009). Indeed, the metabolically asymmetric putamen accounted for only a small fraction (∼2%) of the entire PDRP volume. Thus, while the observed regional increases in putamen metabolism directly relate to loss of DAT binding, the network-wide PDRP abnormality is more indicative of the broad functional changes that occur downstream in the pathway. In this regard, treatment strategies targeting downstream PDRP nodes can achieve a degree of overall network modulation—and clinical benefit—comparable to that of dopaminergic therapy (Asanuma et al., 2006; Feigin et al., 2007a; Hirano et al., 2008).
PDRP expression has been found to correlate with intraoperative recordings of spontaneous cell activity from the STN in advanced PD patients (cf. Eidelberg et al., 1997; Lin et al., 2008). It is possible that the network abnormality reflects compensatory preclinical increases in the neural activity of this region, as has been suggested in an experimental primate model (Bezard et al., 2003). Nonetheless, in this human study, there were no areas in which metabolic activity in the ipsilateral hemisphere was elevated presymptomatically, as would be the case for a truly compensatory process. Moreover, we found that the baseline PDRP elevations on the ipsilateral hemisphere continued to increase over time, rather than to decline as symptoms emerged on the opposite body side. In all likelihood, the early development of disease-related network activity coincides with the progressive disruption of normal functional brain organization beginning several years before symptom onset (Moeller and Eidelberg, 1997; Tang et al., 2008).
The presence of baseline elevations in PDRP expression contrasts with PDCP activity that did not reach supernormal levels until the final time point, ∼4 years after the appearance of the motor network abnormality. Interestingly, metabolic activity in the cingulate cortex was found to be elevated at baseline and 2 years when PDCP expression was normal, and declined into the normal range as the PDCP abnormality became evident at 4 years. In this regard, the increase in cingulate activity may compensate for the evolving cognitive network abnormality in behaviorally normal early stage patients, and in those who develop mild cognitive impairment (Huang et al., 2008). Indeed, we found a consistent negative correlation between hemispheric cingulate metabolism and PDCP expression at each of the three time points. While the PDCP elevations at 4 years were bilateral and symmetric, significant regional declines within this network were evident only in the precuneus of the initially involved contralateral hemisphere. This localized metabolic change may reflect the earliest stages of the transition in PD from predominant subcortical Lewy body pathology (Braak stage 4) to a more advanced pathological stage characterized by additional changes in neocortical association areas (Braak stage 5). By analogy to the development of abnormal PDRP expression before the onset of motor signs, the appearance of PDCP abnormalities in cognitively intact individuals is likely to presage the subsequent development of neuropsychological deficits with advancing disease.
Footnotes
- Received August 24, 2009.
- Revision received November 11, 2009.
- Accepted December 4, 2009.
-
This work was supported by the National Institutes of Health [National Institute of Neurological Disorders and Stroke Grants R01 NS 35069 and P50 NS 38370 to D.E.] and the General Clinical Research Center of The Feinstein Institute for Medical Research, North Shore-LIJ Health System (National Center for Research Resources, a component of the National Institutes of Health, Grant M01 RR018535). We thank Drs. Andrew Feigin and Michael Pourfar for patient screening and evaluation, Dr. Thomas Chaly for radiochemistry support, Claude Margouleff for technical assistance, and Dr. Yilong Ma for his help in image quantification. We are grateful to Toni Fitzpatrick for valuable editorial assistance.
- Correspondence should be addressed to Dr. David Eidelberg, Center for Neurosciences, The Feinstein Institute for Medical Research, 350 Community Drive, Manhasset, NY 11030. david1{at}nshs.edu
- Copyright © 2010 the authors 0270-6474/10/301049-08$15.00/0