
Abstract
The neurofibromatosis type 2 gene product merlin is known to provoke gliogenic tumors as a result of its mutagenic loss. Merlin's physiological anti-mitogenic function makes it unique among its ezrin–radixin–moesin (ERM) family members. Although ERM proteins and merlin are known to be expressed in glial cells of the peripheral nervous system and CNS, the neuronal expression pattern and function of merlin have been less well investigated. We report here expression of merlin in developing and mature neurons of the murine CNS. Within cerebellar Purkinje cells (PCs), merlin was localized in the soma, sprouting dendrites and axons. Merlin expression in PCs was high during the period of initial dendrite regression and declined during later phases of dendrite elongation. Consistently, merlin expression in vivo was increased in Engrailed-2-overexpressing PCs, which are characterized by a reduced dendritic extension. Furthermore, overexpression of merlin in dissociated cerebellar cultures and in neurogenic P19 cells caused a significant decline in neurite outgrowth, while, conversely, inhibition of merlin expression increased process formation. This effect was dependent on phosphorylation of serine 518 and involved the inactivation of the growth-promoting GTPase Rac. We thus provide evidence that merlin plays a pivotal role in controlling the neuronal wiring in the developing CNS.
Introduction
Neurons unidirectionally transmit signals from the dendritic to the axonal pole of a cell. Dendrites and axons are therefore of fundamental importance for the wiring and networking of neuronal circuits. Considering the bulk of extrinsic and intrinsic factors identified to be involved in establishing neuronal processes, a dynamic actin cytoskeleton and its regulatory machinery seem to play a decisive role; either promoting or depleting actin polymerization results in altered neuronal development and function (Ridley and Hall, 1992; Ridley et al., 1992; Luo, 2000; Etienne-Manneville and Hall, 2002; Fukata et al., 2003).
Purkinje cells (PCs) are the largest and most prominent neurons of the cerebellar cortex because of their intricate dendritic arborization. Between birth and postnatal day 5 (P5), mouse PCs arrange in a single layer and begin to elaborate their characteristic dendritic arbores in a biphasic pattern (Armengol and Sotelo, 1991). Although PCs perinatally form multiple dendrites emerging from around the cell soma, these early processes regress and new dendrites are formed after postnatal day 5. The basic morphological setup characterized by a single stem dendrite and multiple radially oriented branches is completed at approximately postnatal day 17. PCs are rich in dendritic spines integrating >200,000 electrical signals to only one axon. Beyond this fascinating integration capacity, postnatal cerebellar development and PC differentiation and morphogenesis have turned into an ideal model system to study mechanisms underlying neuronal polarity, synaptogenesis, and dendrite development. Although numerous intrinsic and extrinsic signals impinging on PC development have been identified, proteins that influence the actin cytoskeleton in PCs have been poorly investigated.
We have reported recently differential expression of the tumor suppressor gene neurofibromatosis type 2 (Nf2) in developing PCs after in vivo overexpression of the transcription factor Engrailed-2 (En-2) (Holst et al., 2008). Persistent expression of En-2 has been shown to significantly delay postnatal PC dendritic development (Jankowski et al., 2004). Nf2 gene expression correlates with this delayed PC morphogenesis, suggesting that Nf2 may function in an intrinsic signaling network critical for dendritic morphogenesis. Merlin is the protein product of the Nf2 gene, which, when mutated, causes autosomal dominant familial cancer syndrome neurofibromatosis 2 (NF2), which is characterized by the formation of bilateral schwannomas and multiple meningiomas. Merlin is an actin-binding protein belonging to the ezrin–radixin–moesin family of proteins that organizes and links membrane proteins to the cortical cytoskeleton (McClatchey and Fehon, 2009). Merlin is able to counteract several signaling pathways involved in cell migration, cell proliferation, and oncogene-induced transformation, including the signaling of the small GTPases Ras and Rac (Morrison et al., 2007). Small GTPases are critical regulators of the actin cytoskeleton in multiple cell types and are in addition indispensably linked to tumor progression (Karnoub and Weinberg, 2008).
The expression of merlin has been documented for glial cell types of the peripheral nervous system and CNS. However, to date, the neuronal expression pattern of merlin has not been addressed in detail. Furthermore, merlin interacts with the actin cytoskeleton and regulates small GTPases, which are important signaling mechanisms in neurite formation. Again, Nf2 function within neurons of the CNS has not been tackled so far. We now investigated the expression and function of merlin in neurons of the CNS, in particular in cerebellar PCs.
Materials and Methods
Experimental animals.
All animals used in the present study were housed under constant temperature and humidity conditions on a 12 h light/dark cycle. Animals had access to food and water ad libitum. All mice used for this study were handled in strict adherence to local governmental and institutional animal care regulations. L7En-2 transgenic mice (Baader et al., 1998) were generated by breeding heterozygote L7En-2 mice with FVB/N wild-type (WT) animals (Janvier Elevage), thereby keeping a pure FVB/N background. For experiments, pups of the same litter were compared, regardless of their gender. The day of birth, occurring on average on day 19 of pregnancy, was defined as P0. Animals older than 6 weeks were classified as adult. Genotype characterization was performed by PCR of tail biopsies (Baader et al., 1998). Each experiment was performed with at least two (when using WT mice only) or two pairs of (when using transgenic mice) animals. For making primary cerebellar cultures, C57BL/6 mice of both genders were used.
Immunohistochemistry.
For immunohistochemistry, animals were perfused transcardially using standard Ringer's solution for mammals, followed by 4% paraformaldehyde in PBS. After dissection, brains were postfixed in the same fixative overnight at room temperature. Sections were cut to 50 μm thickness on a vibratome (VT1000 S; Leica). Sections were heated in 10 mm Na-citrate buffer, pH 9, at 80°C for 30 min and, after cooling, incubated in 2% nonfat dry milk for 30 min. Sections were then treated with 0.5% Triton X-100 for 30 min and incubated in 0.2% gelatin and 2% goat serum diluted in PBS for at least 2 h. Afterward, sections were submersed in the primary antibody solution overnight at 4°C. The following antibodies were used: anti-calbindinD-28k (rabbit polyclonal, 1:4000; Swant), anti-myelin basic protein (MBP) (mouse monoclonal, 1:500, clone MAB384; Millipore Bioscience Research Reagents), and anti-merlin (rabbit polyclonal antibody raised against a peptide mapping at the C terminus of merlin of human origin, 1:50, clone C-18; Santa Cruz Biotechnology). After vigorous washings, sections were incubated with the secondary antibody solution (Alexa Fluor 488- and Alexa Fluor 546-conjugated goat anti-mouse and anti-rabbit antibodies, 1:500 in PBS; Invitrogen) at room temperature for 2 h. Finally, sections were counterstained using Hoechst 34580 (1 μg/ml PBS, 5 min), washed for at least 1 h, and embedded in Mowiol. Although calbindin and MBP immunohistochemical stainings are well established (Bouslama-Oueghlani et al., 2003; Jankowski et al., 2009), we checked for merlin-specific staining using several procedures. First, omitting the primary antibody revealed no signal; and second, incubating sections with a merlin-specific peptide (10-fold excess) diminished the specific binding to background levels (supplemental Fig. 1, available at www.jneurosci.org as supplemental material). In addition, we fixed tissue in varying concentrations of paraformaldehyde (2 and 4%) and glutaraldehyde (0.2 and 0.5%), and we also used paraffin-embedded tissue. In all cases, the staining pattern was comparable. Finally, we used small interfering RNA (siRNA) to specifically knockdown merlin expression in P19 cells and showed that the postulated band for merlin was diminished in immunoblots (see Fig. 6D).
Immunoblotting.
Immunoblotting was performed as described previously (Morrison et al., 2001). The following primary antibodies were used: anti-merlin (clone C-18, 1:500; see above), anti-actin (clone I-19, 1:1500; Santa Cruz Biotechnology), anti-glyceraldehyde-3-phosphate dehydrogenase (GAPDH) (clone C9848, 1:10,000; Sigma), and anti-RhoA (1:500; Pierce Biotechnology).
Reverse-transcription PCR analysis.
Total RNA was isolated from mouse cerebella at the ages indicated in the text using the RNA-Solv extraction kit (Omega Bio-Tek). cDNAs were prepared from 1 μg of total RNA using 200 U of RevertAid H Minus Moloney murine leukemia virus reverse transcriptase (Fermentas) according to the instructions of the manufacturer. PCR amplification was performed with TaqDNA polymerase (Fermentas) for 35 cycles at 94°C for 1 min, 50°C for 1 min, and 72°C for 1 min. Oligonucleotides for amplifying exons 1–6 (73–1128 bp) were 5′-AGG TCG CTG AGG TGG GGG TTG-3′ (forward) and 5′-GGT GCT CCG CAT ACC AAG CCG-3′ (reverse). To synthesize exons 4–13, the following primers were used: 5′-CGT CCG TGC TCT TGG CGT CAT-3′ and 5′-GGT GGG CTT GGT GGC GAT TTC-3′ (952–1982). Primer pair 3 (1832–2348; 5′-GCT GGA GGC TGA AGT GCT GGC-3′ and 5′-TGG CCG GGT CAC CTG CTA GAG-3′) amplified exons 12–17.
Affinity precipitation.
For pulldowns of active Rac1 and Cdc42, a commercial detection kit was used (Active Rac1/Cdc42 Pull-Down and Detection kit; Pierce Biotechnology). The procedure was performed as recommended by the manufacturer. Briefly, P19 cells were lysed in 25 mm Tris-HCl, pH 7.5, 150 mm NaCl, 5 mm MgCl2, 1% Nonidet P-40, and 5% glycerol. The supernatant was incubated with 20 μg of glutathione S-transferase–human Pak1–p21-binding domain to specifically pull down GTP-loaded Rac1 and Cdc42. Both the precipitates and total lysates were resolved on a 10% SDS-PAGE gel, followed by Western blotting using antibodies against Rac1 and Cdc42 (1:500; Pierce Biotechnology). Total lysates were used as loading controls. The pulldown assay for overexpressing P19 cells was repeated three times, and that for merlin-deficient cells was repeated twice.
Cell culture.
P19 cells were purchased from American Type Culture Collection (CRL-1825) and maintained in DMEM supplemented with 10% fetal calf serum. For induction of a neuronal phenotype, aggregates were generated on bacterial-grade dishes and treated with 5 × 10⁻⁷ m all-trans retinoic acid (Sigma) for 4 d. Subsequently, cells were replated on dishes of cell culture grade in the absence of retinoic acid. Within 4–6 d, neuritogenesis was analyzed.
Immunocytochemistry of P19 cells.
For immunocytochemistry, P19 cells were grown on coverslips and fixed with 4% paraformaldehyde in PBS for 20 min. After washing in PBS, cells were permeabilized with 0.3% Triton X-100 for 1 min and incubated for 2 h in 1% bovine serum albumin. Subsequently, cells were incubated with the primary antibodies at room temperature for 1 h. The following antibodies and solutions were used: anti-merlin (clones A-19, C-18, and B-12, 1:50 each; Santa Cruz Biotechnology), anti-growth-associated protein (GAP-43) (clone H-100, 1:400; Santa Cruz Biotechnology), anti-α-tubulin (clone TU-02, 1:50; Santa Cruz Biotechnology), anti-microtubule-associated protein (MAP-2) (clone AP-20, 1:200; Sigma), and anti-phalloidin 594 (1:200; Invitrogen). After extensive rinsing in PBS, cells were incubated with secondary antibodies linked to Alexa Fluor-488 (anti-rabbit, 1:500; Invitrogen) and Alexa Fluor 546 (anti-mouse, 1:500; Invitrogen) for 1 h. Afterward, cells were washed in PBS and counterstained with Hoechst 34580 (1:1000 in PBS) for 5 min. Finally, cells were mounted on cover plates with a Mowiol-based mounting medium.
Transfection of P19 cells.
Changes in merlin expression were achieved by transfecting differentiating P19 cells with either a cytomegalovirus-driven eukaryotic expression system or with sequence-specific siRNA probes. Therefore, P19 cells were differentiated with retinoic acid as described above and transfected 4 d later using Lipofectamine 2000 (Invitrogen) according to the protocol of the manufacturer. For overexpression of merlin, a pcDNA3-based Nf2 full-length sequence was used (Morrison et al., 2001). Isoforms 1 and 2 were cloned into the same vector. The backbone vector pcDNA3 was used in control experiments. For inhibition of merlin expression, the following oligonucleotides were used: si-nf2, 5′-UAC CGA GCU UCG ACA UUA UUG-3′; scrambled (scr) nf2, 5′-AAU CCG GUU GCA UAG UUC AUG-3′ (Morrison et al., 2007). Compensation of si-nf2 effects were achieved with a human Nf2 sequence. The medium was replaced 12 or 24 h after plasmid and siRNA transfection, respectively. Afterward, P19 cells were cultured for an additional 72–84 h. The transfection efficiency averaged ∼45–50%.
Primary dissociated cell cultures.
Primary dissociated cerebellar cultures were established from cerebellar tissue of 8-d-old pups of C57BL/6 mice as described (Baader and Schilling, 1996). Similarly, forebrain cultures were prepared according to the same protocol using newborn pups of C57BL/6 mice. Cells were grown at a density of 200,000 cells/cm2 in defined Neurobasal medium (Invitrogen). After 3–4 d in vitro, cells were transfected with Lipofectamine LTX (Invitrogen) and the following plasmid DNAs. For overexpression of merlin, a flag-tagged version of the full-length Nf2 sequence was used and compared with either cells transfected with an empty vector or an enhanced green fluorescent protein (EGFP)-driving construct of the same basic vector (pcDNA3.1). For evaluation, only the EGFP-transfected cells were included, because there was no difference between them and the empty vectors. For merlin knockdown experiments, cells were transfected 1 d after plating with Dharmafect 3 according to the instructions of the manufacturer (Dharmacon, Thermo Fisher Scientific). Using siGLO RNA, a transfection rate of 75% could be obtained. Two days after transfection, cells were stained for MAP-2 and analyzed as follows. For immunostaining, primary cultures were fixed with 4% paraformaldehyde and double stained with antibodies against the flag tag (clone M2, 1:500; Sigma) and/or MAP-2 (clone AP-20, 1:500; Sigma). The flag signal of merlin-overexpressing cells turned out to be present in all MAP-2-positive processes of a single neuron. The same was true for the cellular distribution of the EGFP signal within neurons. We thus counted and measured only the flag and EGFP-positive neurites because they were clearly distinguishable from untransfected cells. In siRNA-treated cultures, all MAP-2-stained cells were evaluated. Details regarding the evaluation are described below.
Microscopy and image acquisition.
Confocal images were obtained with a Leica TCS SP5 laser scanning microscope). Images were acquired with a 40× objective (HCX Apo 40.0 × 0.75 dry; numerical aperture 0.75) at a pinhole size of three airy discs and a resolution of 0.73 × 0.73 × 0.50 μm3. Images were taken from single optical planes (voxel size, 189 nm). Epifluorescent images of dissociated neurons were obtained with a Leica DMIRE2 microscope equipped with a Leica DFC350FX camera. All digital processing of the photomicrographs was performed using Adobe Photoshop 6.0 (Adobe Systems). For all images, only linear adjustments of the brightness and contrast were performed.
Quantification of the dendrite/soma and PC/pyramidal cell ratios.
To measure and compare the signal intensity over cell somata and dendrites, regions of interest were defined manually using the NIH ImageJ polygon selection tool. For the soma, a region within the cell body was chosen that encompassed parts of the cytoplasm and nucleus. Dendritic areas contained parts of the molecular layer where dendrites could be clearly identified. The “mean grayscale value” was taken as the readout. Ratios were obtained for the PC soma and the corresponding PC dendrite and for the PC soma and somata within the cornu ammonis (CA3) of the hippocampus.
Quantification of the neurite/cell and axon/cell ratios.
Because dendrites and axons cannot be clearly distinguished in vitro, we used immunocytochemical stainings of P19 cells with either MAP-2-specific or GAP-43-specific antibodies. MAP-2 is localized in all neurites in vitro, whereas GAP-43 is mainly positioned within very narrow long processes resembling an axonal appearance (Jacobson et al., 1986). P19 cell nuclei were visualized by Hoechst 34580 counterstaining. For quantification, only those P19 cells that had at most two neighboring cells were counted. This way we were able to clearly distinguish cells without processes and those with processes emanating from a particular cell. Within a given transfection experiment, we did not distinguish between merlin-positive and merlin-negative cells but rather evaluated randomly chosen cell populations with the characteristics described. The neurite/cell ratio was defined as the average number of MAP-2-positive processes per P19 cell that were larger than twice the soma diameter. The same rule applied to the axon/cell ratio analyzing only GAP-43-stained fibers.
Quantification of neurite length.
The lengths of neuron-like processes of retinoic acid-treated P19 cells were measured in differentiated and transfected P19 cells 4 d after transfection. Using the NIH ImageJ plugin Neuron J, neurites that were longer than a cell nucleus were traced and scaled in micrometers. In primary cultures, only those processes were evaluated that could be clearly distinguished from processes of neighboring cells. The average length of neurites was calculated from >200 (primary cell cultures) or 1000 (P19 cell cultures) processes that were measured in each experimental condition.
Statistical evaluation.
For all quantitative analyses, we compared two independent groups of experiments. To demonstrate their comparable distribution, we performed Levene's test for equal variances and the Student's t test using SPSS software (Statistical Package for the Social Sciences). All values given in the text are means and SEs.
Results
Merlin expression in neurons of the murine CNS
Although merlin has been found previously to be expressed in the peripheral nervous system and shown to regulate cell growth and proliferation, merlin expression in the developing and adult CNS has been less well investigated. Because merlin expression has been described to be regulated in cerebellar tissue after overexpressing the segment polarity and autism-associated gene En-2 (Holst et al., 2008), we performed for the first time a detailed analysis of merlin expression in the CNS, in particular in the cerebellar cortex. Throughout development, merlin was clearly attributed to the gray matter and nuclear regions of the CNS in which high numbers of neurons can be found (Fig. 1). In particular, merlin was found in the PC layer, the external and internal granule cell layers of the cerebellar cortex and the deep cerebellar nuclei starting at P3 (Fig. 1A,B). Merlin was also expressed in the cornu ammonis (Fig. 1C,D), the cortical amygdalar area (Fig. 1E,F), and to a lesser extent in the dentate gyrus of the hippocampus and the cortical layers of the neocortex. This distribution was consistent with stainings achieved by in situ hybridization and immunohistochemistry on paraffin and vibratome sections (data not shown). Merlin expression clearly colocalized with the expression of the neuronal markers MAP-2 and calbindin (Fig. 2A–D), but it showed no similarity in the distribution pattern when using the reactive and radial glial marker glial fibrillary acidic protein (GFAP) (Fig. 2E,F). Merlin was thus clearly visible in Purkinje neurons and granule cells, but it was absent from Bergmann glia.

Merlin expression in neurons of the developing murine CNS. Immunohistochemical stainings of cerebella obtained from 3-d-old mice revealed merlin expression in the PC layer (PCL) throughout the rostrocaudal axis of the cerebellar cortex (arrowhead in A). Lobules are marked by roman numerals. A higher magnification (B) also revealed expression within cells and fibers of the external granule cell layer (EGL), the internal granule cell layer (IGL), and the white matter (WM). As in the cerebellar cortex, merlin was also expressed in neurons of the Ammon's horn (CA), in particular the CA3 region (C, D), and less significantly in the dentate gyrus (DG) of the hippocampus (C). Tissue was taken from 15-d-old pups. The cortical amygdalar area also showed prominent expression of merlin (P9; E, F). The arrowheads in D and F point out neurons with distinctly visible nuclei. Scale bars: A, C, E, 200 μm; B, D, F, 50 μm.

Merlin expression in the murine cerebellar cortex. Double immunostainings revealed overlapping staining patterns of merlin (A, C, E) with calbindin-positive (B) and MAP-2-positive (D) neurons but not with GFAP-positive Bergmann glia cells (F). Arrowheads point to PCs. Scale bars, 20 μm. EGL, External granule cell layer; IGL, internal granule cell layer.
Developmental expression of merlin and its isoforms in the cerebellar cortex
Because merlin was highly expressed in cerebellar PCs, we investigated next merlin expression during cerebellar development to compare its expression profile with distinct steps of neuronal maturation. PCs are suitable for this purpose because their maturation mainly occurs postnatally. As shown in Figure 3, merlin was expressed in PCs throughout postnatal cerebellar development. Interestingly, merlin was clearly localized in somata and dendrites during the first and second postnatal weeks (Fig. 3A), and it was present in PC axons although to a lower extent (Fig. 3A,B, arrows). After P9, high levels of merlin were now detected in fibers of the internal granule cell layer and around the PC layer, whereas merlin staining in somata and dendrites diminished (Fig. 3C,D). The localization of these fibers and the fact that they could be double stained with MBP and calbindin revealed that these fibers were PC axons and their myelin sheets. The overall staining intensity after P9 appeared reduced. This developmental expression profile was reproduced by immunoblotting, which showed merlin expression throughout postnatal cerebellar development with the highest levels at approximately P0 and a decrease by half at P9 and thereafter (Fig. 3E). When performing immunoblots, it was apparent that merlin always appeared as a double band that has been suggested previously to be caused by different phosphorylation states (Jin et al., 2006). This could indeed be shown with treatment of cerebellar extracts with calf intestine phosphatase, which eliminated the higher migrating merlin band only (Fig. 3F). Thus, the upper merlin band was a phosphorylated form of merlin, and the lower band was a hypophosphorylated form of merlin. A comparison of the phosphorylated and hypophosphorylated versions of merlin showed that both versions were equally abundant early postnatally. However, the hypophosphorylated form of merlin was scarce in adult cerebella (Fig. 3E).

Developmental expression of merlin and merlin isoforms in the murine cerebellar cortex. Immunohistochemical stainings with a merlin-specific antibody revealed that merlin was clearly localized to the somata (arrowheads) and dendrites [molecular layer (ML)] of PCs of 5-d-old (P5) and 9-d-old (P9) pups (A, B, respectively). At P15 (C) and in adult mice (D), merlin staining in soma and dendrites was more diffuse and appeared diminished but could prominently be seen in fiber tracts within the granule cell layer and the white matter (arrows). Scale bars: A, B, 20 μm; C, D, 50 μm. As in histochemical stainings, Western blotting revealed high levels of merlin expression in newborn mice up to P9 and a drop by half at P9, P15, and adult (Ad) stages (E). Actin was used as a loading control. Merlin appeared as a double band in immunoblotting. The upper band could be diminished by phosphatase treatment [calf intestine phosphatase (+CIP)] demonstrating different phosphorylation states of merlin (F). Please note that, for demonstrating the different phosphorylation states, the bands were resolved maximally in the CIP-treated samples but was only resolved poorly in the developmental blot because the actin band should be visualized on the same gel. To investigate the expression of Nf2 isoforms, PCR analysis was performed using three pairs of primers. The positioning of the primers can be seen in the exon–intron scheme shown in G (numbers depict exons). These primers revealed a major PCR product for exons 1–6 and 4–13 and a double band when amplifying exons 12–17 (H). These two latter bands result from hopping exon 16, which contains a stop codon (F; exon 12–17; isoform 1, top band; isoform 2, bottom band). The relative quantity of splice variants remained unaltered during development.
Merlin appears as two major isoforms that are generated by alternative splicing. This splicing event eliminates exon 16, which contains a 45 nt sequence, including a stop codon (isoform 1) (Gutmann et al., 1995). Reports have suggested that isoforms 1 and 2 differ in their ability to suppress cellular growth, in which isoform 1 is thought to contain the tumor suppressor activity (Sherman et al., 1997). Others have revealed that merlin isoforms 1 and 2 bind actin filaments differentially and have shown that intramolecular interactions in isoform 1 hinder its ability to bind actin (James et al., 2001). Additional studies have also indicated that isoform 2 and not isoform 1 binds along actin filament lengths, affecting actin filament dynamics by slowing filament disassembly (James et al., 2001).
To examine whether both isoforms are present in cerebellar tissue, we analyzed the relative expression levels of Nf2 splice variants in cerebellar tissue at different time points of postnatal development (Fig. 3G,H). As shown previously for different tissue and tumor types (Bianchi et al., 1994; Gutmann et al., 1995), we also observed two bands in native cerebellar tissue when amplifying exons 12–17 by PCR. These bands differed by 45 bp and represented the two splice variants as proven by DNA sequencing. Notably, the relative expression level of isoforms 1 and 2 was comparable throughout postnatal development. Furthermore, using a semiquantitative PCR technique, it was apparent that, at P0, the band intensity representing the first six exons was relatively high, although it decreased during later stages. This was contrary to the other primer pairs used. Subsequent sequencing of the exons 1–6 band revealed at least two splice variants bearing sequence similarity within the first three but not the following exons, suggesting the existence of other so far unknown merlin splice variants in the early period of cerebellar development.
Merlin expression in a cerebellar mutant deficient in PC dendritogenesis
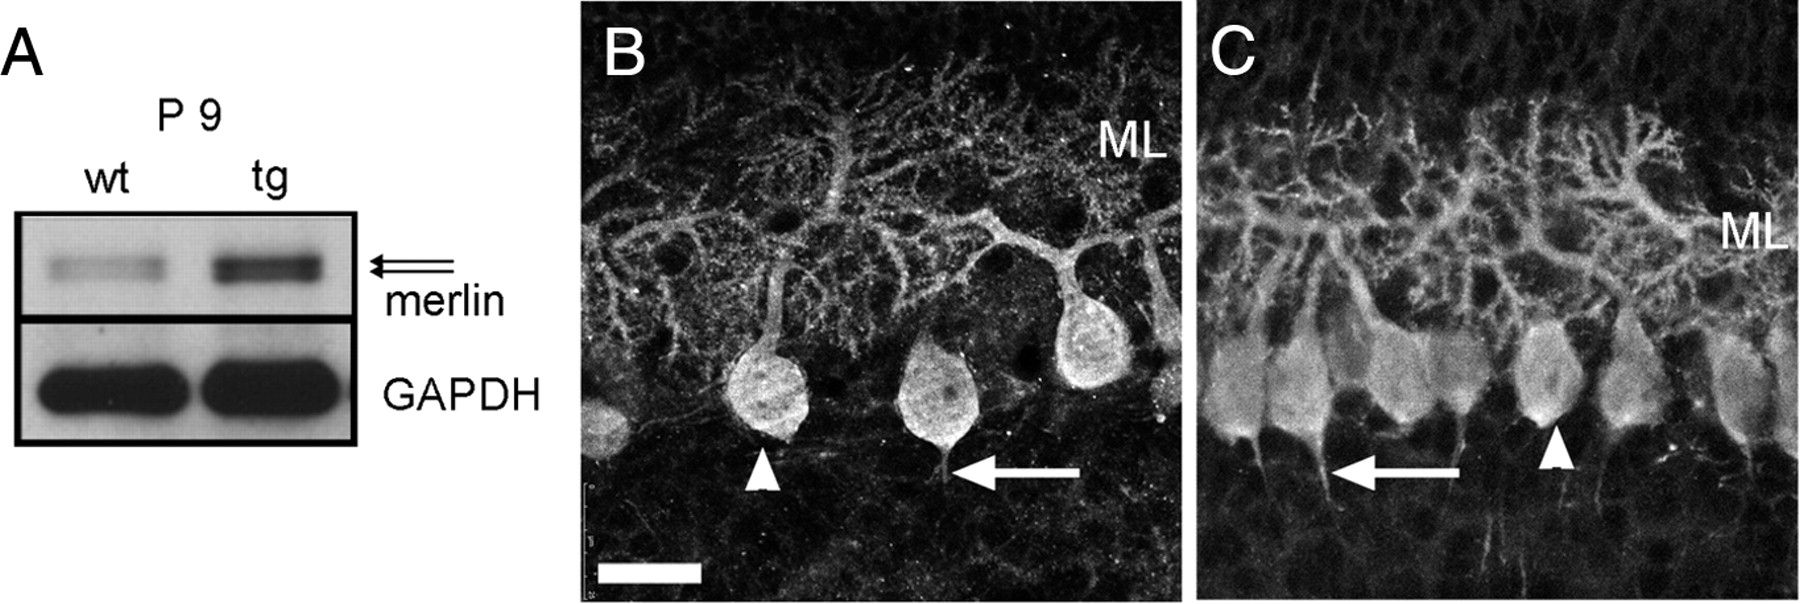
We found that merlin was not only expressed in cerebellar neurons, but it was present in two phosphorylation states and isoforms that have been shown previously to regulate merlin activity. In addition, merlin has been suggested to be differentially expressed in L7En-2 mice, which are deficient in PC dendritogenesis (Baader et al., 1998; Jankowski et al., 2004; Holst et al., 2008). This implies an involvement of merlin in process outgrowth. To show a correlation between PC dendritogenesis and merlin expression, we investigated the expression of merlin in transgenic L7En-2 mice. Immunoblotting experiments revealed that the expression level of merlin was increased at P9 (Fig. 4A), reflecting the results obtained by array analysis (Holst et al., 2008). As for the WT animals, the ratio between hypophosphorylated and hyperphosphorylated merlin was equal in L7En-2 mice at P9. To allocate differences in merlin expression to distinct cellular compartments, immunohistochemical stainings were evaluated by measuring the fluorescent intensities over the soma and dendritic compartments of PCs and calculating the dendrite/soma ratio. This dendrite/soma ratio was significantly higher in L7En-2 PCs (1.56 ± 0.17) compared with WT PCs (1.03 ± 0.01; n > = 98; p < 0.01 according to Student's t test; measurements were done at P5) (the same result could be obtained from P9 animals as shown in Fig. 4B,C). In addition, the ratios of intensities measured in PC somata and hippocampal neurons were also significantly higher in L7En-2 cerebella (1.53 ± 0.02) compared with WT tissue (1.17 ± 0.02; n > = 61; p < 0.01, Student's t test), showing that changes in staining intensities were not attributable to technical reasons. Comparing the absolute staining intensity of hippocampal neurons of WT and L7En-2 mice instead revealed no difference. Hence, merlin expression in dendrites was inversely related to PC dendritogenesis.

Merlin expression in PCs deficient in dendritogenesis. Immunoblotting revealed that merlin expression was increased in L7En-2 transgenic mice (tg) compared with wild-type littermates (wt) at P9 (A). Immunostaining of cerebellar tissue of the same age showed intense staining within the Purkinje cell somata (arrowheads), dendrites [molecular layer (ML)], and initial axon segments (arrows) of wild-type (B) and transgenic L7En-2 (C) mice. Measurements of the staining intensity in dendrites revealed a significant increase in the intensity ratios (dendrites to somata) of L7En-2 PCs (for more data, see Results). As shown previously, the molecular layer was smaller in L7En-2 compared with wild-type cerebella, resembling its reduced dendritogenesis. Scale bar: B, C, 20 μm.
Merlin expression in differentiating P19 cells
The localization of merlin to the dendritic and axonal neuronal compartment and the regulation of merlin in dendritogenesis-deficient PCs prompted us to investigate the effects of merlin misexpression on neurite outgrowth in the cell line P19. Murine embryonic carcinoma P19 cells containing the pluripotency of malignant teratocarcinomas are known for their ability to differentiate into neuronal cells during retinoic acid treatment and cellular aggregation (Jones-Villeneuve et al., 1982). These retinoic acid-treated cells have been used frequently to study the events determining cellular differentiation (de Groot et al., 1990; Wei et al., 2002; da Silva et al., 2007). We first showed that merlin was indeed expressed in this cell line when differentiated into a neuronal phenotype (Fig. 5A). As expected from the PCR results, merlin was also detected in P19 cells by immunoblotting; although sparsely found in differentiating cells within the first 3 d of neuritogenesis, a distinct increase in expression was observed at day 4 (Fig. 5B). At this time point, P19 cells already showed large processes emanating from the cell soma. RhoA, a member of the Rho GTPase family and a proposed inhibitor of neurite extension (da Silva and Dotti, 2002), showed a similar expression profile. Merlin could also be detected in differentiated P19 cells by immunocytochemistry (supplemental Fig. 2, available at www.jneurosci.org as supplemental material). Apart from its localization beneath the cell plasma membrane, it mainly appeared in granular structures, notably in the perinuclear region, shown previously in undifferentiated schwannoma cells and normal astrocytes only (Stemmer-Rachamimov et al., 1997; Obremski et al., 1998).

Expression of merlin in transfected P19 cells. The same primer pairs used for Figure 4 were used to analyze Nf2 expression in differentiated P19 cells by PCR (A). Expression of merlin was also shown by immunoblotting (B). Whereas merlin expression increased up to 8 d after plating of retinoic acid-treated cells, actin expression remained unchanged. Concomitantly with merlin expression, RhoA expression increased.
Merlin expression affects neurite formation in differentiating P19 cells and dissociated cerebellar cultures
Because merlin was localized within neurites and was expressed during neurite outgrowth, we investigated next whether overexpression and suppression of merlin would affect neurite outgrowth. After transfecting differentiating P19 cells with either merlin or an siRNA against merlin, we quantified the average number of processes emanating from a single soma (Caceres and Kosik, 1990). Additionally, we distinguished GAP-43-positive neurites from MAP-2-positive neurites taking into account that in vitro axons and dendrites express MAP-2, whereas only axons express GAP-43 (Jacobson et al., 1986; Przyborski and Cambray-Deakin, 1994). GAP-43 immunocytochemistry revealed at most one distinct GAP-43-positive fiber emanating from a single cell soma (Fig. 6B). MAP-2-positive fibers, however, were present at higher numbers (Fig. 6A), demonstrating that differentiated P19 cells display a highly polarized phenotype in culture. To reveal differences in the activity of merlin on dendrite and axon formation, we evaluated the neurite (MAP-2)/cell ratio and the axon (GAP-43)/cell ratio.

Process formation in merlin-overexpressing and -deficient P19 cells. P19 cells were treated with retinoic acid and transfected with the Nf2 coding sequence (nf2), the coding sequences for the isoforms 1 (iso1) and 2 (iso2), and a control vector (crtl) 4 d after retinoic acid treatment. Cells were analyzed 72–84 h after transfection. P19 cells revealed processes that were stained for MAP-2 (A) and GAP-43 (B; scale bar, 25 μm). P19 cells displayed a differentiated phenotype characterized by processes that were both GAP-43 and MAP-2 positive (resembling axons, arrows) or only MAP-2 positive (dendritic-like structures, arrowheads). Counting the number of MAP-2-positive and GAP-43-positive neurites per cell revealed a highly significant decrease in process formation by merlin overexpression (C) (**p < 0.001; n > 1700). Transfecting an Nf2-specific siRNA probe (si nf2) into P19 cells reduced the amount of merlin protein produced in P19 cells compared with transfecting a scrambled RNA probe (scr nf2). This reduction could be reversed by cotransfecting human Nf2 (nf2h) into P19 cells, which is shown by Western blotting (D). Process formation was increased after transfection of si-nf2 compared with scr-nf2 (E) (**p < 0.001; n > 600). This siRNA effect could be reversed by cotransfecting human Nf2 (nf2h; F) (**p < 0.001; n > 240). Transfecting isoforms 1 and 2 into P19 cells equally increased the amount of merlin protein produced in P19 cells as shown by Western blotting (G). Both isoforms 1 and 2 reduced neurite outgrowth (H) (**p < 0.001; n > 700). In addition to the amount of neurite per cell, the length of MAP-2-positive neurites was decreased in isoform 1- and 2-treated P19 cells (I) (**p < 0.01; n > 1000). Asterisks mark highly significant differences as obtained by Student's t test.
Overexpression of merlin in retinoic acid-treated P19 cells decreased the neurite/cell ratio by 36% compared with P19 cells transfected with an empty vector (Fig. 6C). Similarly, merlin overexpression during neuronal differentiation caused a significant decline in the axon/cell ratio by 41% (0.17 in control cells, 0.10 in merlin-overexpressing cells; p < 0.001, n > 2000 cells). When we used Nf2-specific siRNA, we specifically could block endogenous merlin expression in P19 cells (Fig. 6D). Blocking of merlin expression by Nf2-specific siRNA increased the neurite/cell ratio to 0.62 neurites per cell (Fig. 6E). In contrast, the expression of an scrRNA led to a neurite/cell ratio of 0.34 (Student's t test, p < 0.001; n > 600). Again, the axon/cell ratio increased from 0.16 in the vector control group to 0.42 in cells with blocked merlin expression (Student's t test, p < 0.001; n > 600). To test for off-target effects of the siRNA used, we cotransfected P19 cells with murine Nf2-specific siRNA and a plasmid expressing the human merlin sequence (Nf2h). Overexpression of merlin protein (human) rescued the (mouse) siRNA-dependent effect on protein expression (Fig. 6D) and its effect on neurite outgrowth (Fig. 6F). Thus, merlin expression in P19 cells inhibited neurite outgrowth during neuronal differentiation.
Isoforms 1 and 2 were both expressed within the cerebellar cortex, and, because it has been suggested that they are functionally different, we investigated whether isoforms 1 and 2 were both able to inhibit neurite outgrowth. Transfecting the two isoforms in P19 cells revealed a prominent equal increase in merlin expression (Fig. 6G). Both isoforms induced a significant decrease in the outgrowth of neuron-like processes, with a tendency for isoform 2 to be slightly more potent than isoform 1 (Fig. 6H). This was also true for the neurite/cell ratio and the axon/cell ratio (neurite/cell ratio: isoform 1, 0.29; isoform 2, 0.20; Student's t test, p < 0.001; axon/cell ratio: isoform 1, 0.15; isoform 2, 0.11; p = 0.006, n > 700). As for the number of process-bearing cells, the length of neurites significantly decreased in Nf2-transfected cells by 19% (isoform 1) and 30% (isoform 2) (Fig. 6I) (Student's t test, p < 0.01; n > 1000).
To prove the relevance of the activity of merlin on neurite formation, we prepared dissociated primary cultures of cerebellar and forebrain tissue. We compared neurite formation of control-treated primary neuronal cultures expressing low levels of endogenous merlin with cultures that were transfected with a flag-tagged version of merlin (Fig. 7A). We counted the number of MAP-2-positive neurites per cell and measured the mean neurite length of these processes. Dissociated cerebellar cells overexpressing merlin showed a highly significant reduction in both the number of neurites per cell (control, 6.19 ± 0.23; nf2, 2.18 ± 0.15; p < 0.01, Student's t test) and in the length of cellular neurites (control, 61 ± 3 μm; nf2, 20 ± 1 μm; p < 0.01, Student's t test) compared with control cells (Fig. 7B,C). A similar reduction of neurite/cell ratio and neurite length was also observed in cultured forebrain neuron after merlin overexpression (neurite/cell ratio: control, 6.00 ± 0.29; nf2, 2.28 ± 0.24; neurite length: control, 58 ± 4 μm; nf2, 25 ± 2 μm). When merlin expression was reduced by transfecting nf2-specific siRNAs into cerebellar cells, the neurite/cell ratio and the neurite length increased significantly (neurites per cell: scr, 5.83 ± 0.21; si-nf2, 8.15 ± 0.30; neurite length: scr, 58 ± 2 μm; si-nf2, 79 ± 3 μm) (Fig. 7B,C). These results taken together indicate that merlin reduces neuritogenesis in neuron-like cell lines as well as in dissociated neuronal cultures.

Process formation in merlin-overexpressing and merlin-deficient dissociated primary neurons of the murine cerebellum. Cultures of cerebellar tissue (A) were transfected with the Nf2 coding sequence tagged with flag (nf2-flag), the nf2-specific siRNA (si-nf2), or the appropriate control nucleic acids [a control vector driving EGFP expression (crtl) and an unspecific RNA sequence (scr)]. Cultures were stained for flag (nf2-flag) or MAP-2 (crtl, scr, si-nf2). Cells in A clearly show a reduction in neurite formation when merlin was overexpressed. Scale bar, 50 μm. Bar charts are given in B for the evaluation of the neurite/cell ratio and in C for measurements of the neurite length (mean ± SEM) after merlin overexpression and repression. Asterisks mark highly significant differences to control conditions as obtained by Student's t test (**p < 0.001; n > 70).
Merlin phosphorylation is important for its effect on neurite outgrowth
To experimentally address the issue of whether the phosphorylation status of serine 518 of merlin is important for neurite outgrowth as it is for growth regulation, we transfected a constitutively active version of merlin into P19 cells (merlin 518A, in which serine was replaced by alanine, preventing phosphorylation of merlin) and a version mimicking phosphorylation by replacing serine with aspartate (merlin 518D). Although both versions were equally overexpressed in P19 cells (Fig. 8A, NF2 blot), only the 518D version showed an intensive staining with a phosphorylation-specific antibody, suggesting that the 518D version indeed mimics a phosphorylated conformation (Fig. 8B, P-NF2). Measuring the neurite/cell ratio, only the active version of merlin (518A) showed a significant decrease in neurite outgrowth, whereas the phosphorylation-mimicking version showed no difference to a control experiment (Fig. 8C). These results indicate that merlin activity regarding inhibition of neurite outgrowth is clearly dependent on dephosphorylation of serine 518 in differentiated P19 cells.

Signaling mechanisms involved in effect of merlin on neurite outgrowth. Transfection of retinoic acid-treated P19 cells with merlin mutated at serine 518 to either aspartate (518D) or alanine (518A) revealed high levels of merlin in protein extracts (Western blot, A). A phosphorylation-specific antibody only revealed an increase in 518D transfected cells, consistent with an overexpression of a phosphorylation-mimicking mutant. In contrast to the 518D version, overexpression of the 518A mutant caused a highly significant decrease on neurite formation in P19 cells (**p < 0.01; n > 700; Student's t test). Using a pulldown assay, activated Rac (Rac–GTP) was diminished in merlin-overexpressing P19 cells (D), whereas total amounts of Rac and actin were comparable in merlin-transfected and empty-vector-transfected cells (crtl). When decreasing the amount of merlin in P19 cells by siRNA transfection, the Rac–GTP level was increased (E). In contrast to the Rac pulldown assay, the amount of activated Cdc42 (Cdc42–GTP) was not changed in merlin-overexpressing P19 cells (iso1) compared with control cells (crtl; F).
Merlin interferes with the Rac signaling pathway
Merlin interferes with several signaling pathways, among which the Rac and Cdc42 pathways have been well described (Shaw et al., 2001; Morrison et al., 2007). We tested whether overexpression of merlin would interfere with the activation of either Rac and/or Cdc42. Using affinity precipitations, merlin overexpression reduced the amount of activated Rac by 53%, whereas total amounts of Rac and actin were unchanged in P19 cells [ratio of Rac/GTP in nf2-overexpressing vs control cells: 0.47 ± 0.06 (mean ± SD; n = 3) after densitometric evaluation of Western blots] (Fig. 8D). When merlin expression was diminished by transfecting nf2-specific siRNA into P19 cells, the ratio of Rac/GTPsiRNA versus Rac/GTPscrRNA was increased (3.0 ± 0.6, mean ± SD; n = 2) (Fig. 8E). In contrast, the amount of activated Cdc42 was unchanged in merlin-overexpressing cells (Fig. 8F). We can thus conclude that Rac, but not Cdc42, is likely a member of the signaling machinery of merlin in neurite outgrowth.
Discussion
Merlin was originally identified as a tumor suppressor and as such has been primarily analyzed within the context of proliferation and malignant transformation through regulation of small GTPases (McClatchey and Giovannini, 2005; Morrison et al., 2007). Observations in schwannomas have pointed out an effect of merlin on cell morphology in which merlin levels have been associated with cell sprouting, motility, and membrane ruffling (Pelton et al., 1998; Gutmann et al., 1999). We can now provide evidence that merlin plays a role in controlling the neuronal wiring in the developing CNS. Although Yamauchi et al. (2008) observed that merlin facilitated neurite outgrowth in neuroblastoma cells, we report here that merlin acts to negatively regulate neuritogenesis in terminally differentiated neurons. We document the developmental correlation of merlin expression and dendritogenesis in wild-type mice and in a mutant that exhibits a specific disruption of PC dendrite formation. Furthermore, we provide evidence for a direct effect of merlin on neuritogenesis in P19 cells, and we demonstrate that merlin also inhibits neurite outgrowth in primary dissociated cultures. We can further clarify that this effect is dependent on merlin phosphorylation status and that merlin can inhibit the activity of the small GTPase Rac, a signaling pathway known to function in regulating dendritic morphogenesis. The developmentally regulated phosphorylation of merlin in vivo suggests that this regulatory mechanism is also active in situ.
Merlin affects cell morphology
The developmentally regulated expression of merlin protein documented here is consistent with previous reports describing expression of its mRNA (Claudio et al., 1995; Gutmann et al., 1995; den Bakker et al., 1999). Our data extend these previous studies by also documenting a developmentally regulated redistribution of merlin within differentiating neurons, in particular PCs. Early postnatally, somata, dendrites, and, to some extent, PC axons were shown to be merlin immunopositive. During this period of differentiation, PCs retract a complex network of radially oriented primary processes and form a single stem dendrite. Within the early second postnatal week, dendritic and somatic expression declined. This coincides with an extensive branching activity of dendrites that, at this time, grow radially toward the pial surface (Sotelo and Dusart, 2009). Merlin was highly expressed during a phase of PC differentiation in which PC primary dendrites regress before terminal dendrites form, suggesting a negative effect of merlin on dendrite formation. A suppressive role of merlin in dendritogenesis is further supported by our observation that PCs of L7En-2 transgenic animals, which show a well characterized delay of dendritogenesis (Jankowski et al., 2004), expressed elevated levels of merlin during the critical period of delayed dendrite formation. These in vivo observations indicate that merlin expression profoundly represses neurite outgrowth in neuronally differentiated P19 cells and neurons of primary dissociated cultures. Because various types of neurons in cerebellar and forebrain cultures were found to behave in the same way, merlin may regulate neurite growth ubiquitously within the CNS.
We compared the neuritogenic effects of merlin isoforms 1 and 2, which have been described to differ in their C terminus and their capability to form intramolecular bridges (Gonzalez-Agosti et al., 1999). Both isoforms repressed neurite formation comparably, suggesting that the signaling mechanism controlling neurite outgrowth is independent of merlin self-association. In contrast, the influence of merlin on neuritogenesis in vitro was critically regulated by the phosphorylation status of merlin, which was originally observed for the effect of merlin on glia cell proliferation and tumor suppression (Jin et al., 2006). A molecular variant engineered to lack the critical phosphorylation site (serine 518 to alanine) was highly effective in suppressing neuritogenesis, whereas a variant with a negatively charged substitution at position 518 (serine to aspartate), mimicking permanent phosphorylation, was not active. The observation that the phosphorylation of merlin is developmentally regulated in the intact brain provides a first indication that this mechanism is actually active in situ.
Regulation of the level of merlin and regulation of its phosphorylation are in fact two attractive novel molecular targets to fine-tune dendritogenesis. Merlin is known to bind the actin and microtubule cytoskeleton and to do so in a phosphorylation-dependent manner (Shaw et al., 2001; Muranen et al., 2007). Studies on merlin–actin interactions have indicated that merlin prevents filamentous actin disassembly (James et al., 2001). Because active and dynamic actin turnover has been associated with neurite extension (Bradke and Dotti, 1999), actin stabilization through lateral association is consistent with, and may be mechanistically related to, the inhibition of neurite outgrowth by merlin. Moreover, critical regulators upstream of the dynamic actin cytoskeleton are the Rho family of small GTPases. In maturing neurons, the small GTPase Rac is already known to be required for dendrite formation and maintenance. Our observation that merlin negatively regulated Rac activity indicates that merlin may restrict neurite outgrowth during controlled PC dendrite regression by inhibiting Rac activity.
Although merlin obviously interacts with and controls the cytoskeleton, it also integrates signals from growth factors and adhesion molecules localized at the plasma membrane (Morrison et al., 2001; McClatchey and Fehon, 2009). Many growth factors and adhesion molecules transmit their effect by phosphorylating intracellular mediators. Merlin is expressed in a primarily active, hypophosphorylated form during the initial phase of PC dendritogenesis, when immature process formation is suppressed (Sotelo and Dusart, 2009). In contrast, later in development, merlin is hyperphosphorylated and inactive when dendrite arborization takes place. The phosphorylation state of merlin and consequent activity concerning proliferation control is known to be regulated by, for example, the kinase PAK2 (Kissil et al., 2002) and myosin phosphatase (MYPT-1–PP1δ) (Jin et al., 2006). Both PAK2 and MYPT-1–PP1δ are expressed in cerebellar PCs (Allen Brain Library, Seattle, WA) (our unpublished observations) (Lontay et al., 2004). Our present data suggest a scenario in which merlin could function as a context-dependent signal integrator that links a cell-intrinsic genetic program for developmental neuritogenesis to environmental signaling. Such a control of process formation is a sine qua non for the building of proper neuronal circuits.
Potential clinical implications
Taking all of our observations together, we postulate that the tumor suppressor protein merlin has a regulatory function in neurite formation. As shown for cerebellar PCs, merlin plays a restrictive role in developing and mature neuronal processes and thus counteracts the many known positive regulators of dendrite formation (Jan and Jan, 2003). In addition, by mediating positive and negative signals on dendritogenesis via its phosphorylation status, merlin may also support the stability of already established neuronal processes or even spines and thus impact synaptic communication within the CNS. Synaptic strength again is closely associated with the normal function of the CNS and peripheral nervous system, and alterations in synaptic communication are supposed to cause psychiatric pathologies and learning deficits. Furthermore, clinical findings suggest that merlin provokes axonopathy in NF2 patients lacking normal expression, indicating functions beyond Schwann cell growth control in the CNS (Hagel et al., 2002). It is interesting to note that recently En-2 mutations have been linked to the autistic spectrum disorder (Gharani et al., 2004; Benayed et al., 2005). As shown here, En-2 affects merlin expression, and Nf2 mutations have again been linked to autism (Wassink et al., 2004). Furthermore, autistic patients frequently show a reduced PC size, which is caused by a reduced elaboration of the dendritic tree (Fatemi et al., 2002). This observation directly links the function of merlin in establishing a functional neuronal network to a psychiatric disorder of increasing prevalence and socioeconomic importance.
Footnotes
- Received February 16, 2010.
- Revision received May 31, 2010.
- Accepted June 16, 2010.
This work was supported by German Research Foundation Grant SFB 604 (H.M.) and Deutsche Krebshilfe Grant 107089 (H.M.). We thank Manuela Schwalbe and Alice Ihmer for their expert technical assistance and Daniela Hupfer and Franz Neuhalfen for their skilled breeding and husbandry of animals. We are also very grateful for the critical reading of this manuscript by Christoph Redies and Karl Schilling.
- Correspondence should be addressed to either of the following: Dr. Helen Morrison, Institute of Age Research, Fritz Lipmann Institute, Beutenbergstraße 11, D-07745 Jena, Germany, helen{at}fli-leibniz.de; or Dr. Stephan L. Baader, Institute of Anatomy, Anatomy and Cell Biology, University of Bonn, Nussallee 10, D-53115 Bonn, Germany, sbaader{at}uni-bonn.de
- Copyright © 2010 the authors 0270-6474/10/3010177-10$15.00/0