
Abstract
Sleep and sleep intensity are enhanced by adenosine and its receptor agonists, whereas adenosine receptor antagonists induce wakefulness. Adenosine kinase (ADK) is the primary enzyme metabolizing adenosine in adult brain. To investigate whether adenosine metabolism or clearance affects sleep, we recorded sleep in mice with engineered mutations in Adk. Adk-tg mice overexpress a transgene encoding the cytoplasmic isoform of ADK in the brain but lack the nuclear isoform of the enzyme. Wild-type mice and Adk+/− mice that have a 50% reduction of the cytoplasmic and the nuclear isoforms of ADK served as controls. Adk-tg mice showed a remarkable reduction of EEG power in low frequencies in all vigilance states and in theta activity (6.25–11 Hz) in rapid eye movement (REM) sleep and waking. Adk-tg mice were awake 58 min more per day than wild-type mice and spent significantly less time in REM sleep (102 ± 3 vs 128 ± 3 min in wild type). After sleep deprivation, slow-wave activity (0.75–4 Hz), the intensity component of non-rapid eye movement sleep, increased significantly less in Adk-tg mice and their slow-wave energy was reduced. In contrast, the vigilance states and EEG spectra of Adk+/− and wild-type mice did not differ. Our data suggest that overexpression of the cytoplasmic isoform of ADK is sufficient to alter sleep physiology. ADK might orchestrate neurotransmitter pathways involved in the generation of EEG oscillations and regulation of sleep.
Introduction
The neuromodulator adenosine plays a key role in sleep regulation (Radulovacki, 1985; Benington and Heller, 1995; Basheer et al., 2004; Datta and Maclean, 2007; Huang et al., 2007; Scharf et al., 2008). Adenosine and adenosine receptor agonists enhance non-rapid eye movement (NREM) and rapid eye movement (REM) sleep (Marley and Nistico, 1972; Haulică et al., 1973; Snyder et al., 1981; Virus et al., 1983; Radulovacki et al., 1985; Sarda et al., 1986; Martin et al., 1989; Ticho and Radulovacki, 1991; Portas et al., 1997). Moreover, the adenosine agonist cyclopentyladenosine enhanced EEG slow-wave activity (SWA) (power between 0.75 and 4 Hz) (Benington et al., 1995; Schwierin et al., 1996). Adenosine receptor antagonists (caffeine, cyclopentyltheophylline) induce wakefulness (Yanik et al., 1987; Biaggioni et al., 1991; Landolt et al., 1995; Schwierin et al., 1996; Huang et al., 2005). The effects of adenosine on sleep are mediated by adenosine A1 (Basheer et al., 2001; Thakkar et al., 2003; Alanko et al., 2004; Bjorness et al., 2009) and A2A receptors (Hayaishi et al., 2004). Inhibition of gliotransmission attenuated the accumulation of sleep pressure through A1 receptors (Halassa et al., 2009).
Despite its ubiquitous presence, some studies indicated a role of adenosine in sleep in specific brain regions. The basal forebrain was suggested to gate sleep via adenosinergic inhibition of wake-promoting cholinergic neurons (Porkka-Heiskanen et al., 1997, 2000; Strecker et al., 2000). However, stimulation of adenosine receptors in other regions (e.g., hypothalamus) also induced sleep (Satoh et al., 1998, 1999; Scammell et al., 2001; Gallopin et al., 2005; Methippara et al., 2005; Oishi et al., 2008).
A little explored avenue in sleep is the in vivo manipulation of adenosine kinase (ADK), the primary enzyme regulating adenosine metabolism in rodents (Mathews et al., 1998; Boison, 2006). Inhibition of ADK activity induced a larger adenosine increase in hippocampal and cortical slices than adenosine deaminase inhibition (Pak et al., 1994; Lloyd and Fredholm, 1995; White, 1996). Moreover, adenosine release was higher in ADK-deficient fibroblasts compared with adenosine deaminase-deficient fibroblasts (Huber et al., 2001). Sleep deprivation (SD) had no effect on ADK activity in the cortex and basal forebrain, but the diurnal variation of ADK activity (Chagoya de Sánchez et al., 1993; Alanko et al., 2003) was maximal in the cortex (Mackiewicz et al., 2003).
Here, we used mice constitutively overexpressing a transgene for the cytoplasmic isoform of Adk (Adk-tg). These mutants are characterized by increased ADK enzyme activity and reduced adenosine tone in the brain (Fedele et al., 2005). Based on the reduced adenosine tone, mutants display spontaneous intrahippocampal seizures (Li et al., 2007, 2008a,b), increased susceptibility to stroke or seizure-induced neuronal cell death (Pignataro et al., 2007), and cognitive impairment (Yee et al., 2007). We hypothesized that the transgene overexpression in Adk-tg mice should affect sleep. As controls, we chose Adk+/− mice, which have reduced ADK in the liver, but normal adenosine metabolites (Boison et al., 2002) and wild-type (WT) littermates. The mice were subjected to 6 h SD to stimulate sleep regulatory mechanisms.
Materials and Methods
Animals.
Adult heterozygous male mice originating from a targeted disruption of the Adk-gene (Adk+/−), maintained on a mixed 129/JEms × C57BL/6 background (for characterization, see Boison et al., 2002), and WT littermates were obtained by heterozygous breeding (n = 15 Adk+/−; n = 14 WT mice). Mice overexpressing the cytoplasmic isoform of ADK were derived by rescuing the lethal phenotype of Adk−/− mice by introducing a UbiAdk transgene into the Adk−/− background (Fedele et al., 2005) and maintained by homozygous breeding of Adk-tg mice (n = 11). The mice were kept individually in Macrolon cages (36 × 20 × 35 cm) with food and water available ad libitum, maintained on a 12 h light/dark cycle (∼30 lux; light onset at 8:00 A.M.) at 23°C ambient temperature. The Cantonal Veterinary Office of Zurich approved all experimental procedures.
Surgery: EEG/EMG electrode implantation.
Mice were implanted epidurally with gold-plated miniature screws (0.9 mm diameter) for EEG recording under isoflurane anesthesia [right hemisphere: above the frontal (FRO), 1.5 mm anterior to bregma, 2 mm lateral to the midline, and the parietal cortex (PAR), 2 mm posterior to bregma, 3 mm lateral to midline; reference: above the cerebellum, 2 mm posterior to lambda, on the midline]. Two gold wires (0.2 mm diameter) were inserted bilaterally into the neck muscles for EMG recording. The electrodes were connected to stainless-steel wires fixed to the skull with dental acrylic cement. The mice were connected by a fine cable to a swivel and remained connected throughout the experiment. At least 3 weeks were allotted for recovery from surgery and a minimum of 3 d for habituation to the recording chambers before data collection.
Experimental protocols.
Recordings were performed during a 24 h baseline followed by 6 h SD starting at light onset and 18 h recovery. SD was performed by directly observing the mice and introducing new material into the cage (e.g., nesting material, wood or cardboard pieces) whenever a mouse appeared to be drowsy. If necessary, acoustic stimulation was used by gentle tapping on the cage (Tobler et al., 1997). Special care was taken not to interfere with eating and drinking behavior. Data were collected from frontal and parietal EEG derivations, because slow waves and spindles in NREM sleep are more prominent in the frontal EEG, whereas theta activity in waking and REM sleep is prominent in the parietal EEG.
A separate batch of Adk-tg (n = 12) and WT mice (n = 11) were placed in single cages equipped with an infrared sensor mounted above the cage for undisturbed, continuous motor activity recordings for 10 consecutive days (Chronobiology kit; Stanford Software Systems).
Data acquisition and analysis.
The EEG and EMG signals were amplified (amplification factor, ∼2000), conditioned by analog filters (high-pass filter: −3 dB at 0.016 Hz; low-pass filter: −3 dB at 40 Hz, less than −35 dB at 128 Hz) sampled with 512 Hz, digitally filtered [EEG: low-pass finite impulse response (FIR) filter, 25 Hz; EMG: bandpass FIR filter, 20–50 Hz], and stored with a resolution of 128 Hz. The EEG power spectra were computed for 4 s epochs by a fast Fourier transform routine. Adjacent 0.25 Hz bins were averaged into 0.5 Hz (0.25–5 Hz) and 1.0 Hz (5.25–25 Hz) bins. The EMG was full-wave rectified and integrated over 4 s epochs; ambient temperature within the animal cage was sampled at 4 s intervals. Before each recording, the EEG and EMG channels were calibrated with a 10 Hz, 300 μV peak-to-peak sine wave.
The three vigilance states NREM sleep, REM sleep, and waking were determined off-line by visual inspection of the parietal and frontal EEG, EMG records and EEG power in the slow-wave range (0.75–4 Hz) for 4 s epochs. Epochs containing EEG artifacts in one derivation were excluded from spectral analyses of both EEG derivations (6.3 ± 0.6% of recording time, which occurred mainly during active waking). Vigilance states could always be determined. The frequency and duration of vigilance state episodes was computed using the methods of Deboer et al. (1994). Sleep continuity was assessed by determining the number of brief awakenings (episodes of waking, <16 s) (Deboer et al., 1994). The time course of SWA (0.75–4 Hz), spindle frequency activity (SFA) (10.25–15 Hz), and theta activity (6.25–9 Hz) for 2 min before and after the transition from waking or REM sleep to NREM sleep or from NREM sleep to REM sleep was computed as previously (Franken et al., 1994). Data analysis was performed using the MATLAB software package (The MathWorks).
Western blot analysis.
We determined protein levels of ADK in brains of Adk-tg, Adk+/−, and WT mice that had been used for sleep recordings (n = 6 mice per genotype). Brain tissue from the right hemispheres was processed for aqueous protein extracts as previously described (Gouder et al., 2004). Cell extracts were resuspended, each containing 40 μg proteins, and electrophoresed in a 10% Tris-glycine gel. After blotting, the membranes were incubated with polyclonal rabbit antiserum against ADK (1:5000) and processed as described previously (Gouder et al., 2004). The membranes were then developed by incubation with peroxidase-conjugated anti-rabbit antibody (7074; 1:8000; Cell Signaling). Immunoblots were quantified using a Kodak Scientific Imaging System (version 3.6.5.k2; Kodak). To normalize ADK immunoreactivity, a mouse monoclonal anti-α-tubulin antibody (sc-8035; 1:5000; Santa Cruz) was reprobed on the same blot and the OD ratio of ADK/α-tubulin was calculated.
Statistical analysis.
Genotype differences were evaluated by linear mixed model ANOVA, corrected for multiple comparison when appropriate, or by a repeated-measures ANOVA (SAS software; SAS Institute). Post hoc paired and unpaired t test or the Tukey–Kramer, Bonferroni, and Kruskal–Wallis tests were performed if the results of the ANOVA reached statistical significance (p < 0.05). All reported values are means over 6–15 mice ± SEM.
Results
Overexpression of Adk affects the EEG and impairs sleep regulation
We previously demonstrated reduced adenosinergic tone in Adk-tg mice (Fedele et al., 2005) that was subsequently validated in several experimental paradigms (Li et al., 2007, 2008a,b; Pignataro et al., 2007; Yee et al., 2007). We therefore hypothesized that this genetic modification would affect sleep.
EEG power spectra
A statistically significant reduction of EEG power density was observed in the frequencies <4 Hz in all vigilance states in Adk-tg mice compared with WT mice (Figs. 1, 2). In addition, in REM sleep and waking, EEG power was significantly lower in the Adk-tg mice in the frequencies encompassing the theta band (6.25–11 Hz) (Fig. 1).
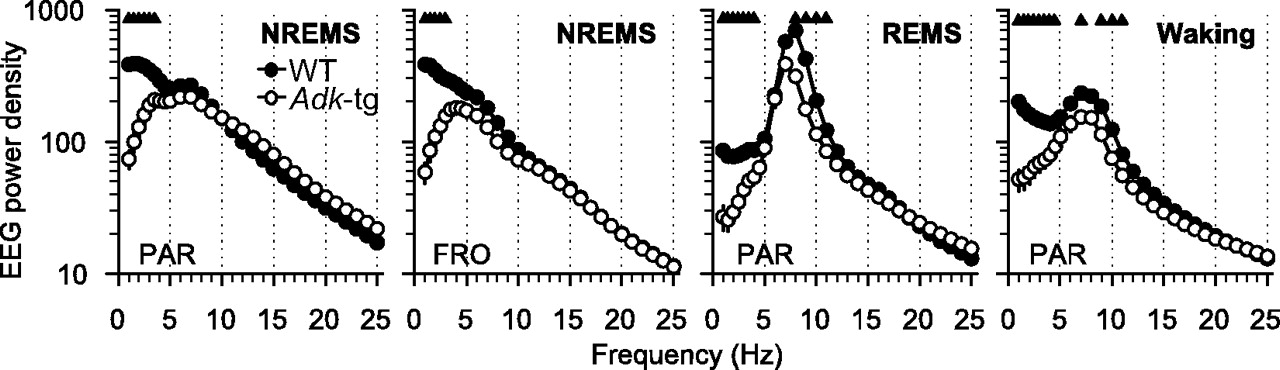
EEG power density in microvolt square per hertz (0.75–25 Hz) in NREM sleep (NREMS), REM sleep (REMS), and waking in WT (black dots; n = 14) and Adk-tg mice (white dots; n = 11) during the 24 h baseline. Shown are the mean values of the parietal (PAR) and frontal (FRO) EEG. Triangles, Genotype differences (p < 0.05 for NREMS PAR and waking; p < 0.01 for NREMS FRO and REMS; Bonferroni's adjustment for multiple comparisons).

Representative 5 s raw parietal EEG and EMG traces during NREM sleep, REM sleep, and waking in WT, Adk+/−, and Adk-tg mice.
Baseline sleep
Adk-tg mice slept ∼60 min less than WT mice in the dark period (Table 1; Fig. 3, left). The duration of their waking and NREM sleep episodes was significantly longer than in WT mice, whereas their total episode number was lower, indicating more consolidated sleep in Adk-tg mice (Table 2). The relative number of longer NREM sleep episodes (>128 s) was higher in Adk-tg mice compared with WT mice at the cost of shorter (36–64 s) episodes (Fig. 4, left) (p < 0.005, Tukey–Kramer test). Sleep fragmentation (defined as the occurrence of waking episodes <16 s per hour of sleep) differed between the genotypes (Adk-tg, 20.1 ± 1.3; WT, 24.7 ± 1.5; p = 0.039, unpaired t test).
Amount of vigilance states

Time course of the vigilance states NREM sleep, REM sleep, waking, and REM sleep as percentage of total sleep time (REMS/TST) in WT and Adk-tg mice during the 24 h baseline (BL) (left panels) and 18 h recovery (Rec.) (right panels) after 6 h SD (gray area). Shown are mean 2 h values. Triangles, Genotype differences (p < 0.05, unpaired t test; ANOVA “genotype” by repeated “2 h interval”: NREMS BL, F(11,253) = 5.67, p < 0.0001, and Rec., F(8,184) = 2.14, p = 0.034; REMS BL, F(11,253) = 2.54, p = 0.0046, and Rec., F(8,184) = 1.81, p = 0.078, “genotype” F(1,23) = 26.82, p < 0.0001, followed by Tukey–Kramer “genotype” p < 0.0001; REMS/TST BL, F(11,253) = 1.14, p = 0.33, “genotype” F(1,23) = 20.96, p = 0.0001 followed by Tukey–Kramer “genotype” p < 0.0001, and Rec., F(8,184) = 2.04, p = 0.0437; waking BL, F(11,253) = 5.25, p < 0.0001, and Rec., F(8,184) = 1.91, p = 0.06).
Frequency and duration of vigilance state episodes

Left, Number of NREM sleep episodes in WT (n = 14) and Adk-tg mice (n = 11) during the 24 h baseline. Mean values are expressed as percentage of the total number of NREM sleep episodes. Numbers below the x-axis are duration range in seconds. Triangles, Genotype differences (p < 0.005, Tukey–Kramer; ANOVA “genotype” by “episode duration” F(1,7) = 14.02, p < 0.0001). Right, Activity intensity (defined as infrared counts/number of 1 min epochs with counts >0; mean 1 h values; average of 10 consecutive baseline days) in WT (n = 11) and Adk-tg mice (n = 12). Triangles, Genotype differences (p < 0.05, unpaired t test; ANOVA “genotype” by repeated “1 h interval” F(23,483) = 4.32, p < 0.0001).
The amount of REM sleep as well as REM sleep per total sleep time was reduced in Adk-tg mice (Table 1; Fig. 3, left) because of a decreased REM sleep episode frequency (Table 2) (p = 0.0041, unpaired t test).
Motor activity data obtained in a separate group of Adk-tg and WT mice corroborated the sleep findings. Adk-tg mice spent more time active in the dark period (12 h dark: 328.8 ± 11.3 vs 268.5 ± 9.1 min; p = 0.0017, unpaired t test). The intensity of their movements (activity counts per minute) was also significantly higher compared with WT mice (Fig. 4).
In summary, during baseline, sleep and EEG power in frequencies encompassing SWA in NREM sleep and theta activity in waking and REM sleep were reduced in Adk-tg mice.
Effects of enhanced sleep pressure by 6 h SD
During recovery after SD, Adk-tg and WT mice showed the typical compensatory increase of NREM sleep with a concomitant reduction in waking (Table 1, Fig. 3). However, the NREM sleep increase was significantly larger in the Adk-tg mice in hours 7–12 (Table 1). The REM sleep rebound was delayed to the second 6 h recovery interval in all mice (Table 1). Although the baseline genotype differences in REM sleep persisted during recovery (Fig. 3), the response to SD was similar in Adk-tg and WT mice (recovery-baseline, 6 h intervals 1–3: −1.9 ± 1.2 vs −1.5 ± 1.1 min, p = 0.81; 8.9 ± 1.5 vs 9.2 ± 1.4 min, p = 0.88; 1.8 ± 1.5 vs 3.2 ± 2.0 min, p = 0.56, unpaired t test, in WT vs Adk-tg mice, respectively).
SWA and slow wave energy
We hypothesized that, after SD, mice overexpressing ADK would display a reduced increase in SWA. Accordingly, sleep intensity was significantly lower in Adk-tg mice compared with WT mice (Fig. 5A). The magnitude of the typical SD-induced initial increase in SWA was not only lower by 9–12% in Adk-tg mice (first 2 h interval: p < 0.01, unpaired t test, for PAR and FRO EEG), but SWA remained lower in Adk-tg mice throughout the entire recovery period in both EEG derivations (Fig. 5A). Although baseline levels were attained by all mice after 4–6 h recovery, only Adk-tg mice showed a subsequent negative rebound below baseline. The genotype SWA difference in NREM sleep was also evident at the transitions from waking to NREM sleep during the first 6 h recovery interval (Fig. 5B). The increase (i.e., buildup) of SWA in Adk-tg mice was significantly lower compared with WT mice immediately after the transitions and remained below the WT increase throughout the 2 min NREM sleep episodes. During the corresponding baseline interval, the dynamics of SWA buildup had been similar in the two genotypes (Fig. 5B). All genotype differences dissipated in the second 6 h recovery interval.

A, Time course of SWA in NREM sleep in the parietal (PAR) and frontal (FRO) EEG in WT and Adk-tg mice during 18 h recovery after 6 h SD (gray area). Mean 2 h values are expressed as percentage of the mean 24 h baseline SWA in NREM sleep of the corresponding EEG. Genotype differences (p < 0.001, Tukey–Kramer; ANOVA “genotype” F(1,24) = 29.04, p < 0.0001 for PAR, and F(1,24) = 14.23, p < 0.0009 for FRO; interaction “genotype” by “2 h interval” F(8,183) = 1.06, p = 0.39 for PAR, and F(8,183) = 1.55, p = 0.14 for FRO). Differences from corresponding baseline interval in Adk-tg (open squares below the curves; p < 0.05, paired t test; ANOVA “condition” by “2 h interval” F(8,180) = 32.81 and 46.08, p < 0.0001 for PAR and FRO, respectively) and WT mice (filled squares; p < 0.0001, paired t test; F(8,234) = 48.32 and 46.76, p < 0.0001 for PAR and FRO). B, Time course of SWA during the 2 min before and after transitions from waking to NREM sleep. Mean 20 s values computed for the first 6 h interval after SD and the corresponding baseline interval are expressed as percentage of the mean 24 h baseline SWA in NREM sleep. Triangles, Genotype differences during recovery (p < 0.05, unpaired t test; ANOVA “genotype” by “20 s epoch”: F(11,252) = 2.01, p = 0.0276 for PAR, and F(11,252) = 2.73, p = 0.0024 for FRO).
We computed slow-wave energy (SWE) (0.75–4 Hz), which takes into account the difference in the amount of NREM sleep between genotypes. Despite the larger amount of NREM sleep, Adk-tg mice reached a significantly lower SWE level after 18 h recovery compared with WT mice in the parietal EEG (82.1 ± 1.3 vs 87.5 ± 1.8%; p = 0.034, unpaired t test). Significance was not attained in the frontal EEG because of larger interindividual variability (82.2 ± 1.9 vs 87.9 ± 2.2%; p = 0.072).
SFA
Slow waves and spindles are EEG hallmarks of NREM sleep, the latter being most prominent at the transition from NREM sleep to REM sleep (Franken et al., 1994; Vyazovskiy et al., 2004). Spindle density and SWA in NREM sleep show interrelated dynamics in rats and humans (Aeschbach et al., 1997; Vyazovskiy et al., 2004). In addition to the reduced levels of SWA attained by Adk-tg mice, the typical surge of SFA immediately before the NREM–REM sleep transitions was significantly reduced in Adk-tg mice during baseline (Fig. 6) and recovery (data not shown) compared with WT mice.

Time course of specific frequency bands during the 2 min before and after transitions from NREM to REM sleep in WT and Adk-tg mice. SFA (10.25–15 Hz) in the frontal EEG (left panel) and theta frequency activity (7.25–11 Hz) in the parietal EEG (right panel). Mean 20 s values for the 24 h baseline are expressed as percentage of the mean 24 h baseline SFA or theta activity in NREM sleep. Triangles, Genotype differences (SFA, p < 0.0005, unpaired t test; ANOVA “genotype” by “20 s epoch”: F(11,252) = 10.64 and 41.49, p < 0.0001 for SFA and theta activity, respectively).
Overall, Adk-tg mice showed a reduced homeostatic response to enhanced sleep pressure compared with WT mice.
Theta peak frequency in REM sleep was lower in Adk-tg mice
Oscillations in the theta frequency range are a distinct feature of REM sleep in rodents (Figs. 1, 2) (Huber et al., 2000). REM sleep EEG spectra were significantly lower in the theta frequency range in Adk-tg mice compared with WT mice. Based on the significant bins in Figure 1 (7.25–11 Hz), we investigated whether EEG power would be affected at the transitions from NREM to REM sleep. Adk-tg mice lacked the typical, prominent increase in theta activity after the transitions to REM sleep (Fig. 6). Their theta activity levels were significantly lower than those of WT mice 20 s before the transitions and remained at a consistently low level after the transitions to REM sleep (the result was similar when the time course of the traditional theta frequency band, 6.25–9 Hz, was computed).
Adenosine is directly linked to energy metabolism in the cell (Scharf et al., 2008) and the peak frequency of theta in REM sleep was affected by a deficiency in energy metabolism (Tafti et al., 2003). We determined the peak frequency within the theta frequency band for individual mice. In Adk-tg mice, the peak was at a significantly lower frequency than in WT mice (7 ± 0.1 Hz vs 8 ± 0.1 Hz; p < 0.0001, unpaired t test).
Effects of Adk overexpression on EEG power during induced wakefulness
To investigate whether the genotype differences in the response to SD were attributable to behavioral differences during SD, we analyzed the corresponding EEG spectra (Fig. 7). The typical increase in EEG power in the course of SD was observed for a large frequency range (0.75–8 Hz) in both genotypes and in higher frequencies (13–15 Hz; p < 0.05, paired t test) in Adk-tg mice. The rise rate of EEG power (interval 3 as percentage of interval 1) differed between the two genotypes in frequencies within the SWA band, theta activity, and SFA (Fig. 7). The increase in the 2.25–3.5 Hz band was apparent in all mice (interval 1 vs 3: p < 0.0005), but the rise rate was significantly lower in the Adk-tg mice (p = 0.0487, Kruskal–Wallis test). Theta activity was significantly higher in Adk-tg mice than in WT mice throughout SD (rise rate, p = 0.0004, unpaired t test). SFA increased in the course of SD in Adk-tg mice only (p = 0.044, paired t test) but was significantly lower during the first two 2 h intervals compared with WT mice (rise rate, p = 0.0455, unpaired t test).

Time course of EEG power in waking in three frequency bands in the parietal EEG of WT and Adk-tg mice during the 6 h SD (gray area) and first 6 h recovery. Mean 2 h values are expressed as percentage of the mean 24 h baseline power in the corresponding frequency band in waking. Triangles, Genotype differences (p < 0.05, unpaired t test; ANOVA “genotype” by “2 h interval” F(5,114) = 2.46, p = 0.037, for 2.25–3.5 Hz band, F(5,114) = 15.67 and 6.95, p < 0.0001, for 6.25–9 and 11.25–15 Hz band, respectively). Asterisks, Difference between the first and last 2 h SD interval (p < 0.05, paired t test).
Reduced expression of Adk has no major effect on sleep
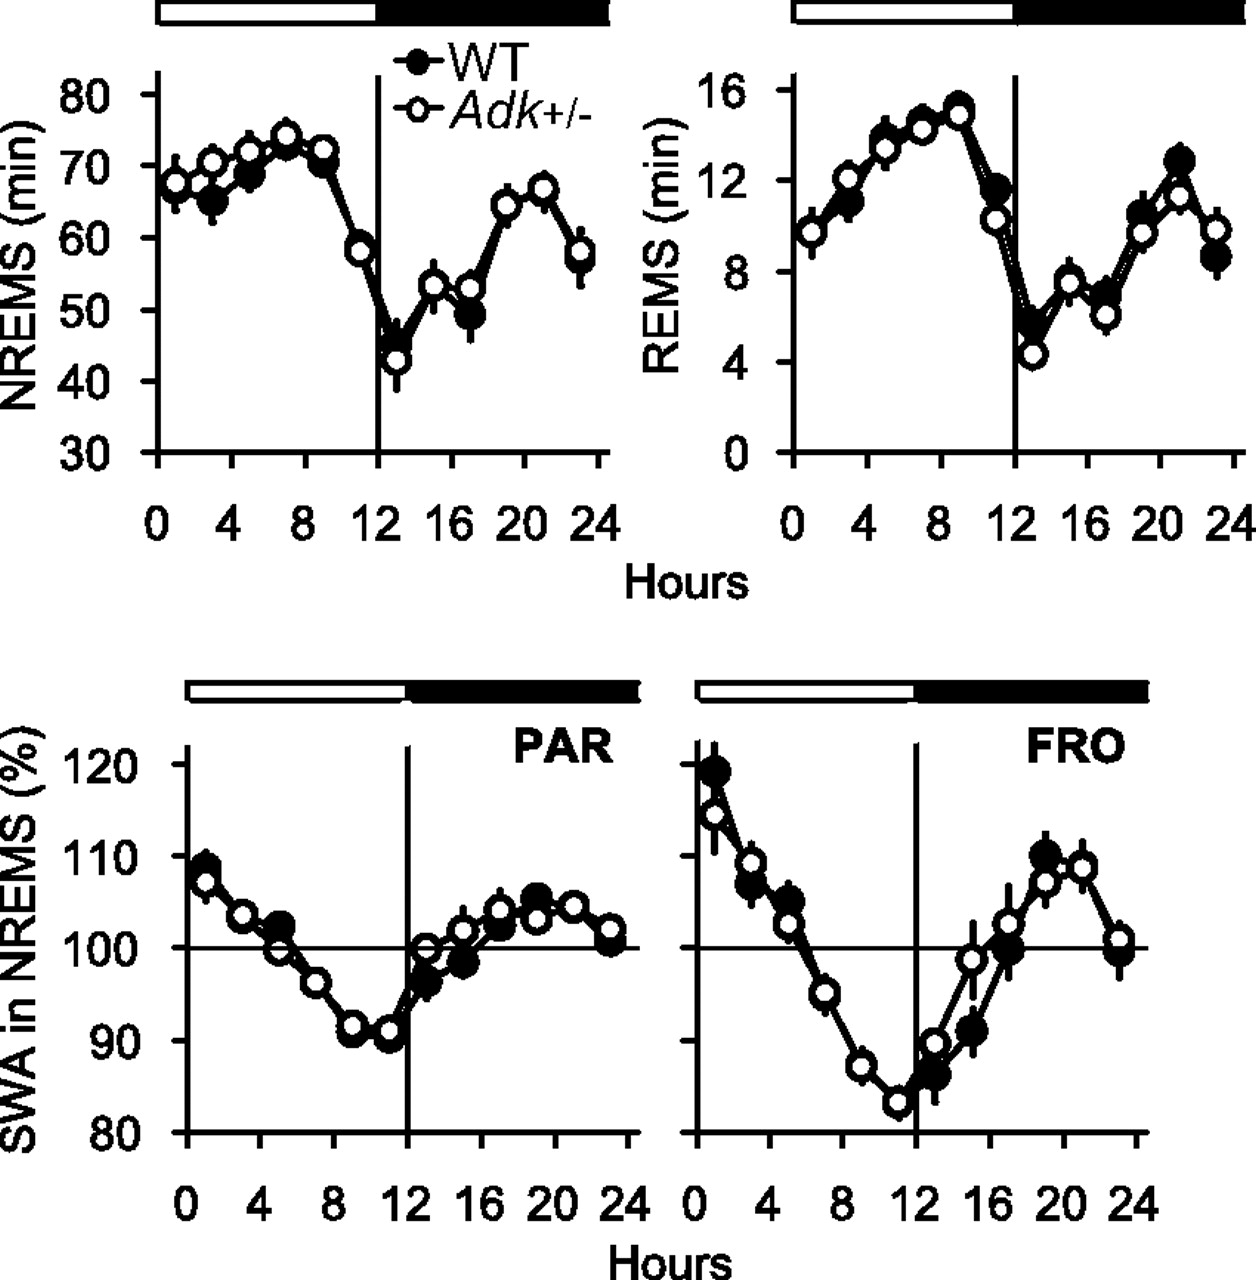
Our previous data suggest that adenosine metabolism is not significantly altered in Adk+/− mice [normal AMP, ADP, ATP, SAM (S-adenosylmethionine), SAH (S-adenosylhomocysteine) levels and normal physiology] (Boison et al., 2002). We therefore hypothesized that sleep would not be altered under conditions of reduced ADK, but normal adenosine metabolites. The amount of sleep (Table 1, Fig. 8), as well as the average duration and frequency of vigilance state episodes (data not shown), did not differ between Adk+/− and WT mice. Moreover, the 24 h baseline time course of SWA in NREM sleep was similar in the two genotypes (Fig. 8). When sleep pressure was enhanced by SD, the typical increase in NREM sleep, REM sleep, and SWA in NREM sleep was evident, but none of these variables differed significantly between Adk+/− and WT mice (Table 1). We conclude that the changes in ADK expression per se in the absence of any changes in adenosine metabolites do not affect sleep.

Time course of NREM sleep (NREMS), REM sleep (REMS), and SWA (EEG power between 0.75 and 4 Hz) in NREM sleep in the parietal (PAR) and frontal (FRO) EEG in WT (black dots; n = 14) and Adk+/− mice (white dots; n = 15) during the 24 h baseline. The white and black bars indicate the 12 h light and dark period. Data represent 2 h means; SWA is expressed as percentage of the 24 h mean SWA in NREM sleep.
ADK protein expression level
To validate our findings, we retrospectively quantified ADK protein expression levels in brain extracts from representative experimental animals of each genotype after the conclusion of the experiments (n = 6 per genotype). Adk-tg mutants expressed significantly higher ADK levels in the brain (142% vs WT mice; p < 0.001, unpaired t test) of the short ADK isoform (Fig. 9), whereas ADK expression levels of the short and long ADK isoforms in Adk+/− mice were significantly lower (65% of WT mice; p < 0.001, unpaired t test).

Top, Western blot of ADK protein levels from the right hemisphere of adult WT, Adk+/−, and Adk-tg mice (numbers 1–6 correspond to individual mice). Bottom, Corresponding quantitative analysis of the ADK levels of n = 6 mice per genotype (O.D., optical density). ADK was first normalized to equal loading according to the α-tubulin standard and then to the ADK level of WT mice (=100%). Differences from WT: **p < 0.001, unpaired t test.
Discussion
Adenosine levels in adult brain are primarily regulated by an astrocyte-based adenosine cycle (Boison, 2008). Astrocytes can release adenosine precursor ATP either by vesicular transport (Pascual et al., 2005) or via hemichannels (Kang et al., 2008). Once outside the cell, ATP is rapidly degraded by a cascade of ectonucleotidases (Zimmermann, 2000). In contrast to conventional neurotransmitters, there is no regulated transporter-mediated reuptake system for adenosine. On the contrary, astrocytes express two types of equilibrative nucleoside transporters (Baldwin et al., 2004). Inside the cell, adenosine is removed by phosphorylation into AMP by ADK. Thus, ADK drives the influx of adenosine into the astrocytes and regulates the abundance of extracellular adenosine.
Role of ADK in sleep homeostasis
In this study, we show for the first time that increasing ADK, the key enzyme controlling adenosine levels, robustly altered vigilance states and specific EEG oscillations that are the hallmarks of NREM sleep, REM sleep, and wakefulness. In particular, the increases in brain ADK protein and ADK activity in Adk-tg mice resulted in a remarkable reduction of EEG power below 4 Hz and in the theta frequency range (Fig. 1), pointing to a deficiency in mechanisms generating EEG slow waves and theta oscillations. Moreover, ADK overexpression led to a reduction of sleep, which was partially compensated for by an increase in sleep consolidation. Under enhanced sleep pressure, a deficiency in the homeostatic regulation of sleep became apparent in Adk-tg mice. The increase of SWA in NREM sleep and its buildup at the waking–NREM sleep transitions were lower in Adk-tg mice (Fig. 5), indicating a reduced capacity to intensify sleep. This finding is remarkable since Adk-tg mice had slept less than WT mice during the dark period preceding SD. Therefore, they were under higher sleep pressure at the beginning of SD. The deficiency in sleep regulatory mechanisms was further demonstrated by the lower SWE accumulated after 18 h recovery in Adk-tg mice.
ADK is highly conserved in evolution and ubiquitously expressed (Boison, 2006). Its importance for survival is emphasized by the lethality of the disruption of the Adk gene (Boison et al., 2002). Two different isoforms of ADK exist (Cui et al., 2009), a cytoplasmic isoform thought to regulate ambient levels of adenosine, whereas a nuclear isoform might be implicated in epigenetic mechanisms. This dual functionality of the enzyme has been postulated previously (Studer et al., 2006). Heterozygous Adk mice have no obvious phenotype (Boison et al., 2002), which we here confirmed for sleep and sleep regulation. We reported previously that Adk+/− mice display alterations in ADK expression in the absence of changes in adenosine metabolism. These findings suggest that the nuclear isoform of ADK is likely not involved in sleep regulation. In line with this notion, Adk-tg mice that selectively overexpress the cytoplasmic isoform of ADK, but lack the nuclear isoform of ADK, show a profound sleep phenotype. Together, these data suggest that the cytoplasmic, but not the nuclear isoform of ADK is involved in sleep regulation.
Sleep deprivation enhanced extracellular adenosine, which thereafter decreased during recovery sleep (Porkka-Heiskanen et al., 1997, 2000; Basheer et al., 2004). Benington and Heller (1995) proposed that adenosine continues to be released during recovery from SD as a product of a putative restorative process occurring during sleep. The astrocytic and neuronal ADK overexpression in Adk-tg mice should lead to a faster adenosine clearance from the extracellular space resulting in a slower accumulation of sleep need during prolonged wakefulness, and in a reduced response to SD. Thus, we had hypothesized that the overall reduction in brain adenosine levels in Adk-tg mice might not only modify sleep under baseline conditions but also attenuate the rise in sleep pressure during SD, and impair sleep restorative processes during recovery.
The deficiency in the Adk-tg mice was not restricted to EEG slow waves but also comprised spindle activity in NREM sleep and theta activity in waking and REM sleep. Spindle and slow-wave oscillations originate in the thalamocortical network and depend on the hyperpolarization of thalamocortical neurons (Steriade et al., 1993). Notably, Adk-tg mice showed both reduced SWA levels in NREM sleep and a 24% lower surge of SFA at NREM–REM sleep transitions compared with WT mice (Fig. 6). During SD-induced wakefulness, Adk-tg mice showed a larger increase of SFA and a smaller increase of SWA (Fig. 7). Adenosine A1 receptors, which are predominantly expressed in the cortex and in several thalamic nuclei, including the thalamic reticular nucleus (Rosin et al., 1998; Ochiishi et al., 1999), may mediate these genotype differences. Robust, but opposing, presynaptic and postsynaptic effects of adenosine via A1 receptors on thalamocortical oscillations were reported in ex vivo thalamic slices (Pape, 1992; Ulrich and Huguenard, 1995; Fontanez and Porter, 2006). Our results are in agreement with a potent role of adenosine in mediating the hyperpolarization of thalamocortical neurons, which de-inactivates the low-threshold calcium channels in thalamic relay nuclei underlying the occurrence of slow waves (for review, see McCormick, 1992). The reduced adenosinergic tone in Adk-tg mice (Fedele et al., 2005) may also alter ATP-regulated phosphorylation of T-type Ca2+ channels (Leresche et al., 2004). In addition, adenosine modulates the release of several neurotransmitters (Fredholm et al., 2005), including cholinergic, monoaminergic, and histaminergic inputs to the thalamocortical network, which, thereby, may alter the firing pattern of thalamocortical neurons.
The waking EEG is affected by Adk overexpression
Both the amount and quality of wakefulness were affected by ADK overexpression (Table 1). Adk-tg mice were more active during their waking bouts compared with WT mice (Fig. 4), confirming previous results (Fedele et al., 2005; Yee et al., 2007). These findings mimic the stimulant properties of the adenosine receptor antagonist caffeine (Schwierin et al., 1996; Fredholm et al., 2005; Huang et al., 2005). It is likely that the increase in wakefulness and corresponding reduction in sleep in Adk-tg mice is a consequence of reduced adenosinergic tone throughout the brain, leading to increased activity of the ascending monoaminergic system on the thalamus.
It is well established from human and animal studies that EEG power in the low frequencies increases in the course of prolonged wakefulness (Torsvall and Akerstedt, 1987; Franken et al., 1993; Cajochen et al., 1995; Aeschbach et al., 1999; Achermann and Borbély, 2003; Vyazovskiy and Tobler, 2005). We found a robust increase in EEG power of frequencies <8 Hz in both genotypes in the course of SD. Interestingly, initial levels and rise rates of power in specific frequencies were different in Adk-tg mice (Fig. 7). These differences may result from the behavioral alterations mentioned above. The mechanisms underlying these alterations remain unclear.
Role of Adk in REM sleep
Strikingly, Adk-tg mice showed an overall reduction of REM sleep (Table 1). Several lines of evidence support a role of the adenosinergic system in the onset and maintenance of REM sleep. Microinjections of the A1 receptor agonist cyclopentyladenosine in the pontine reticular formation, a region implicated in the modulation of REM sleep (Monti and Monti, 2000), enhanced REM sleep duration in rats (Marks and Birabil, 2000; Marks et al., 2003). This effect was counteracted by pretreatment with the adenosine receptor antagonist cyclopentyltheophylline (Marks and Birabil, 1998). Consistently, microinjections of an A2A receptor agonist in the same region also enhanced REM sleep and increased acetylcholine release in rodents (Marks et al., 2003; Coleman et al., 2006). Initiation of REM sleep may be deficient in Adk-tg mice because of alterations in glutamatergic excitation and GABAergic inhibition of REM sleep active neurons in the sublaterodorsal nucleus (Luppi et al., 2006). Once REM sleep is initiated, it is maintained normally as indicated by the similar duration of REM sleep episodes in WT and Adk-tg mice. Under increased sleep pressure, the REM sleep rebound was similar in the two genotypes, indicating that basic REM sleep regulatory mechanisms are intact in Adk-tg mice.
In the present study, reduced theta activity after transitions to REM sleep in Adk-tg mice implicates a role for adenosine in the modulation of theta oscillations. Moreover, theta peak frequency in REM sleep was significantly lower in Adk-tg mice compared with WT mice, whereas waking theta peak frequency was similar in the two genotypes (p = 0.18, unpaired t test). Changes in adenosinergic tone because of ADK overexpression may modulate the frequency and amplitude of theta oscillations during REM sleep by changing the excitatory input from the brainstem reticular formation to the septum (Vinogradova, 1995).
Conclusions
Our data suggest that ADK overexpression profoundly alters the sleep phenotype, likely by lowering adenosine tone in the brain. It is tempting to speculate that ADK, by controlling adenosine levels and its receptor-mediated effects, may tune and integrate other neurotransmitter pathways involved in sleep–wake regulation and the generation of related EEG oscillations. Overall, our results are in accordance with a global rather than a region-specific role of adenosine in sleep regulation (Heller, 2006).
Footnotes
- Received March 16, 2010.
- Revision received July 16, 2010.
- Accepted August 5, 2010.
This work was supported by Swiss National Science Foundation Grant 3100A0-112528/1, European Union (EU) Grant LSHM-CT-2005-518189, EU Grant MCRTN-CT-2004-512362, and National Institute of Mental Health Grant R01-MH83973. We thank Dr. P. Achermann for advice in data analysis and Drs. A. Borbély, V. Vyazovskiy, and L. Tarokh for critical comments on this manuscript.
- Correspondence should be addressed to Prof. Irene Tobler, Institute of Pharmacology and Toxicology, University of Zurich, Winterthurerstrasse 190, CH-8057 Zurich, Switzerland. tobler{at}pharma.uzh.ch
- Copyright © 2010 the authors 0270-6474/10/3013157-09$15.00/0