
Abstract
A characteristic feature of the somatosensory cortex in rodents is the presence of discrete cellular aggregates in layer 4 (barrels) that process input from the mystacial vibrissae. Just like thalamic cells that relay vibrissal information to the barrels, barrel cells display directional preference to whisker motion. The present study examined whether the projection of single thalamic cells into a barrel is consistent with the existence of an orderly map of direction preference. The direction preference of single thalamic cells was assessed, and axonal projections were visualized after juxtacellular labeling with biotinylated dextran. Results show that the terminal field of individual thalamic neurons in a barrel is markedly anisotropic and that the location of boutons with respect to the somatotopic map is either positively or negatively correlated with the angular tuning of the thalamic neuron. These results indicate that angular tuning is not represented across a systematic map with fixed anteroposterior/mediolateral coordinates in a barrel. The actual significance of the direction-dependent segregation of thalamocortical terminals in barrels may only come to light in the context of active sensing.
Introduction
A characteristic feature of the cerebral cortex is that neurons with similar response properties are clustered together in columns extending vertically through the whole thickness of the cortex. In the visual cortex, it has been shown that neurons are grouped according to ocular dominance, orientation preference, color, direction of movement, disparity, etc. (for review, see Basole et al., 2006), thus defining feature maps that are coextensive with the retinotopic map.
In the barrel cortex of rodents, another widely used model of sensory integration, a number of studies have examined response properties of cells that process input from the mystacial vibrissae (for review, see Alonso and Swadlow, 2005; Petersen, 2007). Yet we still have little understanding of how features encoded by whisker motion are represented across the dimensions of a barrel—or a barrel column—and how these features relate to the somatotopic representation of the vibrissae. Cytochrome oxidase (CO) staining in conjunction with other histological methods revealed that individual large barrels encompass two to three subbarrel domains, indicating that barrels are structurally heterogeneous (Land and Erickson, 2005). Electrophysiological studies also reported that individual barrels contain discrete minicolumns of neurons preferring the same deflection angle (Bruno et al., 2003). Yet tangential penetrations through individual barrels failed to reveal an organized array of direction preference that has consistent association with somatotopy (Bruno et al., 2003; Andermann and Moore, 2006).
The aim of the present study was to determine how individual thalamic cells project into a barrel, and examine whether the spatial distribution of terminal fields correlates with the direction preference of thalamic neurons. Results show that the spatial distribution of terminal fields is markedly anisotropic and that the clustering of boutons with respect to the somatotopic map either positively or negatively correlates with the direction preference of the thalamic neuron. These results suggest that barrels contain multiple projection maps, which possibly derive from different types of direction-sensitive nerve endings in vibrissal follicles.
Materials and Methods
Experiments were conducted in accordance with the animal care and use guidelines of the Institute of Laboratory Animals, Graduate School of Medicine (Kyoto University). All efforts were made to minimize the number of animals required and pain or discomfort of the animals.
Recording and labeling of thalamic cells.
Experiments were performed in 35 male rats (250–300 g; Wistar) under ketamine (75 mg/kg; xylazine, 5 mg/kg) anesthesia. The left facial nerve was cut to prevent spontaneous vibrissa movement, and the rat was placed in a stereotaxic apparatus. The animal breathed freely, and body temperature was maintained at 37.5°C with a heating pad controlled thermostatically. Throughout the experiment, a deep level of anesthesia was maintained (stage III-3) (Friedberg et al., 1999) by additional doses of anesthetics (20 mg/kg ketamine plus 0.3 mg/kg xylazine, i.m.) given as needed to abolish reflex to sharp pinch of the hindlimbs.
Single units were recorded extracellularly in the ventral posterior medial nucleus (VPM) of the thalamus with micropipettes (tip diameter, 0.5–1 μm) filled with a solution of potassium acetate (0.5 m) and biotinylated dextran amine (10% BDA-3000; Invitrogen). Signals were amplified, bandpass filtered (100 Hz to 3 kHz), and sampled at 10 kHz.
Vibrissae were cut at 5 mm from the skin, and we assessed the receptive field size of single units by deflecting individual vibrissae with a hand-held probe under a dissecting microscope. An audiomonitor and a computer display were used to monitor the responses. Then, the tip of the vibrissa was inserted into the groove of a beveled straw attached to a ceramic bimorph bender (Physik Instrumente). The vibrissa was pushed in a given direction at stimulus onset but returned passively at a neutral position at stimulus offset. Care was taken to align the axis of the stimulator with that of the hair shaft. Ramp-and-hold waveforms (rise/fall times, 5 ms; total duration, 50 ms; amplitude, 0.4 mm, or ∼5°; angular velocity, ∼1000°/s; interstimulus interval, 1.2 s) were used to deflect vibrissae from their resting position in eight directions spanning 360° (e.g., in 45° increments relative to the horizontal alignment of the vibrissa rows). As measured with a photodiode, resonance frequency of the ceramic bimorph bender was 200 Hz [amplitude, ∼5% of peak displacement (i.e., ∼20 μm for the first period)]. Stimuli were repeated 20 times, the probe was rotated by 45°, and the sequence was repeated. Thereafter, cells were labeled juxtacellularly for 20–30 min (Pinault, 1996). After completing this protocol, the skin was sutured, rats were given analgesics (5 mg/kg Anafen), and they were returned to the animal facilities.
Two to 3 d later, rats were perfused under deep anesthesia with PBS followed by a fixative containing 4% paraformaldehyde and 0.5% glutaraldehyde in phosphate buffer (0.1 m). After cryoprotection in 30% sucrose, the barrel cortex was cut tangentially at 40 μm on a freezing microtome. After all layers of the barrel cortex were cut, brain blocks were reset on the microtome and the thalamus was cut coronally at 70 μm. Sections were incubated overnight in ABC Elite (Vector Laboratories) at room temperature. To enhance the signal of BDA, after rinses in PBS, sections were reacted for 30 min with 2.5 μm biotinylated tyramine, 3 μg/ml glucose oxidase, and 2 mg/ml glucose (Furuta et al., 2009; Kuramoto et al., 2009). This was followed by incubation for 2 h in ABC Elite, and peroxidase was revealed using nickel diaminobenzidine as a substrate. Finally, sections were processed for cytochrome oxidase.
Control experiments.
Additional experiments were performed to assess the potential effect of facial nerve cut on the morphology of axonal projections. In these experiments, two barreloid cells were juxtacellularly labeled in rats with an intact facial nerve, but their angular tuning properties was not determined. In two additional experiments, large iontophoretic injections of BDA were made in the VPM (10% BDA in 0.5 m potassium acetate; +1 μA current pulses of 7 s, 50% duty cycle for 3 min). Rats were fixed 2 d later, and brains were processed for BDA and CO staining as described above.
Data analysis.
Spike events elicited by vibrissa deflection were collected in peristimulus time histograms (PSTHs) of 20 responses with 1 ms bin width. Response magnitude was estimated as the mean number of spikes per stimulus within a time window of 20 ms after stimulus onset. We defined response onset as the first bin (poststimulus) displaying counts that significantly exceeded (99.99% confidence level) spontaneous activity levels estimated over a prestimulus time window of 100 ms, or as the first two consecutive bins displaying significantly larger counts (99% confidence level) than the spontaneous activity levels. Data were analyzed with IgorPro (Wavemetrics) and Excel (Microsoft) software. Results are reported as mean ± SD.
Mapping bouton distribution.
The axonal arbor of barreloid cells was examined with a light microscope equipped with a computerized tracing system (Neurolucida; MicroBrightField). The distribution of boutons in layer IV was mapped with respect to barrels and septa. Because tangential sections are not always parallel to the pia, the array of barrels was reconstructed from three to four serial sections using a low-magnification objective (2.5×) to identify the rows and arcs of interest. Boutons were identified as en passant varicosities along axonal branches or as terminal beads at the tip of fine branches. Boutons were individually mapped and counted using a CCD camera connected to the Neurolucida system with an objective lens of 40× (numerical aperture, 0.95). This system had an intermediate magnification lens (5×) in front of the CCD camera, and was operated on a 30 inch flat panel monitor on which the final magnification was ∼2000 with the objective lens of 40×. Ultrastructural analysis has shown that bouton-like varicosities of VPM axons in barrel cortex make synaptic contacts onto cortical neurons (Lu and Lin, 1993; White et al., 2004).
Quantitative analysis of anatomical data.
To compare the distribution of terminals within a barrel with the direction of whisker displacement, we corrected for the natural curvature of arcs and rows, so that the arrangement of the barrel field lies in register with the array of vibrissae on the mystacial pad (Fig. 1). First, straight lines (row axis and arc axis) were drawn connecting the center of barrels adjacent to the principal barrel. Then, the barrel map, including boutons, was transformed so that these lines intersect at right angle (Fig. 1, step 1): when an original coordinate of a bouton in the raw data was defined as (x, y) = αV1 + βV2 (where V1 and V2 are unit vectors parallel to the row axis and arc axis, respectively), a converted coordinate of the bouton in a transformed barrel is (α, β). Then, the long axis of the principal barrel was rescaled to be equal to its short axis (Fig. 1, step 2). The rescaling factor was also applied to the adjacent barrels. As a result, the principal barrel shape approximated that of a square surface that was divided in eight sectors of 45° each fanning out toward the adjacent barrels. These transformations were performed with IgorPro (Wavemetrics). To assess a potential relationship between angular tuning and bouton distribution, we computed a correlation coefficient between response magnitude for each direction and the number of boutons in the corresponding radial sector.

Geometric transformation of the barrel field. First, straight lines were drawn connecting the center of barrels adjacent to the principal barrel. Then, the barrel map, including boutons, was transformed so that these lines intersect at right angle (step 1). Then, the long axis of the principal barrel was rescaled to be equal to its short axis (step 2).
Results
The present study is based on combined anatomical and electrophysiological data obtained from 12 monowhisker barreloid cells that, as a population, exhibited tuning ratios and angular tuning indices comparable with those reported in previous studies conducted in lightly sedated animals (Fig. 2A) (Simons and Carvell, 1989; Minnery et al., 2003). The mean tuning ratio, defined as the average ON response (all angles) divided by the ON response at the best angle was 0.54 ± 0.10, indicating a maximum angle ON response that was approximately double that of the average ON response. We also computed for each cell a tuning index (tuning category) whereby a cell was classified according to the number of deflection angles (0–7) that elicited responses that were statistically smaller than the response at the best angle (p < 0.05; one-tailed t test). Accordingly, an index of 7 indicates the highest degree of tuning, whereas 0 indicates a nontuned cell. The majority of our sample (83%) had a tuning index of 4–7, revealing a strong tendency toward directional selectivity (Fig. 2B). We further calculated another direction selectivity index, D, as a measure of the directional tuning (Taylor and Vaney, 2002). D was defined as D = Σvi/Σri, where vi are vector magnitudes pointing in the direction of the stimulus and having length, ri, equal to the number of spikes recorded during that stimulus. D can range from 0, when the responses are equal in all stimulus directions, to 1, when a response is obtained only for a single stimulus direction. Thus, values for D approaching 1 indicate asymmetric responses over a small range of angles and therefore sharper directional tuning. Direction selectivity indices for the responses ranged from 0.10 to 0.51 (mean ± SD, 0.31 ± 0.14) (Fig. 2C).

Directional tuning of a monowhisker barreloid cell that was labeled with BDA. A, Each PSTH (bin width, 1 ms) represents 20 responses, and the polar plot displays response magnitude as estimated by the number of evoked spikes within a time window of 20 ms after stimulus onset. B, Thalamic cells were classified into eight categories corresponding to their degree of angular tuning. Tuning was assessed by the number of deflection angles (0–7) that elicited responses that were statistically smaller than the response at the best angle (p < 0.05; one-tailed t test). Thus, an index of 7 indicates the highest degree of tuning, whereas 0 indicates a nontuned cell. C, Distribution of direction-selectivity indices of vibrissal responses of thalamic cells.
After assessing directional tuning, cells were individually labeled with BDA. By using a tyramine enhancement protocol to reveal the tracer, fine axonal branches and boutons were darkly stained in barrel cortex (Fig. 3A,B). Boutons were identified as en passant varicosities along axonal branches or as terminal beads at the tip of fine branches (Fig. 3C). The reconstruction of axonal arbors from serial sections indicated that the labeling was complete.

Terminal field of monowhisker-responsive VPM cells in barrel cortex. A, Somatodendritic complex of a juxtacellularly labeled cell that responded to whisker C1. The tangential section in B shows part of the terminal field of the same cell in barrel C1. C, The use of a tyramine enhancement protocol to reveal BDA allowed clear identification of boutons along axonal branches. D, Coronal view of the axonal arborization of a barreloid cell in barrel cortex. E, Tangential view of the distribution of boutons in layer 4. The white lines in D and orange dots in D and E represent axonal branches and boutons, respectively.
As they exit the thalamus, axons of barreloid cells send collaterals in the reticular thalamic nucleus, traverse the striatum, and, on reaching barrel cortex, start dividing in the depth of layer 6. Daughter branches ascend through layer 6, where they divide again, giving off small branches bearing boutons. Thicker branches further ascend and ramify profusely in layers 4 and 3, with a few branches reaching up to layer 2 (Fig. 3D).
Individual monowhisker-responsive barreloid cells give off ∼5000 boutons in layer 4 (4849 ± 861), most of which are found in the homotopic barrel (3177 ± 753). The other boutons are dispersed in surrounding septa and, to a lesser degree, in surrounding barrels (Fig. 3E). No significant correlation was found between the size of a barrel and the number of boutons it receives from individual barreloid cells (r = 0.42; p > 0.1).
The mediolateral and anteroposterior spread of individually reconstructed axons in layer 4 was 740 ± 214 μm (mean ± SD) and 872 ± 202 μm, respectively. This is a more extensive spread than that observed in previous studies (Jensen and Killackey, 1987; Arnold et al., 2001), which reported that thalamocortical arborizations spread over 400–500 μm in the posteromedial region the barrel cortex. To test whether facial nerve cut might have affected the morphology of axons, we juxtacellularly labeled two additional barreloid cells in rats with an intact facial nerve. These two cells gave rise to terminal arbors that spread over 859 and 568 μm mediolaterally, and 961 and 635 μm anteroposterially. This figure fits within the range of terminal fields spread measured in rats with a severed facial nerve, suggesting that facial nerve cut, at least over a survival period 2–3 d, does not affect the spread of thalamocortical axons. We also compared the distribution of boutons along axonal branches between cells labeled in rats with an intact or severed facial nerve. The material used in normal rats (intact facial nerve) was obtained after bulk injection of BDA in the VPM. We selected 24 segments of axons in layer 4 (segment length, 109 ± 26 μm), counted boutons, and measured distances between the closest pairs of boutons (nearest-neighbor analysis). In cells individually labeled after facial nerve cut, nearest-neighbor distances of boutons were not significantly different from that measured in intact rats (p = 0.748, t test) (4.1 ± 0.3 μm, after facial nerve cut; 4.3 ± 1.1 μm, in intact rats). It thus appears unlikely that facial nerve cut might have induced significant change in the morphology of thalamocortical axons.
Anisotropic distribution of boutons
The most striking aspect of the terminal field of VPM cells is the anisotropic distribution of boutons in barrels (Figs. 4, 5). When the actual bouton distribution of each cell is compared with that of a Poisson distribution (expected value = NB * bs/Bs, where NB is the total number of boutons in a barrel, bs is the bin size = 20 μm, and Bs is the barrel size), regions of significantly higher bouton density occupy, on average, 23.9 ± 4.3% of the space of the barrel (p < 0.01) (Fig. 4, red area) (test for proportion by Poisson distribution), whereas 42.6 ± 8.4% of the space of the barrel displays a significantly lower bouton density (p < 0.01) (Fig. 4, blue area). Since the distribution of terminals differs from the prediction of a randomly organized projection, we examined the possibility that barrels contain a functional map of vibrissal input.

Anisotropic distribution of boutons in barrels. The three-dimensional solid image shows the distribution of bouton-dense areas in a barrel. The color-coded plots in the right column illustrate bouton-dense areas (red) and bouton-sparse areas (blue) in the three tangential sections used to build the three-dimensional rendering (black line, outline of the barrel). The actual density of boutons in each bin was compared with that expected from a Poisson distribution (expected value = NB * bs/Bs, where NB is the total number of boutons in a barrel, bs is bin size, and Bs is barrel size).

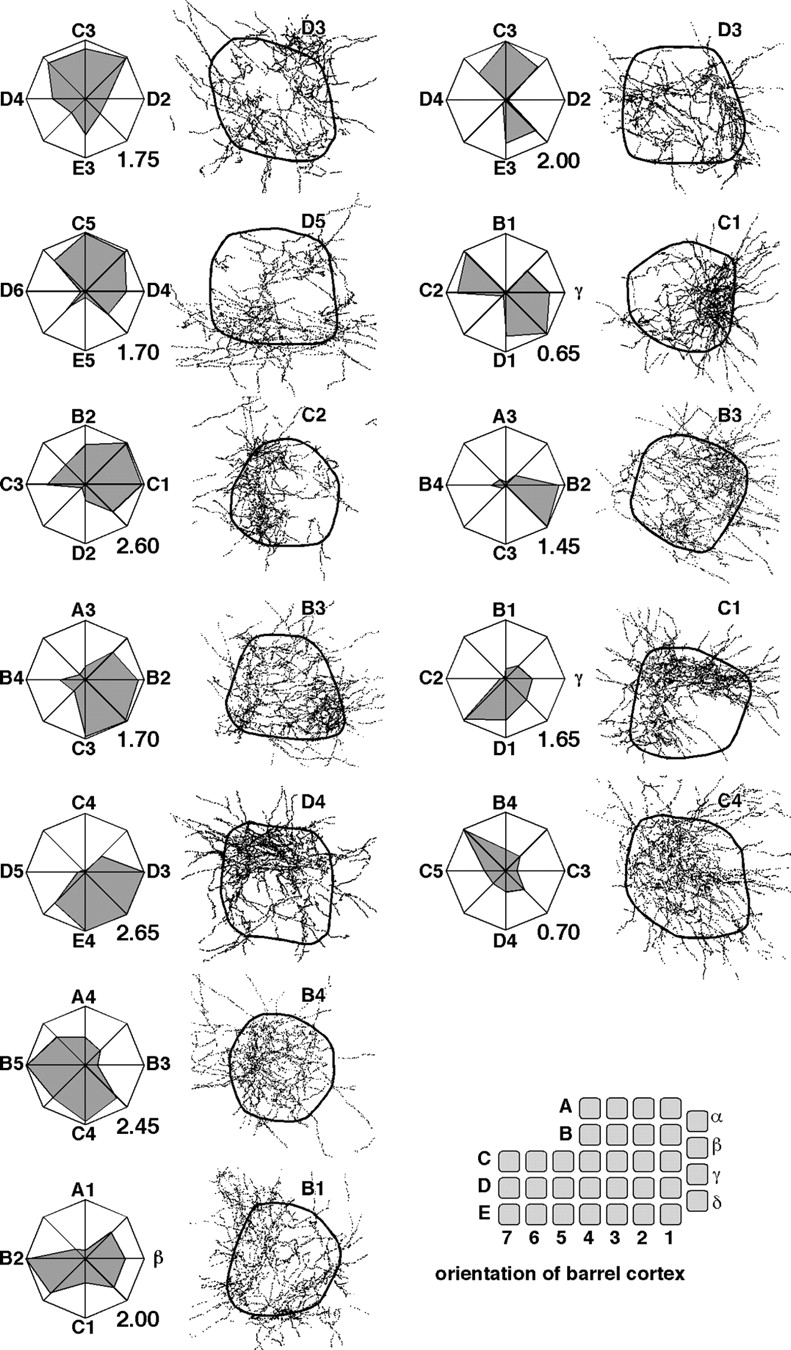
Anisotropic distribution of thalamocortical terminals in barrels. The directional tuning of individual barreloid cells (n = 12) was assessed (polar plots), and after cell labeling, BDA-positive boutons were mapped in the homotopic normalized barrels. The principal whisker is indicated in the top right corner of each map. The direction of deflection in polar plots is indicated relative to the surrounding whiskers. Note that the barrel field was transformed into a square matrix that replicates the arrangement and orientation of the vibrissae on the mystacial pad, as shown at the bottom of the right-hand column. Thus, the position of boutons in barrels coregisters with the direction of deflection in polar plots. The number at the bottom right of each polar plot indicates maximum response magnitude (spikes/stimulus).
Directional tuning and somatotopy
Previous studies have suggested that the direction preference of cortical neurons varies as a function of their position within a barrel column (Bruno et al., 2003; Andermann and Moore, 2006). Since the somatotopic map in the tangential plane of the barrel cortex replicates the orderly arrangement of whiskers on the mystacial pad, we examined whether the distribution of boutons in a barrel reflects the existence of a map of direction preference that has a consistent relation to somatotopy. Figure 5 shows polar plots of directional tuning of 12 barreloid cells with the corresponding normalized maps of bouton distribution in the homotopic barrels. Normalization was achieved by geometrical transformation of the barrel field into a square matrix whose arrangement and orientation replicate that of the vibrissae on the mystacial pad (drawing at the bottom of Fig. 5). Thus, the terminal field in each of the barrels lies in register with the direction of whisker deflection as illustrated in the top left column. Cursory inspection of Figure 5 makes it clear that terminal fields are anisotropic, but the anisotropic distribution of boutons does not appear to bear any consistent relationship with the directional tuning of the cells. If one considers cells that respond to whiskers B4 and C2 (Fig. 5, left column), the B4-responsive cell best responded when the whisker was deflected rostralward, and this cell distributed most of its boutons in the rostral sector of barrel B4. In contrast, the C2-responsive cell best responded to caudal deflection and distributes most of its boutons in the rostral sector of barrel C2. In the former case, the position of the terminal field was positively correlated with directional tuning (i.e., it was located close to the face region toward which whisker motion was most effective), whereas in the latter case it was negatively correlated (i.e., it was located away from the barrel toward which whisker motion was most effective).
To assess quantitatively a potential relationship between directional tuning and location of terminal field, stimulus directions were numbered from 1 to 8, numbers 1 and 3 corresponding to the backward and upward directions, respectively (Fig. 6A). Terminal fields were divided into eight radial sectors of 45°, each fanning out toward a nearby barrel in the somatotopic map. For each cell, a coefficient of correlation was computed between response magnitude for each direction and the numbers of boutons in the corresponding radial sector. The distribution of correlation coefficients was clearly bimodal, revealing two groups of terminal fields: one that positively correlated and another one that negatively correlated with the somatotopic map (Fig. 6B). The same analysis was performed after shuffling morphological and physiological data. Bouton distributions were randomly rotated in steps of 45° spanning 360°, which yielded a total of 96 distributions that were randomly assigned to a tuning plot (8 rotated positions × 12 bouton distributions × 12 tuning plots = 1152 combinations). The shuffled data yielded a histogram of correlation coefficients centered on zero (Fig. 6C). When histograms of correlation coefficients were built from 12 combinations randomly chosen from the shuffled data (100,000 draws), the probability of having no count in central bins (−0.2 to 0.2) was 0.026. In sum, statistical analysis indicates that the empirically observed bimodal distribution is consistent with the existence of two overlapping maps of direction preference: one that positively correlates and the other one that negatively correlates with somatotopy.

Quantitative relationship between angular tuning and bouton distribution in barrels. A, Stimulus directions were numbered (1–8), numbers 1 and 3 corresponding to the backward and upward direction, respectively. The barrels were divided into eight radial sectors of 45°, each fanning out toward a nearby barrel in the somatotopic map. For each cell, a correlation coefficient was computed between response magnitude for each direction and the number of boutons in the corresponding radial sector. B, The distribution of correlation coefficients reveals two classes of terminal field: one that positively correlates and the other that negatively correlates with the somatotopic map. C, After shuffling eight radial sectors of bouton distribution in each cell (483,840 combinations), the histogram of correlation coefficients centered on zero.
The bouton distribution of the positively and negatively correlated groups were collectively compared by superimposing maps of bouton distribution after rotating individual maps to match the vectors of preferred direction. These grouped maps clearly show the preferential clustering of boutons near the preferred direction for the positively correlated group, and away from the preferred direction for the negatively correlated group (Fig. 7A). This segregation became blurred after superimposing all maps, yet revealing a somewhat lower bouton density in a center of the barrel. The relative sparseness of boutons in barrel center was observed even with the raw, unrotated data (Fig. 7B).

Difference in bouton distribution and the time course of responses between the positively correlated and negatively correlated groups. A, The map of bouton distribution of each cell pertaining to each group was rotated so that all vectors of preferred directions point in the same direction (rightward). For the positively correlated group, bouton density is higher in the subbarrel domain near the arrowhead, whereas for the negatively correlated group bouton density is higher in the opposite domain of the barrel. B, Relative sparseness of boutons in barrel center was observed when all terminal fields of the raw, unrotated data were superimposed. C, Grouped PSTHs showing the time course of whisker-evoked responses (all directions) for the positively correlated and negatively correlated groups.
Additional differences between the two thalamocortical groups
Additional analysis revealed that cells giving rise to the negatively correlated map responded to whisker deflection at significantly shorter latency (5.3 ± 1.3 vs 7.3 ± 1.0 ms for the positively correlated group; two-tailed t test; p = 0.015; latency was estimated from response to the direction closest to the preferred direction), but no significant difference in response magnitude was found between the two groups (two-tailed t test; p = 0.226). Although the negatively correlated group started responding to vibrissa stimulation earlier than the positively correlated group, no difference in latency of peak responses was observed (Fig. 7C). Difference in time course of the responses was analyzed by counting spikes using three time windows (rising phase: poststimulus time, 4–7 ms; peak phase: 7–10 ms; decay phase: 10–13 ms). The negatively correlated group generated a larger number of spikes during the rising phase, but the number of evoked spikes during the peak and decay phases, or across the whole time window (0–20 ms), was not significantly different between the two groups.
We also examined whether cells giving rise to the two groups of terminal field differ with respect to soma location, soma size, dendritic arbor, number of boutons, barrel size, and other metrics that are listed in Table 1. Apart from response latency, no statistically significant difference was found between the two groups of neurons.
Morphological and physiological characteristics of the positively correlated and negatively correlated groups
Discussion
The present results demonstrate that the axonal projection of individual barreloid cells into a barrel is highly anisotropic. Most of the terminal fields occupy a subbarrel region either near to or away from the barrel representing the neighboring vibrissa toward which whisker deflection was most effective. Terminal field segregation across our sample of cells was sharp enough to define two types of direction-sensitive projection patterns: one that positively correlates with angular tuning and another one that negatively correlates with angular tuning.
Subbarrel domains
Land and Erickson (2005) previously reported that large barrels in the adult rat somatosensory cortex encompass two or three metabolically and structurally distinct regions, termed subbarrels. By means of CO staining and immunostaining for VGluT2 (vesicular glutamate transporter type 2), a marker of thalamocortical terminals (Fujiyama et al., 2001), they demonstrated that CO-dark subbarrels are more intensely immunoreactive for thalamocortical terminals than the CO-light clefts that separate them. This led to the prediction that terminal fields of thalamocortical axons innervating a particular barrel should be distributed in a pattern that reflects the arrangement of subbarrels (Land and Erickson, 2005). Cytochrome oxidase staining in the present study was performed after revealing BDA, which did not provide enough contrast to discriminate subbarrels. Yet the clustering of terminals of single VPM axons into one (or two) subregion(s) of a barrel fully supports this prediction. Moreover, in the majority of the staining patterns reported by Land and Erickson (2005) the center region of barrels had a low density of CO staining [Land and Erickson (2005), their Fig. 4], suggesting that thalamocortical axons give off fewer boutons to the barrel center. This was also observed in our results when all terminal fields were superimposed (Fig. 7A,B).
Relationship between anisotropy and angular tuning
Because layer 4 barrel cells receive direct input from direction-sensitive VPM neurons, one would expect the anisotropic distribution of terminals to be the substrate for a direction preference map within barrels. A previous study has indeed reported that individual barrels contain multiple angular tuning domains (minicolumns), each receiving convergent inputs from thalamic neurons with similar angular preferences (Bruno et al., 2003). Yet angular tuning was not represented across a systematic map with fixed anteroposterior/mediolateral coordinates, suggesting that, if a map of angular tuning exists in the barrel, it is not a geometrically simple one. Our results show that individual barreloid cells project to subbarrel regions whose location within the somatotopic map either positively or negatively correlates with the direction preference of the cell. Thus, barrels may contain two overlapping, but opposite representations of direction preference, which could explain why a systematic map of angular tuning was not readily observed in previous physiological studies (Bruno et al., 2003; Andermann and Moore, 2006).
A major limitation in all studies that have investigated angular tuning in the vibrissal system of rodents is the use of passive whisker deflection in anesthetized animals. Yet behaving rats use their whiskers actively, and there exists compelling evidence for a modulation of cortical activity during free whisking (whisking without contact with an object) (Fee et al., 1997; Crochet and Petersen, 2006; Hentschke et al., 2006; Curtis and Kleinfeld, 2009; de Kock and Sakmann, 2009). Moreover, when a whisker protracts during a whisk cycle, it rotates around its own axis, so that its orientation relative to a fixed object continuously changes (Knutsen et al., 2008). Thus, contact at different torsional angles is associated with different activity profiles across directionally tuned primary afferents. Thus, the actual significance of the segregation of thalamocortical terminals in barrels, as well as the latency difference between responses of the positively correlated group and the negatively correlated group, may only come to light in the context of active sensing.
Vibrissa follicles and barrels
In the somatosensory system of most species, one of the rules that specify the relationship between periphery and cortex is that each receptor class maps to a separate neuronal population (Mountcastle, 1957, 2003; Dykes, 1983; Hsiao, 2008). Assuming the same rule prevails in the vibrissal system of rodents, the arrangement of the different classes of receptors in a follicle should also map somatotopically in the corresponding barrel. Thus, if different classes of receptors, by virtue of their location around a follicle, encode the direction of vibrissa motion, different maps of motion direction should be present in a barrel. Among the different classes of nerve endings found in a vibrissa follicle, two main classes display territorial innervation: the Merkel endings and the lanceolate endings (Ebara et al., 2002). The peripheral branches of single trigeminal afferents associated with these nerve endings cluster in a restricted sector around the circumference of the follicle, which has been suggested to be the basis of angular tuning (Ebara et al., 2002). Although no correlative study has yet demonstrated a link between angular tuning and the location of these receptors around a follicle, it seems possible that the positive and negative correlation patterns of barrel innervation relate to the differential coding of angular direction by these two types of endings.
Footnotes
- Received November 24, 2010.
- Revision received February 28, 2011.
- Accepted March 6, 2011.
-
This work was supported by grants from Takeda Science Foundation and from the Ministry of Education, Science, Sports, and Culture of Japan (22700368) (T.F.) and by Canadian Institute of Health Research Grant MT-5877 (M.D.). We thank Dr. Takuma Tanaka for helpful discussions on the statistical analyses.
- Correspondence should be addressed to Takahiro Furuta, Department of Morphological Brain Science, Graduate School of Medicine, Kyoto University, Kyoto 606-8501, Japan. furuta{at}mbs.med.kyoto-u.ac.jp
- Copyright © 2011 the authors 0270-6474/11/316432-08$15.00/0