
Abstract
Disruption of the potassium/chloride cotransporter 3 (KCC3), encoded by the SLC12A6 gene, causes hereditary motor and sensory neuropathy associated with agenesis of the corpus callosum (HMSN/ACC), a neurodevelopmental and neurodegenerative disorder affecting both the peripheral nervous system and CNS. However, the precise role of KCC3 in the maintenance of ion homeostasis in the nervous system and the pathogenic mechanisms leading to HMSN/ACC remain unclear. We established two Slc12a6 Cre/LoxP transgenic mouse lines expressing C-terminal truncated KCC3 in either a neuron-specific or ubiquitous fashion. Our results suggest that neuronal KCC3 expression is crucial for axon volume control. We also demonstrate that the neuropathic features of HMSN/ACC are predominantly due to a neuronal KCC3 deficit, while the auditory impairment is due to loss of non-neuronal KCC3 expression. Furthermore, we demonstrate that KCC3 plays an essential role in inflammatory pain pathways. Finally, we observed hypoplasia of the corpus callosum in both mouse mutants and a marked decrease in axonal tracts serving the auditory cortex in only the general deletion mutant. Together, these results establish KCC3 as an important player in both central and peripheral nervous system maintenance.
Introduction
Hereditary motor and sensory neuropathy associated with agenesis of the corpus callosum (HMSN/ACC; Online Mendelian Inheritance in Man No. 218000) is a severe and progressive autosomal-recessive polyneuropathy associated with hypotonia, mental retardation, dysmorphism, variable degrees of agenesis of the CC, and visual/auditory hallucinations, resulting in death typically during the third decade (Dupré et al., 2003). Our group previously reported that the K+/Cl− cotransporter 3 (KCC3), encoded by the SLC12A6 gene, is disrupted in patients with this disorder (Howard et al., 2002). KCC3 belongs to a family of four K+/Cl− cotransporters that have crucial roles in ion homeostasis, cell volume regulation, and modulation of the cellular responses to GABA during neuronal development (Kahle et al., 2008). Structurally, KCC3 has 12 transmembrane domains and both the N and C termini extend into the cytoplasm (Hiki et al., 1999). The predominant mutation found in HMSN/ACC patients consists of a G deletion at the conserved GT splice donor site of exon 18, leading to both aberrant splicing and creation of a novel stop codon at position 813 of the protein (Thr813X), thus prematurely removing most of the C-terminal portion of the protein (338 aa). This suggests that the KCC3 C-terminal domain has an important function. Indeed, phosphorylation of the C-terminal domain was recently shown to play a regulatory role in controlling cell volume (Rinehart et al., 2009).
Neuropathological examinations of postmortem material from HMSN/ACC patients, and previous KCC3 knock-out animal data demonstrate axonal swelling and thin myelin sheaths in peripheral nerves (Howard et al., 2002; Boettger et al., 2003; Dupré et al., 2003). However, whether axonal swelling is a result of damage to the axons or to the myelinating Schwann cells remained unknown. The high incidence (∼58%) of ACC observed in individuals with HMSN/ACC (Mathieu et al., 1990) indicates that KCC3 may play an essential role in the proliferation and/or survival of non-neuronal midline structures that help guide midline-crossing axons. KCC3 may also play a role in the maintenance and/or motility of long axon projections. Although the genetic deletion of Slc12a6 in mouse models was previously shown to produce a phenotype comparable to the disorder observed in humans (Howard et al., 2002; Boettger et al., 2003), the cell types responsible for the different pathological phenotypes have not been dissected.
In the present study, we generated a transgenic mouse line (Slc12a6flox/flox) with LoxP sequences flanking exon 18, allowing tissue-specific deletion of exon 18 that closely mimics the human Thr813X mutation. Using lines expressing Cre recombinase, we generated ubiquitous (Slc12a6Δ18/Δ18) and neuron-specific (nsSlc12a6Δ18/Δ18) KCC3-null mice. Adult mice from both lines had a very similar phenotype during locomotor activity or pain tests, thus supporting a critical role for KCC3 in the nervous system. However, auditory defects observed in the Slc12a6Δ18/Δ18 but not the nsSlc12a6Δ18/Δ18 line suggest a non-neuronal role for KCC3 in auditory sensory perception. High-resolution magnetic resonance imaging reveals hypoplasia (dysgenesis) of the corpus callosum in both mice mutants and a substantial decrease in white matter integrity proximal to the auditory cortex only in Slc12a6Δ18/Δ18 mice.
Materials and Methods
Generation of floxed Slc12a6 and KO mice.
Murine Slc12a6 cDNA sequences are available [GenBank accession numbers AF211854 (mKCC3a) and AF211855 (mKCC3b)]. To obtain the Slc12a6 genomic DNA regions containing exon 18 and its flanking sequences, we PCR amplified three separate fragments from total genomic DNA isolated from mouse line 129/Sv: one 1.2 kb fragment containing exon 17 (5′ arm), one 770 bp fragment encompassing exon 18, and one 2 kb fragment containing exons 19 and 20 (3′ arm). To make a targeting construct for homologous recombination, the fragments containing the 5′ arm, exon 18, and the 3′ arm were subcloned into the pDELBOY-3X vector (Rossi et al., 2001; Korsisaari et al., 2002). The construct also contained a phosphoglycerate kinase (PGK) promoter-driven neomycin resistance cassette (neo, used as a positive selection marker) flanked by the 5′ arm of homology and the targeted exon 18 of Slc12a6, as well as a PGK-driven thymidine kinase gene from HSV (used as a negative selection marker), which lies downstream from the 3′ arm of homology. The neo cassette was closely flanked by two frt sites, and two loxP sites, which were also introduced into intronic sequences, one downstream from the 5′ arm of homology, right before the neo cassette, and the other between the target exon and the 3′ arm of homology. All constructs and DNA fragments were sequenced at each step and checked for correct orientation of fragments.
The linearized targeting vector was electroporated into the ES cells, since recombination rates have been shown to increase with the use of isogenic vector DNA (te Riele et al., 1992), the same line was used for electroporation of the construct. The cells were grown in double selection media and were screened for positive clones by Southern blot or PCR. Two sets of primers were used to verify the 5′ and 3′ arms for correct recombination: For 5′ probe (size 785 bp), a forward primer (F: CAGCCTCCAAAACTGGGAATGAA) located upstream of the 5′ arm was used in combination with a reverse primer (R: AAGACTCGAGTTCTGCAGTACTTTGAATGTTCTCAG) located within the neo cassette. To verify the 3′ end (template size 213 bp), a forward primer (F: TGCAGTGGGCAGCAGTT) was designed to anneal within the target sequence in exon 18, while the reverse primer (R: ATTATTCCTGGTTTTAAGTTCTT) was located downstream from the 3′ arm of homology. For the 3′ end PCR, a KpnI digestion step was added that creates a novel band of 2.3 kb visible by agarose gel electrophoresis in correctly recombined positive clones (instead of an uncut 2.6 kb band). Following electroporation of the vector into the ES cell, two correctly targeted ES cell clones were identified, 1E6 and 2C6, from >1400 clones screened. The two correctly targeted ES cell clones were injected into C57BL/6 mouse blastocysts, and the resultant animals were screened using standard methods. All the experiments reported here were performed with animals that were derived from only one of these two clones (1E6).
List of the primers used for characterization of Slc12a6 mouse lines.
To screen LoxP/LoxP, F: CAGGCTTCCAAGGCCAGCACTGC and R: CCTCCGAGGCCACAGGACTGGAT were used. To screen exon 18 deletions, two sets of primers—F: ATTCTCAGTATTGTTTTGCCAAGTTCT, R: CTTAATCTGATGATCCTGGAAGTTTTA and F: CAGGCTTCCAAGGCCAGCACTGC, R: CCTCCGAGGCCACAGGACTGGAT—were used. To screen PCX-Cre, F: AAGAGGGACAGCTATGACTGG and R: GTGTCTCTCACTCGGAGGGA were used. To screen Syn1-Cre, F: AGGGAGTTTCGTTACTACAGGTCC and R: AGATTGGCCATGAAGTTGCTGTCC were used.
Mouse lines and crosses.
All animal experiments were approved by local animal care and use committees at the Centre Hospitalier de l'Université de Montréal or McGill University. To obtain a pure line, Slc12a6flox/flox transgenic mice were bred with C57BL/6 for at least six generations. Slc12a6 flox/flox homozygous mice were mated once with those from a transgenic line expressing a Cre recombinase under the control of the chicken β-actin promoter (pCX-NLS-Cre, kindly provided by the Nagy Laboratory, University of Toronto, Toronto, ON, Canada) to generate a mouse line in which Slc12a6 was ubiquitously knocked out (Slc12a6Δ18/Δ18). A separate mouse line expressing Cre recombinase under the control of synapsin I regulatory elements (Syn1-Cre, kindly provided by J.-F. Cloutier, McGill University, Montréal, QC, Canada) was used to ablate Slc12a6 expression in a neuron-specific manner (nsSlc12a6Δ18/Δ18). The Slc12a6 flox/+; crepCX or Slc12a6 flox/+; cresyn1 heterozygous mice were then intercrossed to obtain ubiquitous or neuron-specific KO lines, Slc12a6Δ18/Δ18 or nsSlc12a6Δ18/Δ18, respectively. Since the excision of exon 18 occurs in the germ line, it was not necessary to obtain a line homozygous for the crepCX allele. Furthermore, no differences in phenotype were observed in Slc12a6Δ18/Δ18 lines with or without the crepCX allele or between the genders. At least five different pairs of mice were used to obtain the test animals for each dataset of the experiments.
Reverse transcriptase-PCR, Western blot.
RT-PCR was performed using standard protocols using the primers F: GGTAATAGCTGGCATGATCTACAAG, R: TGCACAATCCACCACACATCAAT, and as described previously (Shekarabi et al., 2008). SDS-PAGE was performed on crude brain lysates from mouse brain and kidney. Anti-KCC3 (H00009990-A01, Abnova, 1:1000), anti-tubulin (MAB1637, Millipore Bioscience Research Reagents, 1:1000), and anti-actin (MAB1501, Millipore Bioscience Research Reagents, 1:3000) antibodies were used.
Immunohistochemistry and Epon sections.
All immunohistochemistry and tissue preparations were performed as described previously (Howard et al., 2002; Shekarabi et al., 2008). A mix of anti-axonal markers SMI31 and SMI32 (Covance, each at 1:500), anti-glutamic acid decarboxylase (GAD67; Novus Biologicals, 1:200) followed by donkey anti-mouse Alexa Fluor 488 or anti-rabbit Alexa Fluor 488 (Molecular Probes, all at 1:1000) were used to label axons (Shekarabi et al., 2008), and GABAergic neurons and synaptic terminals, respectively. FlouroMyelin dye (Molecular Probes, 1:300) was used to label myelin. Immunohistochemistry was performed on fixed E17 or P0 of WT, Slc12a6Δ18/Δ18, and nsSlc12a6Δ18/Δ18 brain sections, which were cut at 50 μm on a Leica Vibratome. Primary antibodies were incubated at 4°C overnight, and included rabbit polyclonal anti-glial fibrillary acidic protein (GFAP; DAKO, 1:30,000) and mouse monoclonal anti-growth associated protein-43 (GAP-43; Millipore Bioscience Research Reagents, 1:10,000), anti-Nfia (nuclear factor 1-A; Active Motif, 1:20,000), and anti-Satb2 (Abcam, 1:10,000). Secondary antibodies were incubated at room temperature for 1 h and included goat anti-rabbit biotin-conjugated secondary antibody (Vector Labs) and donkey anti-mouse biotin-conjugated secondary antibody (Jackson ImmunoResearch) at 1:1000 each, followed by avidin-biotin amplification (PK-6100, Vector Labs) and 3,30-DAB (Sigma-Aldrich) visualization. Meyer's hematoxylin (Sigma-Aldrich) was used as a counterstain.
Primary cortical cultures.
Dissociated cortical neurons were prepared from neocortices of Slc12a6D18/D18 KO and WT animals at E15.5 and essentially prepared as described previously (Shekarabi and Kennedy, 2002). The neurons were allowed to grow processes for 4 d. They were then fixed and immunolabeled with an antibody against neurofilament M (Covance, 1:2000). The axon lengths were measured essentially as described previously (Shekarabi and Kennedy, 2002).
Open-field, motor coordination, and startle response tests.
Rotarod and beam tests were performed as previously described (Howard et al., 2002). Open-field locomotor activity was assessed in 5-month-old mice in a bank of eight Versamax Animal Activity Monitor chambers (Model RS2USB v4.00, Accuscan). Each chamber consisted of a clear acrylic open field (40 × 40 × 30 cm high), divided into two equal-sized chambers by an acrylic partition and was covered by an acrylic lid with air holes. Activity was detected via a grid of infrared photo sensors spaced 2.5 cm apart and 6 cm above the floor along the perimeter of the box. An additional bank of 16 photo beams was located 17 cm above the floor and measured vertical activity (i.e., rearing). Mice were individually placed into a chamber, and locomotor activity was recorded for a period of 90 consecutive minutes. Total distance, the number of discrete movement bouts (i.e., periods of activity separated by at least 1 s), and stereotypy counts (i.e., repetitive breaks of the same beam) were cumulated over the 90 min of the test session. The acoustic startle reflex was measured using six startle chambers (San Diego Instruments). Each consisted of a Plexiglas enclosure mounted on a Plexiglas base within a sound-attenuating chamber. A piezoelectric strain meter attached to the base transduced the startle response. Stabilimeter readings were rectified, digitized, and recorded by a computer. A speaker located in the ceiling of the sound-attenuating chamber presented all acoustic stimuli and maintained a constant background noise level of 70 dB. Animals were placed into the Plexiglas enclosure of the startle chamber for a 5 min acclimatization period, after which they were exposed to a total of 36 presentations of an acoustic startle stimulus (30 ms). Stimuli ranged between 80 and 120 dB, in 5 dB increments. There were four trials at each of the nine intensities. An average of 50 1 ms readings, beginning at stimulus onset, was used as the measure of startle amplitude for each trial. Trials were presented randomly, with the on restriction that no more than two consecutive trials with the same stimulus intensity were presented in succession. Trials were separated by a variable intertrial interval that averaged 15 s. The startle chambers were cleaned with a 70% alcohol solution between animals. For data analysis, the average of the four trials at each intensity was taken as the measure of startle reactivity.
Formalin test.
A single cohort of mice [Slc12a6flox/flox (n = 6) and Slc12a6Δ18/Δ18 (n = 8), on their WT littermates (n = 6 and n = 14, respectively); and nsSlc12a6Δ18/Δ18 (n = 8) with its WT littermates (n = 7)] was tested. Approximately equal numbers of male and female mice were tested; no significant sex or sex × genotype interactions were observed. An additional cohort of WT and conditional KO (cKO) mice (n = 3–4/genotype) was also tested with the formalin test to confirm the apparent phenotype. A sampling strategy was used to quantify pain behavior (Langford et al., 2006), such that 5 s of every 1 min period was assessed for the presence or absence of licking behavior directed at the injected hindpaw.
Analysis of agenesis of the corpus callosum and anterior commissure.
To measure the size of the corpus callosum, we used a well established technique of gold chloride staining of the midsagittal plane (Wahlsten et al., 2003). Animals from different genotypes, all with C57BL/6 backgrounds, were compared with their WT littermates. Two-month-old male and female mice were perfused as described previously (Shekarabi et al., 2008), and the brains were dissected out, weighed, and split in the midsagittal plane. The gold chloride staining of myelinated axons was performed as described previously (Bishop and Wahlsten, 1999; Wahlsten et al., 2003). The sagittal cutting face of right hemispheres of all brains was photographed using a Leica DFC 320 camera mounted on a Leica MZ 12.5 stereomicroscope at the same magnification. The length of the corpus callosum (CCL) and the surface area of the anterior commissure (AC) were quantified using ImageJ software (Abramoff et al., 2004) by tracing anterior commissure and the corpus callosum. Because the size of the corpus callosum correlates with brain weight, the length was adjusted to the brain weight average in that group using the linear equation Y′ = Y − b (X − M), where Y′ was the adjusted size, Y was the size, b was the slope, X was the brain weight, and M was the average brain weight (Bishop and Wahlsten, 1999). The splenium was defined as the posterior 20% of the total corpus callosum length, which was established as the boundary between axons from the visual and parietal cortices in rat (Kim et al., 1996; Kim and Juraska, 1997). The genu was defined as the anterior 15% (Mack et al., 1995).
Tractography.
Diffusion-weighted MRI and tractography measure the microstructural properties of white matter tracts and can permit examination of all tracts within a single brain in three dimensions (Moldrich et al., 2010). Three-dimensional, diffusion-weighted spin-echo images were acquired as previously described (Moldrich et al., 2010) using a 16.4 tesla vertical bore, small-animal MRI system (Bruker Biospin; ParaVision v5.0) and a 15 mm linear, surface acoustic wave coil (M2M) at 0.1 × 0.1 × 0.1 mm (uninterpolated) resolution. Each dataset was composed of two b0 values (b value of 0 and 5000 s/mm2, ∂/Δ = 2.5/14 ms) and 30 DW images. Tractography was performed as previously described (Moldrich et al., 2010) using MRtrix (Tournier et al., 2007). Streamline number, fractional anisotropy, diffusivity, and voxel number were obtained for the rostrum, body, and splenium of the corpus callosum, and were plotted using GraphPad Prism V.4.
Statistics.
Behavioral data were analyzed by Student's t test comparing responses between genotypes with unpaired Bonferroni adjustment, using SYSTAT software (v.11). A criterion of α = 0.05 was used to establish statistical significance. One data point was dropped from the formalin test dataset after being identified as a statistical outlier (SD > 3). For tractography, statistical differences between genotypes were assessed using two-way ANOVA and Bonferroni's post hoc t test, where n = 3.
Results
Ubiquitous knockout of KCC3 C terminal in mice causes a severe peripheral neuropathy phenotype similar to HMSN/ACC
To conditionally disrupt the mouse Slc12a6 gene in a manner similar to the human Thr813X mutation, we introduced LoxP sites on either side of exon 18 using a pDELBOY-3X targeting vector (Fig. 1A). Following electroporation of the vector into ES cells, two correctly targeted ES cell clones were identified, one of which (1E6) was used to derive the transgenic mice used in further experiments (Fig. 1B,C). We observed ∼80–85% lower KCC3 expression levels in Slc12a6flox/flox versus Slc12a6+/+ littermates using Western blots of brain lysates probed with an anti-KCC3 antibody (Fig. 1D). The PGK-neo cassette in intron 17 of Slc12a6flox/flox may cause this lower KCC3 protein expression, as previously suggested (Nagy, 2000). Transgenic Slc12a6flox/flox mice were viable and fertile, and showed no signs of neuropathy or motor weakness (Fig. 2A), suggesting that reduced expression of KCC3 protein in vivo is sufficient for normal physiological activities.

Generation of Slc12a6 flox/flox transgenic mice. A, Schematic representation of mouse genomic DNA encompassing exons 15–20 of the Slc12a6 gene, the targeting construct and selection markers, and the predicted recombination between the 5′ and 3′ arms of the construct and the genomic Slc12a6 DNA. The modified allele contains LoxP sites (▶) in introns 17 and 18. The PGK-neo cassette was also flanked with Frt sequences (×) and resides in intron 17 in the same orientation. Arrows (→) indicate primers used for PCR or to generate probes for Southern blot screening of ES clones and animals. P, PstI; Xb, XbaI; B, BamHI; K, KpnI; S, SalI; X, XhoI. B, C, Southern blot analysis and PCR screening experiments used to identify 5′ and 3′ targeted recombination in positive clones using probes and specific primers (see Materials and Methods). D, A representative Western blot analysis of brain and kidney lysates from Slc12a6 flox/flox transgenic animals and WT littermates probed with anti-KCC3 antibody or anti-tubulin antibody (n = 3).

Characterization of Slc12a6 conditional KO mouse lines. A, Tail-clasping test done on Slc12a6Δ18/Δ18 and nsSlc12a6Δ18/Δ18 KO lines at 3–4 weeks of age, compared with Slc12a6flox/flox transgenic mice and WT littermates. Resting appearance of Slc12a6Δ18/Δ18 and nsSlc12a6Δ18/Δ18 mice at 12 months of age exhibiting extensive hindlimb weakness, movement disorganization, and kyphosis (curvature of the upper spine). B, A representative RT-PCR performed on brain mRNA isolated from WT and Slc12a6Δ18/Δ18 mice using primers designed from exon 17 (forward) and exon 20 (reverse). A band of ∼616 bp is seen in the WT, whereas a smaller fragment of ∼450 bp is seen in the Slc12a6Δ18/Δ18 mice (n = 3). C, D, A representative Western blot analysis of brain lysates isolated from Slc12a6Δ18/Δ18 (C) and nsSlc12a6Δ18/Δ18 (D) KO lines and their heterozygous and WT littermates (n = 3), and probed with anti-KCC3 and anti-actin antibodies. A truncated protein with a molecular weight of ∼75 kDa is weakly visible in the heterozygous and KO animals (arrowheads). E, A representative Western blot analysis of kidney lysates from nsSlc12a6Δ18/Δ18 and WT littermate mice using the same antibodies as in C and D, showing reduced KCC3 levels, but absence of the truncated KCC3 (n = 3).
We crossed Slc12a6flox/flox mice with a mouse line (pCX-NLS-Cre) that expresses Cre recombinase in all of its tissues (Nagy, 2000) to produce a line ubiquitously null for KCC3. The resulting Slc12a6Δ18/+; crepCX/+ heterozygous animals presented no abnormalities and were subsequently intercrossed to generate homozygous mice, henceforth referred to as the Slc12a6Δ18/Δ18 line. Slc12a6Δ18/Δ18 mice remained viable until adulthood, but efforts to breed them failed, suggesting they were either infertile or unable to mate. By 3–4 weeks of age, Slc12a6Δ18/Δ18 mice developed progressive neurological defects, which were evident using a clasping test (Fig. 2A).
We confirmed deletion of exon 18 and truncation of the KCC3 protein in Slc12a6Δ18/Δ18 mice by RT-PCR and Western blot analysis. RT-PCR analysis using total brain RNA yielded a lower-molecular-weight product in Slc12a6Δ18/Δ18 mice compared with their WT littermates (Fig. 2B). Sequence analysis confirmed the deletion of exon 18, predicted to cause a frameshift leading to premature protein truncation (Q758LfsX3). Western blot immunodetection using an antibody against KCC3 (Fig. 2C) revealed several bands of ∼150 kDa corresponding to KCC3 in brain lysates prepared from Slc12a6+/+ mice. In Slc12a6Δ18/+; crepCX/+ mice, we could detect the ∼150 kDa bands, as well as a number of lower-molecular-weight bands, whereas in Slc12a6Δ18/Δ18 mice only a very faint band at 75 kDa was detected, suggesting that truncated KCC3 is not stable in the cells in vivo and is likely degraded by intracellular degradation pathways.
Neuron-specific knockout of KCC3 is sufficient to cause severe neuropathy
To assess the functional role of KCC3 in neurons in vivo, we crossed Slc12a6flox/flox mice with animals that express Cre recombinase under the control of synapsin 1 regulatory elements to efficiently mediate DNA excision only in neurons (DeFalco et al., 2001; Zhu et al., 2001). Slc12a6Δ18 /+; cresyn1 mice were viable and showed no signs of neuropathy. Slc12a6Δ18/Δ18; cresyn1 mice were subsequently generated by intercrossing Slc12a6Δ18/+; cresyn1 mice. Slc12a6Δ18/Δ18; cresyn1 KO mice were viable to adulthood, but our efforts to breed them were unsuccessful. These mice showed signs of progressive peripheral neuropathy starting at 3–4 weeks of age and exhibited a phenotype similar to Slc12a6Δ18/Δ18 mice in the clasping test (Fig. 2A). As with the Slc12a6Δ18/Δ18 mice, deletion of exon 18 in these animals was confirmed by RT-PCR and sequencing (data not shown), and reduced levels of the truncated KCC3 were seen using Western blot analysis of brain lysates (Fig. 2D). Kidney lysates prepared from these mice also confirmed overall lower expression of intact KCC3 protein, with no sign of truncated KCC3 (Fig. 2E). Hence homozygous Slc12a6Δ18/Δ18; cresyn1 mice showed a neuron-specific KO, and these animals will henceforth be referred to as the neuron-specific (ns) Slc12a6Δ18/Δ18 line (nsSlc12a6Δ18/Δ18).
Although axon degeneration, hypomyelination, and axon swelling in the sciatic nerves and the CNS were previously described in both KCC3 KO mice and HMSN/ACC cases, the causes behind these symptoms remain obscure. Using immunohistochemistry and histological staining, we observed significant signs of axonal degeneration, hypomyelination, and axon swelling in the sciatic nerves of both KO lines (Fig. 3A). Furthermore, both lines also exhibited extensive axonal degeneration and increased axon diameter in longitudinal sections of sciatic nerves labeled with axon and myelin markers. Cross sections of Epon-embedded sciatic nerves also corroborated these findings (Fig. 3A). These results strongly suggest that a neuron-specific ablation of KCC3 is sufficient to produce a peripheral neuropathy phenotype similar to that seen in HMSN/ACC patients.
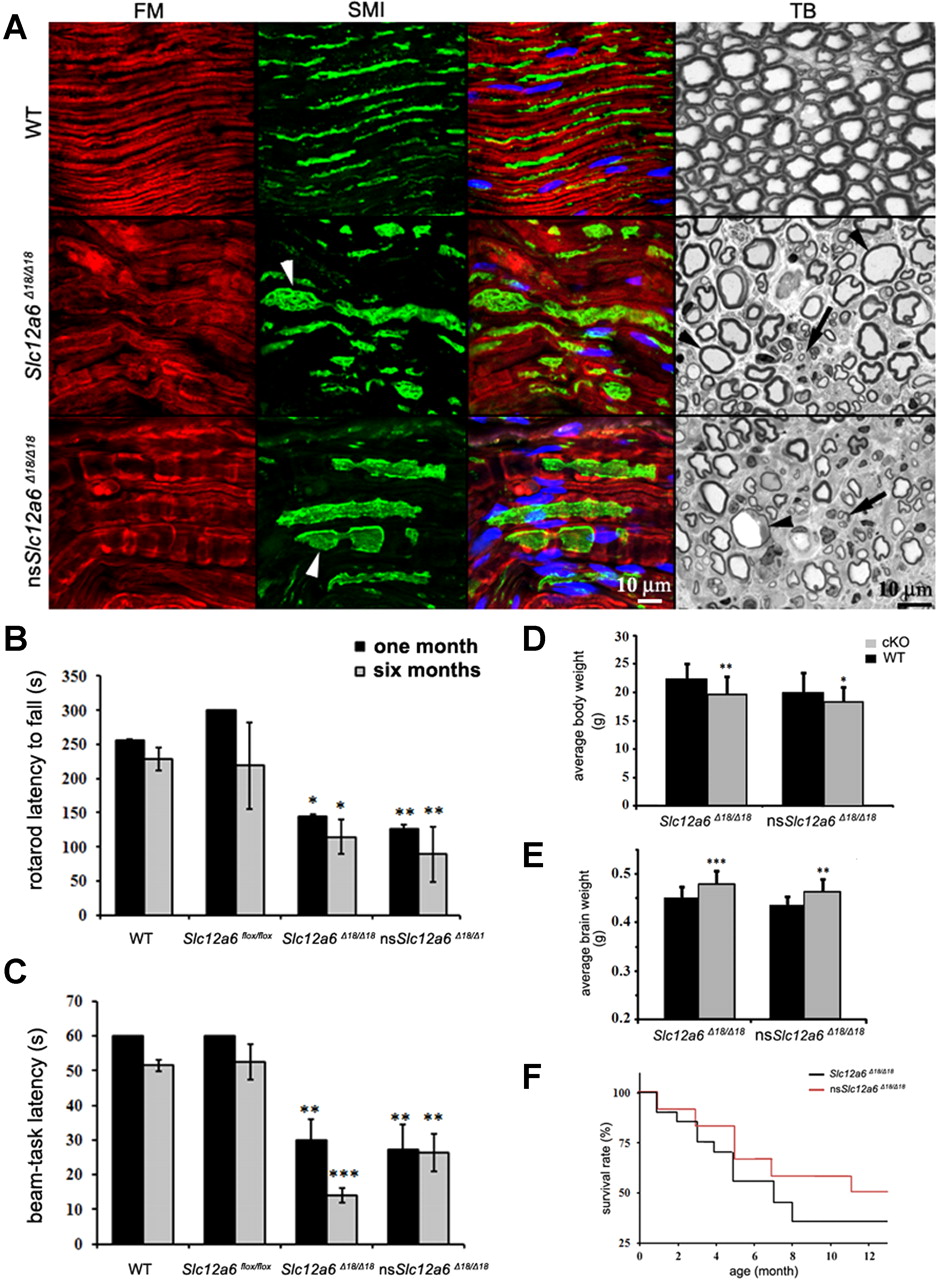
Analysis of sciatic nerves, assessment of locomotor deficits, and changes in body and brain weights and survival rate of Slc12a6 cKO mice. A, Longitudinal sections of sciatic nerves from WT, Slc12a6Δ18/Δ18, and nsSlc12a6Δ18/Δ18 (n = 2) were analyzed using immunolabeling with an antibody against axons (SMI31 and 32; green) and a myelin marker (FlouroMyelin, red). Swollen axons were observed in both KOs (arrowheads). Semithin cross sections of sciatic nerves were also prepared for histological toluidine blue (TB) staining. Numerous swollen axons with thin myelin sheets (arrowheads) and axon degeneration (arrows) were observed in both lines when compared with a WT sciatic nerve section. B, C, Results of rotarod and beam-task tests performed on Slc12a6Δ18/Δ18 (n = 8) and nsSlc12a6Δ18/Δ18 (n = 10) mice at 1 and 6 months of age and compared with WT (n = 12) and Slc12a6 flox/flox (n = 8) littermates. D, Body weights of Slc12a6 conditional KO mice and their respective WT littermates were analyzed at 8 weeks of age (n = 35). E, The same animals were perfused, and their brains were weighed. A significant increase in the brain weights of both KO lines was observed, but their body weights were decreased. For both brain and body weight, the comparison was made using nontransgenic (WT) littermate animals from each line. F, Both KO lines were also monitored for 12 months, and their survival rates were calculated using the Kaplan–Meier method (n = 12). Student unpaired t test; *p < 0.05, **p < 0.005, ***p < 0.001. Data are reported as mean ± SE. Nuclei were stained with TOTO-3 iodide and are shown in blue.
Locomotor and startle response analysis in the conditional Slc12a6 KO mice
Neurodegeneration in KCC3 KO mice causes a progressive sensory and motor disability that worsens with age. We first measured the motor coordination and balance of our Slc12a6flox/flox and both KOs in the rotarod and beam-task tests at 1 and 6 months of age. Both Slc12a6Δ18/Δ18 and nsSlc12a6Δ18/Δ18 KO animals had significantly poor performance in both tests, indicating severe locomotor deficiencies (Fig. 3B,C). Tests performed at 1 month or 6 months of age were not significantly different for either line. These results demonstrate that the severity of the phenotype appears to be stable during the first 6 months in KCC3 KO mice. The locomotor deficit in older animals (>8 months of age) was very severe in both lines, and we were unable to test these animals in locomotor assays. We measured body and brain weights in animals from both KO lines at 2 months of age. The average body weights were 14.1% (p = 0.007) and 8.7% (p = 0.011) lower than those of WT littermates for the Slc12a6Δ18/Δ18 and nsSlc12a6Δ18/Δ18 lines, respectively. However, the average brain weights of the Slc12a6Δ18/Δ18 and nsSlc12a6Δ18/Δ18 lines were 7.2% (p < 0.001) and 6.4% (p < 0.001) greater, respectively, than those from WT littermates (Fig. 3D,E). We also found that Slc12a6Δ18/Δ18 mice have a significantly shorter average lifespan than nsSlc12a6Δ18/Δ18 mice (6.28 vs 8.86 months; p = 0.02) (Fig. 3F), suggesting that Slc12a6Δ18/Δ18 mice may suffer from other non-neuronal health problems.
To evaluate spontaneous locomotor activity, we analyzed our Slc12a6flox/flox, Slc12a6Δ18/Δ18, and nsSlc12a6Δ18/Δ18 lines at 5 months of age using an open-field test. Surprisingly, we found a significant increase in the total distance traveled and the number of movement bouts in both KCC3 KO lines when compared with their WT littermates. Slc12a6flox/flox animals behaved normally. Hence, both KO lines exhibit hyperactivity (Fig. 4A–C).

Locomotor, startle response, and pain tests in Slc12a6flox/flox, Slc12a6 KO lines, and their WT littermates. A–C, Mean of the total traveled distance (A), number of discrete horizontal movement bouts separated by at least a 1 s rest period (B), and total number of times that a single infrared beam was broken repeatedly (C) were measured in Slc12a6flox/flox (n = 7), Slc12a6Δ18/Δ18 (n = 11), and nsSlc12a6Δ18/Δ18 (n = 8) mice (gray boxes), and their WT littermates (n = 8, 14, and 7, respectively, black boxes). D, E, Acoustic startle response was performed in Slc12a6flox/flox (n = 6), Slc12a6Δ18/Δ18 (n = 7), and nsSlc12a6Δ18/Δ18 (n = 8) mice, and compared with their WT littermates (n = 6, n = 10, and n = 10, respectively) with increasing stimulus intensities (in decibels). F–H, Formalin pain tests were performed on Slc12a6flox/flox (n = 6), Slc12a6Δ18/Δ18 (n = 15), and nsSlc12a6Δ18/Δ18(n = 14) mice (gray boxes), and their WT littermates (n = 6, 13, and 15, respectively, black boxes). Bars represent the percentage of 5 s samples featuring licking of the injected hindpaw 0–10 min (early phase) and 10–60 min (late phase) after application of formalin (all mice were tested at 5–6 months of age). *p < 0.05, **p < 0.005, ***p < 0.001. Data are reported as mean ± SE.
The results of the hyperactive phenotypes seen in both Slc12a6 KO lines prompted us to examine GABAergic neurons of adult brains in tissue sections prepared from Slc12a6Δ18/Δ18 and WT animals. We immunolabeled the tissue sections using GAD67 antibody to examine GABAergic neurons and presynaptic terminals. However, no apparent changes in the morphology of cortical or hippocampal GABAergic inhibitory neurons were detected in either group (Fig. 5).

Immunodetection analysis of GABAergic neurons of Slc12a6Δ18/Δ18 and WT littermate mice. Brain sections of Slc12a6Δ18/Δ18 and WT littermates (5 months of age) were prepared and immunolabeled using anti-GAD67 antibodies to label GABAergic neurons (arrows, green) and presynaptic terminals (arrowheads, green) and anti-KCC3 antibodies to label KCC3 (red) (n = 3). Areas of motor cortex were analyzed using sequential scanning by confocal microscopy. No apparent difference was observed between the two groups of mice. However, KCC3 staining was reduced and punctated in neurons derived from Slc12a6Δ18/Δ18 mice, presumably because of the instability of the truncated protein. Nuclei were stained with TOTO-3 iodide and are shown in blue.
The observed changes in the behavioral phenotypes of both lines also encouraged us to examine whether other members of the KCC family with similar cotransporter activity may compensate for loss of KCC3. Using Western blots of brain lysates from Slc12a6Δ18/Δ18 and WT animals, we tested the expression level of KCC1, KCC2, and KCC4 proteins, but no changes were observed (data not shown).
Previous reports on conventional KCC3 KO mice showed auditory impairment (Howard et al., 2002; Boettger et al., 2003). To assess hearing ability in our KCC3 KO lines, we examined our mice in startle response tests. Animals from Slc12a6flox/flox, both KO lines, and their WT littermates were subjected to acoustic startle response tests, and their average signal responses were analyzed. We found that Slc12a6Δ18/Δ18 animals did not respond to the noise, and no increase in startle amplitude was observed with increasing intensities (Fig. 4D). However, Slc12a6flox/flox and nsSlc12a6Δ18/Δ18 animals did respond to increasing intensities, as did the nontransgenic mice (Fig. 4D,E). These experiments suggest that Slc12a6Δ18/Δ18, but not nsSlc12a6Δ18/Δ18 mice suffer from hearing deficiency. Interestingly, the startle response baselines (at low decibels) observed in both KO lines were higher than in the WT littermates (Fig. 4D,E), indicating that there is a spontaneous startle in both lines while they are inside the restrainer. Several KO animal models of cotransporters such as Na+-K+-2Cl− cotransporter 1 (NKCC1), KCC4, and KCC3 have been shown to be hearing impaired (Delpire et al., 1999; Boettger et al., 2002, 2003; Howard et al., 2002), but no pathophysiological evidence was provided to separate the neuronal and non-neuronal elements of the observed phenotypes in the KO lines.
Analysis of inflammatory pain response in Slc12a6 KO mice
We tested Slc12a6flox/flox and both KCC3 KO lines on the formalin test of spontaneous chemical/inflammatory pain. On the more clinically relevant tonic/late phase of the formalin test, whereas no significant changes were observed in Slc12a6flox/flox line (Fig. 4F), both KO mouse lines were significantly less sensitive than their respective WT littermates (p < 0.05 in Slc12a6Δ18/Δ18 and p < 0.001 in nsSlc12a6Δ18/Δ18) (Fig. 4G,H). Hence, these experiments suggest that loss of KCC3 can perturb inflammatory pain responses in both the Slc12a6Δ18/Δ18 and the nsSlc12a6Δ18/Δ18 lines.
Hypoplasia of the corpus callosum in KCC3 KO mice
Although ACC is a common feature in HMSN/ACC patients, it has not been observed in previously reported Slc12a6−/− mice (Howard et al., 2002; Boettger et al., 2003). To assess CC dysgenesis in our Slc12a6 KO lines, we analyzed the length of the CC and the surface area of the AC in 8-week-old Slc12a6Δ18/Δ18 and nsSlc12a6Δ18/Δ18 mice and their WT littermates using gold chloride staining of midline callosal fibers (Table 1) (Fig. 6A,B). We found that the CC length in the Slc12a6Δ18/Δ18 KO line was significantly reduced compared with WT littermates. A smaller but significant decrease in the length of CC was also observed in nsSlc12a6Δ18/Δ18 line. The surface area measurement of the AC also revealed a significant reduction in size but only in Slc12a6Δ18/Δ18 animals. Furthermore, the angle at the intersection of mid anterior–posterior length of the CC, which was drawn to measure the CCL, and a second line from the center of the anterior commissure showed a significant increase in Slc12a6Δ18/Δ18 mice, indicating a reduction in the size of the CC and possibly a shift in its position relative to the AC (Table 1; Fig. 6B). To determine whether the reduction in the CC size is due to a smaller cortical plate, we measured the length of the cortical plate (CPL) in Slc12a6Δ18/Δ18 and nsSlc12a6Δ18/Δ18 mice and their WT littermates, and calculated the CPL/CCL ratio. These measurements confirmed that there is no significant difference in the cortical plate length of both mutants, when compared with their WT littermates (Table 1).
Detailed quantification of the corpus callosum and anterior commissure in Slc12a6 cKO lines (n = 35)

A, The corpus callosum analysis in Slc12a6 KO lines. Both Slc12a6 conditional KO lines were analyzed using gold chloride staining of mid-sagittal cut of the brains and compared with their respective wild-type littermates (only one shown) at 8 weeks of age. B, A representative WT brain that was stained by gold chloride is shown indicating the parameters to measure the CC and AC at midline sagittal plane. C, Cortical neurons were cultured from Slc12a6Δ18/Δ18 and WT embryos at E15.5, and the lengths of axons were compared.
To explore the possible role of KCC3 in axonal outgrowth and elongation in vitro, axonal length of Slc12a6Δ18/Δ18 cultured neurons was measured, but no significant difference was found between Slc12a6Δ18/Δ18 and WT neurons (Fig. 6C).
To further confirm the reduction of CC size in the Slc12a6Δ18/Δ18 line, we measured the total volume of the CC in Slc12a6Δ18/Δ18, nsSlc12a6Δ18/Δ18, and WT littermates by diffusion-weighted MRI (Fig. 7A). In Slc12a6Δ18/Δ18 mice, detailed quantification of the volumes of the rostrum, body, and splenium of the CC revealed a small, but nonsignificant, decrease in the volume of the rostrum and body compared with WT (rostrum t = 0.6316, p > 0.05; body t = 1.026, p > 0.05) (Fig. 7B,C). A similar volumetric observation was made in nsSlc12a6Δ18/Δ18 mice. Considering the entire CC, a significant overall decrease of ∼12% compared with WT was found in Slc12a6Δ18/Δ18 mice (Fig. 7C) (p = 0.0019), and a significant decrease of ∼11% in nsSlc12a6Δ18/Δ18 mice (p = 0.044). Hence, decreases in the rostral components of the CC appear to contribute to an overall reduction in the volume of the CC when measured by MRI. Using diffusion MRI (dMRI) data, streamlines were used to propagate pathways in the brain that are shared by regions of interest, which in this case were the rostrum, body, and splenium of the CC. While no significant differences were found in the number of streamlines passing through each of the three CC regions in either mutant (Fig. 7D), a qualitative decrease in streamlines was observed in the external capsule, which includes projections from the auditory cortices, in Slc12a6Δ18/Δ18 mice (Fig. 7B,E). When streamlines from the splenium were filtered to count only those passing through the external capsule adjacent to the somatosensory cortices, a significant difference in the number of streamlines was found only in the Slc12a6Δ18/Δ18 mice (Fig. 7E) (p = 0.0325, n = 3). Statistical comparison of fractional anisotropy and diffusivity measures (mean, radial, and axial diffusivity) revealed no changes in the splenium that could account for streamline changes in the external capsule (data not shown).

dMRI and tractography reveal subtle hypoplasia of the corpus callosum. A, Representative sagittal view of color-coded dMRI and enlargement of a representative CC showing the regions of interest (ROIs) used for tractography: orange, splenium; yellow, rostrum; remaining green CC, body. The key to tissue color bidirectional orientations in the color-coded dMRI is as follows: blue, dorsal-ventral; green, medial-lateral; red, anterior-posterior. B, Representative dorsal three-dimensional views of CC tractography in WT, Slc12a6Δ18/Δ18, and nsSlc12a6Δ18/Δ18 brains. Each region of tractography has been color coded according to its seed ROI and overlaid on a two-dimensional color-coded dMRI horizontal plane at the level of the anterior commissure. A bilateral streamline deficit appears in the external capsule (ec) of the caudal cortex of the Slc12a6Δ18/Δ18 brain. These streamlines are adjacent to the auditory cortices. C, The number of voxels for each of the ROIs was quantified, giving a measure of volume, while slight, but insignificant, decreases in CC volume were observed in the rostrum and body. When calculated for the entire CC, volume was decreased by ∼12% and 11% of WTs, which were statistically significant, *p = 0.0019 and *p = 0.044, compared with WTs, respectively. D, Streamline number was unchanged in each of the ROIs. E, When streamlines were filtered to isolate those passing through the external capsule adjacent to the auditory cortex, significantly fewer streamlines were found in the Slc12a6Δ18/Δ18 brain (*p = 0.0325, n = 3, compared with WTs, t test). Values represent means ± SE. Scale bar, 1 mm in all images. post., Posterior; ant., anterior.
To assess the presence and integrity of growing axons crossing the midline and in the external capsule during embryogenesis, we used immunohistochemistry for anti-GAP-43 (Fig. 8). In both Slc12a6Δ18/Δ18 and nsSlc12a6Δ18/Δ18 brains, anti-GAP-43 immunohistochemistry was normal, suggesting there was no embryonic defect in axon growth and tract formation that could account for the white matter changes in the adult Slc12a6Δ18/Δ18 mouse. To establish whether there may be any cellular defects at the midline, we used anti-GFAP immunohistochemistry to visualize midline glial cells, which are known to assist midline fusion and express axon guidance molecules (Lindwall et al., 2007). However, in both Slc12a6Δ18/Δ18 and nsSlc12a6Δ18/Δ18 brains, the formation of midline glial populations appeared normal (Fig. 8). An additional mechanism of guidance at the cortical midline occurs via transient neuronal populations that form the subcallosal sling and a cellular corridor for callosal axons to cross the midline (Shu et al., 2003b; Niquille et al., 2009). We stained sections from both KOs and WT littermates with antibodies against the transcription factor Nfia, which labels the subcallosal sling (Shu et al., 2003a) and found it to be intact in both Slc12a6Δ18/Δ18 and nsSlc12a6Δ18/Δ18 brains (data not shown).

Immunostaining of axons and midline glial structures at E17.5 in Slc12a6Δ18/Δ18 KO and WT mice. A, C, E, The integrity of growing axons was assessed using immunohistochemistry for GAP-43 in brain coronal sections from both KO lines and WT mice. B, D, F, The three prominent midline glial populations were found to be present when visualized using immunohistochemistry for GFAP. These glial populations included the indusium griseum glia (IGG), the glial wedge (GW), and the midline zipper glia (MZ). Scale bar, 200 μm. n = 3.
An alternative hypothesis for the reduction in callosal volume may occur because of a defect in the formation of cortical neurons that give rise to the callosal tract. To establish whether the formation of cortical layers and particularly the formation of the upper cortical layers, which give rise to the majority of callosal axons, we examined sections stained with antibodies against Satb2 (Alcamo et al., 2008), which labels callosal neurons, and Nfia, which labels the corticofugal projections of the deep cortical layers (Plachez et al., 2008). Both markers showed that the formation of the cortical layers giving rise to the projection neurons of the cerebral cortex appeared normal at P0 in both Slc12a6Δ18/Δ18 and nsSlc12a6Δ18/Δ18 brains (data not shown).
Together, these results suggest that embryonic development of the CC is unaffected in Slc12a6Δ18/Δ18 and nsSlc12a6Δ18/Δ18 brains.
Discussion
KCC3 protein expression is widely detected in mouse tissues. KCC3 consists of two main splice isoforms that are different in their first exon. KCC3a is widely expressed in tissues such as brain, kidney, muscle, lung, and heart, while KCC3b expression is more limited to kidney (Hiki et al., 1999; Le Rouzic et al., 2006). To understand the main site of cellular pathology in HMSN/ACC and the physiological function of KCC3 in vivo, we generated two Cre-mediated transgenic lines in which KCC3 was ablated in all tissues or only in neuronal cells. Deletion of Slc12a6 exon 18 leads to skipping of the exon in the mRNA, frameshifting of the open reading frame, and premature truncation of the protein. This leads to an unstable KCC3 protein undetectable by Western blot in KO animals, and closely mimics the Thr813X mutation seen in human HMSN/ACC patients. This finding suggests that the KCC3 C-terminal domain may be required for its trafficking or for its stability at the plasma membrane. Indeed, tyrosine phosphorylation in the C-terminal domain of the closely related KCC2 was recently shown to affect KCC2 degradation and membrane localization (Lee et al., 2010). Whether the truncated KCC3 can induce lysosomal pathways or alter its trafficking remains to be determined.
Both cKO lines developed severe neuropathy, with locomotor and sensory deficits. The nsSlc12a6Δ18/Δ18 mice survived longer and had slightly greater body weights than Slc12a6Δ18/Δ18 mice, possibly because the nsSlc12a6Δ18/Δ18 mice had fewer non-neuronal deficiencies. Interestingly, the Slc12a6flox/flox mice had no noticeable phenotype despite having only a small fraction of the normal amount of KCC3 protein expressed. Unlike the null mutants, the full-length protein is present in Slc12a6flox/flox mice, evidently conferring a necessary degree of function. This observation suggests that treatments that would restore only a small fraction of the normal amount of KCC3 might be a viable treatment strategy.
The crucial role of neuronal KCC3 protein in regulating peripheral axon volume
The KCC3 cotransporter was proposed to act predominantly as a regulator of cell volume by passively exporting intracellular potassium and chloride (Mount et al., 1999) by a process modulated by the WNK1 kinase through phosphorylation of specific sites in the C-terminal domain (Rinehart et al., 2009). Our results show that loss of KCC3 activity only in neurons leads to axonal swelling and axon degeneration. The observed accumulation of periaxonal fluid in nsSlc12a6Δ18/Δ18 mice may result from repeated axon swelling, leading to degeneration. Hence HMSN/ACC appears to be primarily a neuronal disease with KCC3 playing a prominent role in controlling axon volume. This further suggests that in the peripheral nervous system myelinating Schwann cells may not play a prominent role in axon swelling and the neuronal degeneration seen in HMSN/ACC patients and previous KCC3 KO mouse models (Delpire and Mount, 2002; Sun et al., 2010). Using IHC, Pearson et al. (2001) have suggested that KCC3 is expressed in white matter tracts, but Boettger et al. (2003) reported no LacZ staining in white matter tracts or the corpus callosum of a LacZ-expressing KCC3 KO mouse. We recently addressed these conflicting findings using combined in situ hybridization and immunohistochemistry; we found no evidence for KCC3 expression in oligodendrocytes (Shekarabi et al., 2011). Overall, these results suggest that neuronal KCC3 expression is sufficient to cause axonal swelling. Our observation of poor locomotor performance at 1 month of age suggests that the disability is caused by early-onset progressive peripheral nerve degeneration.
Both KCC3 and KCC4 KO mice exhibit auditory impairments due to structural defects in the organ of Corti (Boettger et al., 2002, 2003). Interestingly, our nsSlc12a6Δ18/Δ18 but not our Slc12a6Δ18/Δ18 line could respond to increasing startle pulse intensities, suggesting that the auditory impairments previously reported were not due to neuronal KCC3 loss and neurodegeneration in the CNS. Ablation of NKCC1, which has a major role in Cl− uptake, also causes deafness in mice, and this was suggested to have a non-neuronal origin (Delpire et al., 1999; Dixon et al., 1999). This may imply a regulatory role for KCC3 and NKCC1 in the development and/or maintenance of non-neuronal auditory structures or K+ recycling in the inner ear (Couloigner et al., 2006). The extent of axonal degeneration in both lines also suggests that the peripheral nerve axon fibers may be much more sensitive to their osmotic environment than central axons, possibly indicating the importance of supporting cells and/or neuronal environment in susceptibility of axons to degeneration.
Neuronal KCC3 deficiency may cause the sensorimotor phenotypes
Using rotarod, beam-task, and open-field tests, we measured motor abilities in both of our KCC3 KO lines. While both lines demonstrated pronounced motor deficiencies beginning at 1 month of age, paradoxically they also both showed hyperactivity in the open field. This finding indicates that neuronal hyperexcitability, presumably due to chloride imbalance in the CNS, precedes a complete disability at the later age.
We used acute and tonic inflammatory pain tests to identify potential differences between both KCC3 KO lines and their WT littermates. A significant reduction in sensitivity to inflammatory pain on the late-phase formalin test was observed. This suggests that KCC3 may be important in the transmission of inflammatory pain signals in CNS sensory neurons, a novel finding since KCC3 (Byun and Delpire, 2007), KCC2 (Tornberg et al., 2005), and NKCC1 (Laird et al., 2004) mutants have never been tested for inflammatory pain sensitivity.
Western blots using Slc12a6Δ18/Δ18 brain lysates from our KCC3 KO animals show no changes in expression levels of the other KCC members, suggesting that there is no compensatory upregulation of other KCC members (data not shown). This indicates that KCC3 has a specific molecular role in cells. KCC2 is expressed in CNS tissues (Rivera et al., 1999) where its transport activity appears not be dependent on cell swelling, as it also operates under isotonic environment (Gamba, 2005). We have previously shown that in CNS KCC3 is predominantly detected in neurons (Shekarabi et al., 2011). This, along with our current results, suggests that KCC3 and KCC2 may be coexpressed in neurons but act in parallel pathways in these cells. Nonetheless, our previous work on brain-specific creatine kinase-dependent activation of KCC3 (Salin-Cantegrel et al., 2008) and that of others on KCC2 (Inoue et al., 2006) suggest shared regulatory pathways for both cotransporter functions. However, KCC2 was shown to function in developing synapses by interacting with the synaptic cytoskeleton protein 4.1N independently of its Cl− transport activity, but no such an association was observed for KCC3 (Li et al., 2007). If KCC3, like KCC2, has an independent nontransport function, it remains to be shown (Horn et al., 2010).
Role of KCC3 in the development of the corpus callosum
Agenesis of the CC is a common yet inconsistent observation in HMSN/ACC patients, but is not seen in Slc12a6−/−null mice, suggesting that additional genetic or extrinsic factors control this trait. Although both our KO mouse lines retained the CC, both mice displayed a reduction in the size and volume of the CC, mainly in the rostrum and body. Our findings are also consistent with the variable penetrance of ACC seen in HMSN/ACC patients. The development of the CC occurs both embryonically and postnatally in mice and requires multiple developmental events, including the formation of projection neurons in the cerebral cortex and their extension of axons forming the corpus callosum and their subsequent guidance by molecules expressed by midline glial and neuronal structures (Lindwall et al., 2007). We examined these events and found that development of the corpus callosum appeared normal in both Slc12a6Δ18/Δ18 and nsSlc12a6Δ18/Δ18 brains. The results suggest that KCC3 is more likely to be involved in the maintenance of callosal axons throughout life and that KCC3 may not play a significant role in axonal outgrowth and elongation during CNS development.
The current study establishes a role for KCC3 in both CNS and peripheral nervous system maintenance and thus provides novel insights into how loss of KCC3 leads to HMSN/ACC as well as further defining its role in neuronal and non-neuronal tissues.
Footnotes
- Received July 18, 2011.
- Revision received October 20, 2011.
- Accepted November 16, 2011.
This work was supported by a Canadian Institutes of Health Research-Neuromuscular Research Partnership Program operating Grant (201671) to G.A.R. and P.A.D., and a grant from the Fondation des Jumelles Coudé to G.A.R., L.J.R. is supported by a National Health and Medical Research Council, Australia Principal Fellowship. J.S.M. is supported by the Louise and Alan Edwards Foundation. G.A.R. holds the Canada Research Chair and the Jeanne-et-J.-Louis-Levesque Chair for the Genetics of Brain Diseases. We thank T. P. Makela for the pDELBOY-3X vector, J.-F. Cloutier for the Syn1-Cre mouse line, A. Nagy for the ES cells and the pCX-NLS-Cre mouse line; and R. G. Lafrenière for editing this manuscript.
The authors declare no competing financial interests.
- Correspondence should be addressed to Guy A. Rouleau, Center of Excellence in Neuroscience the Université de Montréal (CENUM), University of Montreal, 1560, rue Sherbrooke East, De-Seve Pavilion, Room Y-3616-2, Montréal, QC H2L 4M1, Canada. guy.rouleau{at}umontreal.ca
- Copyright © 2012 the authors 0270-6474/12/323865-12$15.00/0
References
- Abramoff et al., 2004.
- Alcamo et al., 2008.
- Bishop and Wahlsten, 1999.
- Boettger et al., 2002.
- Boettger et al., 2003.
- Byun and Delpire, 2007.
- Couloigner et al., 2006.
- DeFalco et al., 2001.
- Delpire and Mount, 2002.
- Delpire et al., 1999.
- Dixon et al., 1999.
- Dupré et al., 2003.
- Gamba, 2005.
- Hiki et al., 1999.
- Horn et al., 2010.
- Howard et al., 2002.
- Inoue et al., 2006.
- Kahle et al., 2008.
- Kim and Juraska, 1997.
- Kim et al., 1996.
- Korsisaari et al., 2002.
- Laird et al., 2004.
- Langford et al., 2006.
- Lee et al., 2010.
- Le Rouzic et al., 2006.
- Li et al., 2007.
- Lindwall et al., 2007.
- Mack et al., 1995.
- Mathieu et al., 1990.
- Moldrich et al., 2010.
- Mount et al., 1999.
- Nagy, 2000.
- Niquille et al., 2009.
- Pearson et al., 2001.
- Plachez et al., 2008.
- Rinehart et al., 2009.
- Rivera et al., 1999.
- Rossi et al., 2001.
- Salin-Cantegrel et al., 2008.
- Shekarabi and Kennedy, 2002.
- Shekarabi et al., 2008.
- Shekarabi et al., 2011.
- Shu et al., 2003a.
- Shu et al., 2003b.
- Sun et al., 2010.
- te Riele et al., 1992.
- Tornberg et al., 2005.
- Tournier et al., 2007.
- Wahlsten et al., 2003.
- Zhu et al., 2001.