
Abstract
Altered neuronal calcium homeostasis is widely hypothesized to underlie cognitive deficits in normal aging subjects, but the mechanisms that underlie this change are unknown, possibly due to a paucity of direct measurements from aging neurons. Using CCD and two-photon calcium imaging techniques on CA1 pyramidal neurons from young and aged rats, we show that calcium influx across the plasma membrane increases with aging, and that this change is countered by increased intracellular calcium buffering. The additional buffer in aging neurons balances the increased calcium influx following a small number (<3) action potentials, but is overwhelmed during sustained or theta-like activity which leads to a greater rise in intracellular calcium concentration in aging than that in young neurons. Our results demonstrate that calcium overload occurs regularly in aging CA1 pyramidal neurons under physiological conditions. This overload may be a critical factor in age-related decline in hippocampus-dependent cognitive function.
Introduction
The calcium hypothesis of brain aging (for review, see Gibson and Peterson, 1987; Landfield, 1987; Khachaturian, 1989; Disterhoft et al., 1994) has been a theoretical touch-point for neuroscientists studying aging-related alterations of brain function and cognitive deficits. A tenet of the hypothesis is that homeostatic cellular mechanisms that regulate cytosolic free calcium in neurons are changed during the normal aging process and that these changes contribute to aging-related cognitive deficits. However, evidence for the hypothesis, thus far, has been mixed. Numerous studies have reported increased levels of resting free Ca2+ ions in aging subjects (Michaelis et al., 1992; Kirischuk and Verkhratsky, 1996; Tonkikh et al., 2006; Hajieva et al., 2009), although there are also reports of no change (Murchison and Griffith, 1998; Thibault et al., 2001; Gant et al., 2006) or reduced (Gibson and Peterson, 1987) levels of free Ca2+ with aging. There have also been reports of changes in endogenous calcium buffer capacity during aging. For example, endogenous buffer capacity is enhanced in dissociated basal forebrain neurons of aged rats (Murchison and Griffith, 1998). However, many reports conclude that endogenous buffer capacity is reduced in intact neurons from aging animals, especially in the hippocampus (Tonkikh et al., 2006; Kumar et al., 2009). Hence, there are conflicting reports regarding which elements of calcium homeostasis change with aging and the direction of these changes. In some cases the contradictory conclusions may result from different methodologies (e.g., from different rodent species or strain, cell type, indicator, method of loading indicator, and calibration), but in many studies these conclusions were drawn from indirect measurements and there is a general paucity of direct measurements of calcium metabolism from aging neurons.
Here we provide evidence of aging-related alteration in calcium homeostasis by directly examining calcium metabolism (calcium influx, resting calcium concentration, and endogenous buffer capacity) in the proximal apical dendrite of CA1 pyramidal neurons in acute slices prepared from young adult (2–4-month-old) and aging (29–31-month-old) rats, using fluorescence-based calcium imaging techniques. Our results indicate that action potential-evoked calcium influx and the endogenous buffer capacity of CA1 pyramidal neurons are both increased during aging, suggesting that pharmacological manipulations that further increase calcium buffer capacity in aging neurons may rescue the cognitive deficits observed in normal aging subjects.
Materials and Methods
Subjects.
Young adult (2–4-month-old) and aged (29–31-month-old) male Fischer 344 × Brown Norway rats were used in this study. We followed procedures that were approved by the Northwestern University's Animal Care and Use Committee and that were in accordance with the guidelines established by the National Institutes of Health Guide for the Care and Use of Laboratory Animals and the Society for Neuroscience.
Hippocampal slice preparation.
Three-hundred-micrometer-thick transverse hippocampal slices were prepared using a Leica VT1000 s vibratome as described previously (Moyer and Brown, 1998; McKay et al., 2009). Briefly, rats were deeply anesthetized with isoflurane and decapitated. The brains were quickly removed, immersed in ice-cold cutting solution bubbled with 95% O2/5% CO2 and sliced. For young-adult rats, the cutting solution was the artificial CSF (aCSF) used throughout the experiments and was composed of the following (in mm): 125 NaCl, 2.5 KCl, 1.25 NaH2PO4, 26 NaHCO3, 2 CaCl2, 1 MgSO4, and 25 glucose. For the aged rats, the cutting solution was a sucrose-aCSF that contained the following (in mm): 206 sucrose, 2.5 KCl, 1.25 NaH2PO4, 26 NaHCO3, 0.1 CaCl2, 3 MgSO4, and 25 glucose. The cut slices were transferred immediately to a warm (37°C) submerged holding chamber filled with aCSF and kept in this chamber for 30 min. Afterward, the slices in the warmed submerged holding chamber were allowed to gradually return to room temperature (22–25°C) for at least another 30 min before use.
Electrophysiology.
Slices were placed in a submerged recording chamber and were perfused with oxygenated aCSF warmed to 32–34°C using an in-line heater and temperature controller (Warner Instruments). Whole-cell recordings were made from visualized CA1 pyramidal neurons using either a CCD camera (C4742-95, Hamamatsu) mounted on a Leica DM LFS or a near IR camera (IR1000, Dage MTI) mounted on an Olympus BX51 microscope; both microscopes were equipped with long working distance 40× (0.8 NA) water-immersion objectives and infrared differential interference contrast optics. Patch pipettes were 4–6 MΩ when filled with an internal solution containing the following (in mm): 120 K-MeSO4, 10 KCl, 10 HEPES, 10 Na2-phosphocreatine, 4 Mg2-ATP, 0.4 Na3-GTP, 20 μm Alexa 594, and a calcium indicator.
A cell was omitted from further analysis if the holding current necessary to hold the membrane potential at −70 mV exceeded ± 200 pA. Resting membrane potential was measured immediately after breaking into the cell. Input resistance was calculated as the slope of the voltage-current curve using 500 ms current steps from −300 pA to 200 pA at 50 pA steps. Action potentials (APs) were evoked using brief current pulses (2 ms, 2.5 nA). AP threshold was measured where the first derivative of the up phase of the trace was equal 40 mV/ms. AP amplitude was calculated as the difference from the maximum depolarization and the AP threshold. Electrophysiological data were acquired with a Multiclamp 700B or an Axoclamp 2A amplifier (Molecular Devices) and digitized at 10 kHz (filtered at 2–3 kHz) using Winfluor software (Dr. John Dempster, University of Strathclyde, UK) or routines in Labview 8.5 (National Instruments).
CCD imaging.
Oregon green BAPTA-1 [(OGB-1) Invitrogen] was added to the intracellular recording solution. Fluorescence was collected using a 40×/0.8 NA water-immersion objective (Leica Microsystems) and a CCD camera at 43 Hz. The slice was illuminated during data collection with a blue LED (Thorlabs), and the emitted green light was detected through a 505 nm long-pass dichroic mirror and a 512–542 nm bandpass emission filter (L5 cube, Leica Microsystems). Photobleaching was minimized by using minimal light intensity to illuminate the slice in all experiments. Custom Labview (National Instruments) routines were used to simultaneously acquire electrophysiology and fluorescence data.
Two-photon laser scanning fluorescence microscopy.
Two-photon laser scanning fluorescence microscopy (2PLSM) was performed using a modified Bio-Rad Radiance MPD system or with a microscope designed and built by J.W. and based on an Olympus BX51 frame. The specimen was illuminated with 830 nm light from a Ti:sapphire laser (Chameleon Ultra, Coherent Scientific; 80 MHz repetition rate, 100–150 fs pulse width). Excitation light was focused onto the specimen using a 40×, 0.8 NA water-immersion objective (Olympus). Emitted light was collected in the epifluorescence configuration through a 680 nm dichroic reflector and an infrared-blocking emission filter (ET700sp-2p, Chroma Technology). Fluorescence was split into red and green channels with a secondary dichroic reflector (570 DCXR, Chroma Technology) and detected via 490–560 nm and 575–645 nm bandpass filters (Chroma Technology) using photomultiplier tubes (R6357, Hamamatsu). Scanning and image acquisition were controlled using custom software written in Labview (National Instruments). Results were collected with line scans at 166 or 500 Hz perpendicular to the apical dendrite.
Calculation of intracellular calcium concentration from OGB-1 fluorescence.
OGB-1 (Invitrogen) was added to the intracellular recording solution. For CCD experiments, steady-state calcium measurements were made after the amplitude and decay time constant of the calcium transient became stable through time (≥ 25 min after break-in). For 2PLSM experiments in which calcium transients were monitored during loading of indicator, changes in both the basal fluorescence and the peak amplitude of calcium transients evoked with single action potentials were measured repeatedly as indicator diffused into and reached steady-state within the apical dendrite, beginning 3–10 min after break-in and extending for up to 65 (typically 40–60) min. The baseline fluorescence at each time point was calculated from the mean fluorescence in the first 250 ms of the trial, before any action potentials. The peak of the calcium transient was measured by fitting an exponential to the decaying phase of the transient and back extrapolating this fit to the time of the action potential.
Calculations were performed as described previously (Neher and Augustine, 1992; Neher, 1995; Maravall et al., 2000).
Calcium concentration was calculated using Equation 1 (Maravall et al., 2000):
 where, Δ[Ca2+] is the rise in calcium concentration, Fmax is the fluorescence at saturation, F0 is the resting fluorescence, Rf is the dynamic range of the indicator, ΔF/F is the change in fluorescence divided by the resting fluorescence, (ΔF/F)max is the ΔF/F at saturation.
We used a value of 8.5 for Rf (for OGB-1) (Maravall et al., 2000). Fmax was calculated for each recording from Equation 2, after using trains of action potentials at 50 and 100 Hz to establish maximal (plateau) ΔF/F values:
 where x is a correction factor:
 where υ1 and υ2 are the lower and higher frequencies driving the action potentials and Q is the ration of plateau fluorescence at higher and lower frequencies (Maravall et al., 2000).
The resting calcium concentration ([Ca2+]0) was determined using equation 4 (Maravall et al., 2000):
 The buffer capacity of the indicator (κB) was calculated using equation 5 (Maravall et al., 2000):
 where [B]T is the total concentration of the dye used during the experiment, and [Ca2+]peak is the calcium concentration at the peak of the calcium transient.
Endogenous buffer capacities were calculated by back-extrapolation of the relationship between the reciprocal of the peak amplitude of the calcium transient and the exogenous buffer capacity (see Fig. 2C). Like previous authors, we found that the peak amplitude of the calcium transient declined during prolonged recording, leading to an abrupt upswing in the plot (Neher and Augustine, 1992; Maravall et al., 2000). This upswing occurred in all of our recordings, 34 ± 2.9 min (max 50 min; n = 15 recordings) after obtaining the whole-cell configuration. Where steady-state was not achieved before the upswing occurred, the recording was excluded from further analysis. In recordings where a steady-state was achieved >5 min before the upswing, we discarded points after the upswing.
Calculation of intracellular calcium concentration from OGB-6F fluorescence.
During a train of action potentials, OGB-1 can approach saturation. Hence for some experiments, we used the lower-affinity indicator OGB-6F (Kd = 3 μm). We found that 150 μm OGB-6F offers an adequate signal-to-noise ratio to resolve AP-evoked signals and enough dynamic range to avoid indicator saturation, but adds minimal buffer capacity to the neuron and therefore reports nearly unperturbed calcium signals.
The approach of Maravall et al. (2000) is less suited to the calibration of calcium signals with OGB-6F and we therefore used the approach described by Bloodgood and Sabatini (2007). We simultaneously measured the fluorescence of OGB-6F and Alexa 594. Calcium transients were quantified as increases in green (OGB-6F) fluorescence divided by the red (Alexa 594) fluorescence. Calcium concentrations were then calculated using Equation 6 (Bloodgood and Sabatini, 2007):
 where, Gmax/R is the G/R ratio at saturation.
We measured Gmax/R by imaging a pipette containing intracellular solution (including OGB-6F and Alexa 594) and 1 m CaCl2 (Bloodgood and Sabatini, 2007).
Statistical analysis.
Results were analyzed using custom routines written in IgorPro v6.2.1 (WaveMetrics). Statistical analyses were performed with Statview v5.0.1, (Sigma-Aldrich) Plot v11 and Systat v12 software. Unless indicated otherwise, results are shown as mean ±SEM.
Results
Calcium buffer capacity is increased in aging CA1 neurons
We obtained somatic whole-cell recordings from hippocampal CA1 pyramidal neurons in young and aging male Fischer 344 × Brown Norway rats. Basic membrane properties and spike waveforms were similar in young and aging rats (Table 1). To investigate calcium handling in these neurons we used the “added buffer” approach, in which many parameters underlying calcium handling are measured from the change in amplitude and time course of intracellular calcium signals when additional calcium buffer, in the form of calcium indicator, is added to the neuron (Neher and Augustine, 1992; Helmchen et al., 1996). Different concentrations of OGB-1 were added to the cytoplasm of CA1 neurons through the recording pipette, resulting in neurons containing different exogenous calcium buffer capacities (κB). Steady-state level of OGB-1 was determined for each neuron before data collection by ensuring that the single action potential evoked calcium measurements (the amplitude and decay time constant) were stable after ≥25 min of OGB-1 loading. As expected, in neurons from both young and aged rats, an action potential evoked large, rapidly decaying relative changes in fluorescence (ΔF/F) in neurons loaded with low concentrations of OGB-1 and smaller-amplitude, slower-decaying fluorescence transients in neurons containing higher concentrations of the indicator (Fig. 1A).
Membrane properties of CA1 pyramidal neurons

Endogenous buffer capacity is enhanced in aging CA1 pyramidal neurons. Widefield image of a CA1 pyramidal neuron loaded with 200 μm OGB-1 (bottom left). White box, Region of interest (ROI) where calcium transients were measured, ∼40 μm from the soma. Dotted white boxes, Background regions. Scale bar, 40 μm. A, Example calcium transients evoked by an action potential in neurons loaded with different concentrations of OGB-1 and measured using a CCD camera. B, Reciprocal amplitude of calcium transients (1/Δ[Ca2+]) plot against exogenous buffer capacity (κB). The R values and the slopes of the linear extrapolation were 0.771 and 0.000,124 (p values < 0.0001) for young, and 0.742 and 0.000,078 (p values < 0.0001) for aging. Each point represents one neuron loaded with 25, 50, 75, 100, 150, or 200 μm OGB-1 (29 neurons from 12 young adult rats, 24 neurons from 9 aged rats). C, No significant difference was observed in the peak amplitude of calcium transients evoked with single action potentials in CA1 neurons from young and aging rats that were loaded with 25 μm OGB-1 (5 neurons from 3 young adult rats, 6 neurons from 5 aged rats). The figure illustrates the data obtained for each individual neuron (small circles) and the mean ±SEM (larger circle). D, Resting calcium concentration in young and aging CA1 neurons (29 neurons from 12 young adult rats, 24 neurons from 9 aged rats).
We estimated the unperturbed change in intracellular calcium concentration that would have been observed in the absence of OGB-1 (κB = 0) (Fig. 1B) and the endogenous calcium buffer capacity (κs: x-intercept −1) (Fig. 1B) by plotting the peak amplitudes of calcium transients (Δ[Ca2+]) in response to a single action potential as a function of the buffer capacity of the indicator (κB). The peak amplitude of the unperturbed calcium transient was similar for CA1 neurons from the two age groups (Fig. 1B) (young 83 nm; aging 100 nm) and was also similar in neurons loaded with a low concentration of indicator (25 μm OGB-1, young 76 ± 6 nm; aging 88 ± 17 nm, p > 0.05) (Fig. 1C). The endogenous buffer capacity in young rats was 80, similar to that previously reported for neonatal CA1 neurons (Helmchen et al., 1996; Maravall et al., 2000), but for aging CA1 neurons was 155. We also measured the resting intracellular calcium concentration, which was reduced by ∼30% in CA1 neurons from aging rats, from 115 ± 10 nm in young adults to 81 ± 9 nm in aging rats (p < 0.05) (Fig. 1D). Hence, aging neurons contain almost twice as much endogenous calcium buffer as neurons from young adult rats.
These results are the first to demonstrate enhanced endogenous calcium buffer capacity and reduced resting calcium concentration in apical dendrites of CA1 neurons from aging animals. However, these measurements were necessarily made at steady-state, 25–30 min after break-in and after dialysis of the neuronal cytoplasm with pipette solution. Hence, mobile endogenous buffers may have been lost before our measurements were made. In addition, it is difficult to place confidence intervals on the endogenous buffer capacities calculated in this manner (but see Aponte et al., 2008). We therefore performed additional measurements using a similar approach, but measuring calcium transients during diffusion of indicator into the neuron. This permits calculation of the endogenous buffer capacity and unperturbed calcium transient for each individual neuron (Helmchen et al., 1996; Maravall et al., 2000) and therefore facilitates statistical comparison of measurements from young and aging neurons.
Changes in the basal fluorescence (f0) and calcium transients evoked with single action potentials were measured repeatedly as 100 μm OGB-1 diffused into and reached a steady-state concentration within the apical dendrite (Fig. 2). These dynamic measurements yielded almost identical results to those made under steady-state conditions. There was no difference in the unperturbed peak calcium concentration evoked with a single action potential (Fig. 2E), but endogenous buffer capacities differed in young and aging neurons (Fig. 2D) (39 ± 6 in young and 70 ± 10 in aging neurons, p < 0.05, unpaired t test). Hence endogenous buffer capacity is elevated in aging neurons.

Endogenous buffer capacity and unperturbed calcium transient measured in individual neurons. A, Maximum intensity projection of a neuron. Measurements were made using a line scan (dashed line) 40–80 μm from the soma. Example calcium transients taken during loading of 100 μm OGB-1, 7, 20, and 50 min after breaking whole-cell. B, Example of the increase in resting fluorescence (f0, arbitrary units) over time as OGB-1 diffused into and approached a steady-state concentration in the dendrite. Points are fit with an exponential. C, Example of endogenous buffer capacity calculated by back-extrapolation of the relationship between the reciprocal amplitude of calcium transients (1/Δ[Ca2+]) plot against exogenous buffer capacity (κB) for the results in (B). In this example neuron, there was an abrupt reduction in the amplitude of Ca2+ transients at 50 min, causing an upswing in the plot. The points after 50 min (open circles) were discarded before fitting a line through the results. D, The endogenous buffer capacity is significantly enhanced in neurons from aging rats (*p < 0.05, unpaired t test). E, Peak amplitude of the unperturbed calcium transient evoked with a single action potential is not significantly altered with aging (young, 8 neurons from 4 rats, 342 ± 65 nm; aging, 7 neurons from 5 rats, 206 ± 29 nm).
We would expect an elevated endogenous calcium buffer capacity to slow the time course of calcium changes in aging rats (Helmchen and Tank, 2005). We compared the rate of change in calcium concentration in young and aging rats during trains of action potentials at 50 Hz. As expected, the rate of rise of the fluorescence was slower in neurons from aging than from young adult rats (Fig. 3A) (young 60 ± 5 ms, aging 80 ± 8 ms, p < 0.05).
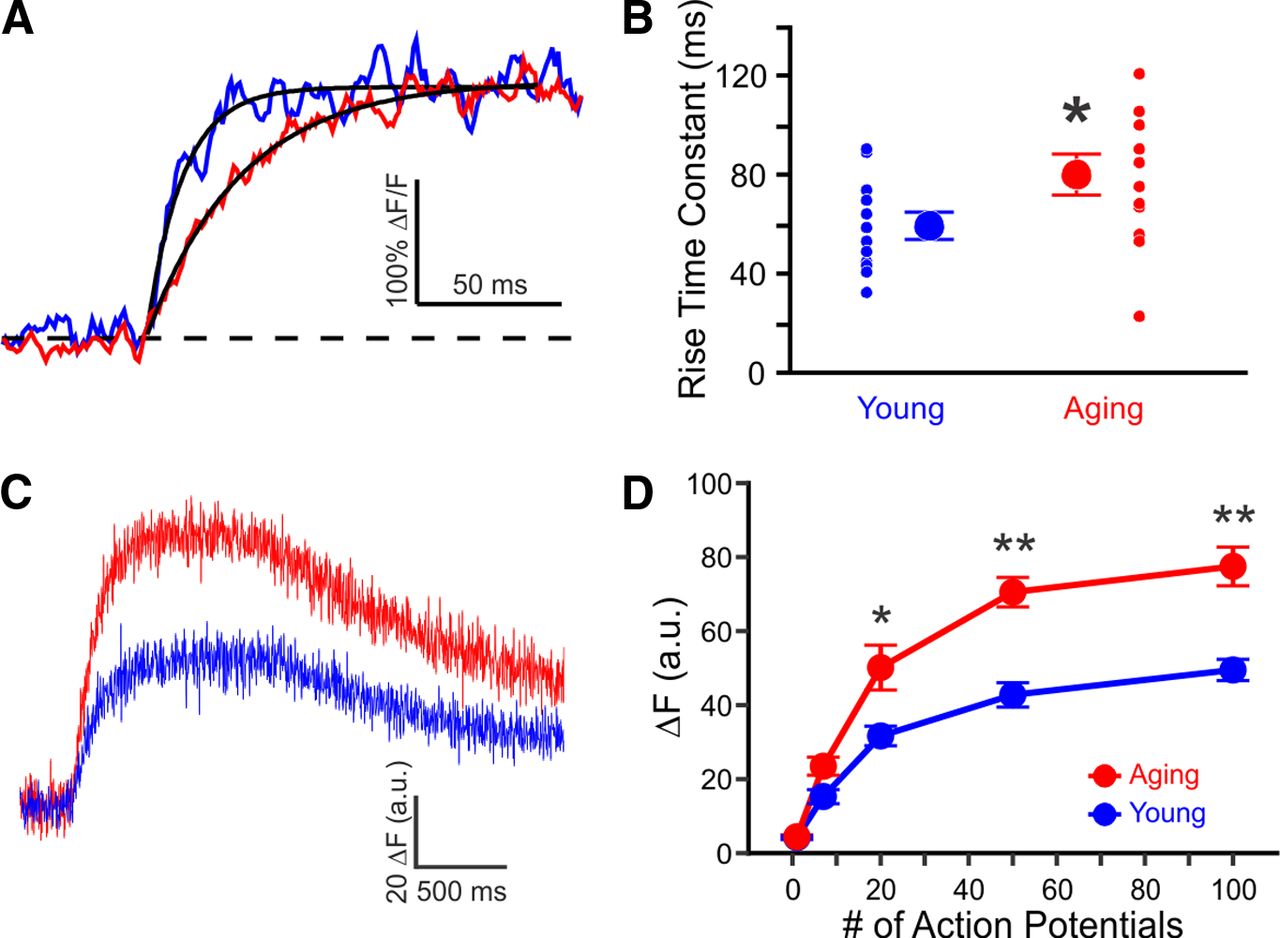
Rise time and amplitude of calcium influx are increased in aging CA1 neurons. A, Example measurements evoked with 50 Hz train of action potentials from young (blue) and aging (red) neurons loaded with 100 μm OGB-1. For illustrative purposes, only the initial rise to plateau phase is shown. B, Rise time constants in CA1 neurons from young (60 ± 5 ms, n = 12 from 9 rats) and aging (80 ± 8 ms, n = 12 from 10 rats) rats measured with 100 μm OGB-1 during a train of action potentials at 50 Hz. C, Example measurements from young (blue) and aging (red) neurons loaded with 500 μm OGB-1, during 100 action potentials at 100 Hz. D, Steady-state rise in fluorescence (ΔF) during 1 s trains of action potentials, measured with 500 μm OGB-1. Young, n = 4 from 3 rats. Aging, n = 5 from 4 rats. *p < 0.05, **p < 0.005, unpaired t test.
Calcium influx is increased in aging CA1 neurons
In the absence of other changes in calcium handling, elevated calcium buffering is expected to reduce the peak amplitude of the dendritic calcium transient in aging rats (Helmchen and Tank, 2005). Why then, is the mean peak amplitude of the action potential-evoked calcium transient not smaller in aging than in young adult rats? One possibility is that calcium influx is enhanced in aging rats. Previous studies have reported that during a train of action potentials there is a greater rise in cytosolic calcium concentration in CA1 neurons from aging animals, due to enhanced calcium influx via l-type channels (Moyer and Disterhoft, 1994; Thibault and Landfield, 1996) and possibly increased calcium-induced calcium release (Kumar and Foster, 2005; Gant et al., 2006). We therefore compared calcium influx into CA1 neurons in young and aging rats. We added a large amount of indicator to overwhelm endogenous buffers, thereby ensuring that the indicator captured almost all the incoming calcium. Under these conditions the change in fluorescence (ΔF) is proportional to the calcium flux across the membrane (Neher, 1995). CA1 neurons were loaded with 500 μm OGB-1, which has at least tenfold greater buffer capacity than the endogenous buffers. Calcium influx evoked with trains of 20–100 action potentials at 20–100 Hz was ≥ 50% greater in CA1 neurons from aging than from young rats (Fig. 3C,D) (p < 0.05, unpaired t test).
Hence our results indicate that endogenous buffer capacity and calcium influx are both increased in aging CA1 pyramidal neurons. These two changes will have opposing effects on the amplitudes of calcium transients and our results indicate that these two changes balance each other, such that the amplitudes of calcium transients evoked by single action potentials are similar in young and aging neurons.
Increased calcium buffer capacity is overwhelmed with repeated activity in aging CA1 neurons
In behaving animals CA1 pyramidal neurons often spike in repetitive bursts at theta frequencies (O'Keefe, 2007). During bursts, intracellular calcium may accumulate and overwhelm endogenous calcium buffers, resulting in a higher free cytosolic calcium concentration in aging than in young CA1 pyramidal neurons. Thus, we monitored calcium concentration during sustained spiking at 100 Hz and during theta-like activity. For these experiments we filled neurons with 150 μm Oregon green BAPTA-6 (OGB-6F), which has a low enough affinity that it has little effect on calcium buffer capacity. During 100 Hz trains, the calcium concentrations in young and aging neurons were similar during the first three action potentials, but thereafter became larger in aging than in young neurons (Fig. 4A). Similarly, during theta burst activity peak calcium concentrations were greater in CA1 neurons from aging rats (Fig. 4B). Hence, if increased calcium buffering is a cellular mechanism to combat increased calcium influx in aging CA1 neurons, this protection is only effective during the first few action potentials of a train: thereafter the intracellular calcium concentration is higher in the proximal apical dendrites of CA1 pyramidal neurons in aging than in young adult rats.

Calcium concentration during trains of action potentials. A, Mean calcium concentrations (shaded regions represent SEM) during 100 Hz trains in young (blue, n = 6 from 2 rats) and aging (red, n = 6 from 3 rats) neurons loaded with 150 μm OGB-6F. B, Calcium concentration during theta burst activity (5 action potentials at 100 Hz) at theta frequency (5 Hz). Significant differences were revealed with repeated ANOVAs for the 100 Hz and theta burst activity. Further analysis revealed significant differences between the age groups at various points during the train of activity. *p < 0.05.
Discussion
Our results are the first to demonstrate enhanced endogenous calcium buffer capacity in the apical dendrites of CA1 hippocampal pyramidal neurons from aging animals. Buffer capacity in intact CA1 pyramidal neurons had not been directly measured, but was previously thought to decrease with age (Toescu and Verkhratsky, 2007; Kumar et al., 2009).
In this study, we did not identify the calcium buffer that is elevated with aging. More than 200 proteins that bind, and therefore buffer calcium, have been identified (Miller, 1991; Braunewell and Gundelfinger, 1999; Heizmann, 1999; Lewit-Bentley and Rety, 2000; Burgoyne et al., 2004; Schwaller, 2009). Some, such as parvalbumin, calbindin-D28, calretinin, hippocalcin, and visinin-like Ca2+-binding protein 2 (NVP2) are often reduced with normal aging (Villa et al., 1994; de Jong et al., 1996; Krzywkowski et al., 1996; Kishimoto et al., 1998; Furuta et al., 1999), suggesting that the increase in calcium buffering is more likely to result from changes in expression of other proteins, perhaps of a “nonclassical” calcium buffer protein that requires Ca2+ for its activity (e.g., adenyl cyclase I or III (ACI/III) and calcineurin) (Berridge et al., 2000; Schwaller, 2009). Calcineurin is one such nonclassical buffer protein that displays increased activity (Foster et al., 2001; Eto et al., 2008).
Contrary to previous reports (Hajieva et al., 2009), we found that the resting [Ca2+] is reduced in aging CA1 neurons. Enhanced buffer capacity in aging neurons is unlikely to account for the reduction in resting calcium: endogenous calcium buffer capacity impacts the dynamics of calcium signals, but has little effect on steady-state parameters, such as the resting calcium concentration (Neher and Augustine, 1992; Neher, 1995). Furthermore, the resting [Ca2+] was not correlated with buffer capacity (data not shown). Hence, our results suggest that alteration in other cellular mechanisms, such as intracellular stores or plasma membrane calcium pumps, is responsible for the significantly reduced resting [Ca2+] in CA1 neurons with normal aging.
Our experiments did not directly test the roles of intracellular stores in shaping action potential-evoked calcium transients. In the apical dendrites of cortical pyramidal neurons from young rats, uptake of calcium into the endoplasmic reticulum does not play a significant role in determining the amplitudes of single action potential-evoked calcium transients (Markram et al., 1995), but helps to clear calcium from the cytoplasm during the decay of action potential-evoked calcium signals (Markram et al., 1995). Hence, intracellular stores are likely to influence calcium accumulation during repeated spiking, probably in both young and aging animals. Because calcium accumulation by and release from intracellular organelles may change with aging (Kumar and Foster, 2005; Mattson, 2007), aging-related changes in intracellular stores may have contributed to the age dependence of calcium accumulation that we observed during 100 Hz and theta burst spiking. Presumably if there are aging-related changes to intracellular stores or to calcium extrusion pathways, these changes would combine with the changes in calcium handling mechanisms that we have documented to determine the rate of saturation of calcium buffers in aging animals. For example, increased calcium release via ryanodine receptors (Gant et al., 2006) and enhanced buffering might counteract each other, with the balance of these two factors determining how quickly buffers saturate during action potential firing.
The postburst after hyperpolarization (AHP) is a Ca2+-dependent potassium current and has been suggested to be a biomarker of intrinsic neuronal excitability because it appears to be an important regulator of learning in the hippocampus (Disterhoft and Oh, 2006). The postburst AHP is significantly enlarged in CA1 neurons from aging, relative to young animals and this increase is linked to age-related learning impairments (Disterhoft and Oh, 2006). The enhancement in the postburst AHP with aging neatly parallels the changes in calcium accumulation reported here: the postburst AHP evoked with a few action potentials is of similar amplitude in young and aging neurons (Landfield and Pitler, 1984), whereas the postburst AHP following sustained spiking is larger in aging than in young neurons (Landfield and Pitler, 1984; Disterhoft and Oh, 2007; Matthews et al., 2009). Similar increases in calcium accumulation evoked with a sustained 7 Hz (Thibault et al., 2001; Gant et al., 2006) or brief 100 Hz (Hemond and Jaffe, 2005) train of action potentials have been previously reported in CA1 pyramidal neurons from aged rats. It appears likely, therefore, that the enhanced accumulation of calcium in aging neurons is the primary cause of the enlarged AHP during prolonged spiking. Enhanced l-type voltage-gated calcium current and calcium-induced calcium release following a burst of action potentials have previously been identified as causes of the aging-related increase in postburst AHP (Landfield and Pitler, 1984; Moyer and Disterhoft, 1994; Power et al., 2002; Kumar and Foster, 2004, 2005; Gant et al., 2006), and our results indicate that increasing calcium buffering blunts the enhanced calcium accumulation in aging rats, but fails to prevent the aging-related increase in calcium influx following a burst of action potentials. Hence, the increase in calcium buffering that we have documented probably improves, but undoubtedly fails, to entirely recover hippocampus-dependent cognitive function in aging.
Footnotes
- Received November 21, 2012.
- Revision received March 19, 2013.
- Accepted March 27, 2013.
This work was supported by NIH Grants AG08796 and AG017139 (J.F.D.) and AG20506 (J.W.). 2P-LSM experiments were performed in the MP-Core2 facility (NINDS P30NS054850). We thank Dr. David Wokosin for technical assistance, Dr. Miguel Maravall for advice on analysis, and Drs. Gordon Shepherd, Murali Prakriya, and Robert Vassar for discussions.
The authors declare no competing financial interests.
- Correspondence should be addressed to either Dr. John F. Disterhoft or Dr. Jack Waters, Department of Physiology, Feinberg School of Medicine, Northwestern University, 303 E Chicago Avenue, Chicago, IL 60611, jackwaters{at}northwestern.edu or jdisterhoft{at}northwestern.edu
- Copyright © 2013 the authors 0270-6474/13/337905-07$15.00/0