
Abstract
The remarkable capabilities displayed by humans in making sense of an overwhelming amount of sensory information cannot be explained easily if perception is viewed as a passive process. Current theoretical and computational models assume that to achieve meaningful and coherent perception, the human brain must anticipate upcoming stimulation. But how are upcoming stimuli predicted in the brain? We unmasked the neural representation of a prediction by omitting the predicted sensory input. Electrophysiological brain signals showed that when a clear prediction can be formulated, the brain activates a template of its response to the predicted stimulus before it arrives to our senses.
Introduction
The world we perceive is an active interpretation of the information that arrives at our senses. It is an interpretation because it is a useful model rather than an exact reproduction of reality. This becomes evident in illusions, such as Necker's cube (Necker, 1832), in which the same sensorial input can be interpreted in two different ways. Thus, perceiving is fitting the sensory signals into a plausible explanation. This is achieved by maintaining an internal model of the environment. Sensory signals acquire meaning when they are interpreted in the context of the model, which also provides perceptual stability in the face of brief interruptions inherent to sensory inputs (Winkler et al., 2012). The specific neurophysiological underpinnings behind this process are unclear. An influential proposal (Mumford, 1992; Friston, 2005) states that perceiving is the process of inferring the most probable causes explaining sensory signals. Fundamental to this hypothesis is the idea that the brain uses a forward model to produce a template: that is, to reproduce the specific pattern of activation of sensory units that the inferred cause would elicit (Arnal and Giraud, 2012; Wacongne et al., 2012). If the activation pattern evoked by the stimulation matches the template, then we can recognize (i.e., perceive) what caused it. In this context, prediction is the generation of such sensory activation templates. This is a key idea shared with proposals stemming from other lines of research (Wolpert and Ghahramani, 2000; Poulet and Hedwig, 2007). Our goal was to gain access to the neural expression of prediction.
Sensory predictability can arise in several ways. Sensory signals are often inherently predictable because they contain patterns (e.g., the spatial origin of an ongoing sound will likely move along a continuum, following the source that is producing it). This means that once the set of causes generating the signals has been inferred, predictions can be made in advance of the stimulation (Bendixen et al., 2012). Moreover, we ourselves are often the source of sensory signals, causing changes in stimulation with our motor acts. For example, moving the eyes causes the visual image to shift on the retina; however, we do not perceive the world moving. This exemplifies how perception makes use of automatically generated predictions afforded by our motor acts (Poulet and Hedwig, 2007; Schütz-Bosbach and Prinz, 2007). We exploited this fact to unmask prediction by occasionally omitting the expected sensory consequence of a motor act. In the predictive coding framework (Friston, 2005), prediction is induced via top-down signals (i.e., sent from a higher to a lower brain area in the cortical processing hierarchy), and bottom-up neural signals reflect the prediction error: that is, the amount of mismatch between template and input. Thus, removing the bottom-up stimulation should provide access to the underlying top-down prediction (Wacongne et al., 2012; Fig. 1). The resulting signal should be most similar to the exogenous response to the same stimulus when the motor-induced prediction is not available (Arnal and Giraud, 2012).

Schematic of hypothesis according to predictive coding models (depicted in analogy to Arnal and Giraud, 2012). The diagrams represent the transmission of information between a higher and a lower sensory processing area under different situations. On the left, when no clear time-locked prediction is available, the exogenous response elicited by the sensory input to the lower level is bottom-up transmitted to the higher level. In the middle, when a time-locked prediction is available, the predicted activation is induced in the lower level via top-down signals. This activation is matched by the input and prediction error is minimized. On the right, the prediction is available but the predicted input is then omitted. In this case, the predicted response is bottom-up transmitted as prediction error.
Materials and Methods
Participants.
This experiment was conducted in accordance to the Declaration of Helsinki. All participants gave written informed consent for their participation after the nature of the study was explained to them. Nineteen volunteers (11 women, 8 men; age range, 21–30 years; mean, 24.5 years) participated in the experiment. Participants were all right-handed, healthy Leipzig University students or researchers. Students either received course credits or were reimbursed for their participation. All participants had normal or corrected-to-normal vision, and reported no hearing impairment or history of psychiatric or neurological disease.
Stimuli and procedure.
The experimental task was delivered with Cogent 2000 v1.29 running on Matlab R2008b. Participants sat comfortably inside an electrically shielded chamber and fixated on a fixation cross displayed on a screen placed at a distance of ∼100 cm from their eyes. They were asked to press a button on a cushioned Microsoft SideWinder Plug & Play Game Pad every 600–1200 ms with their thumb. In the self-initiated sound conditions, a 1000 Hz low-pass filtered click sound (fourth-order Butterworth filter) was delivered binaurally through headphones (70 Ω; HD 25-1, Sennheiser) without delay after the button press with a probability of either 88 or 50% in separate blocks. Sound omissions were randomly placed with the restriction that in the 88% sound condition the first five trials of each run of trials and the two trials immediately following an omission were always sound trials. Two control conditions were included: a passive-listen condition, in which participants passively listened to the sound sequences generated by them in the self-initiated sound conditions, and a no-sound motor control, in which participants pressed the button but no sound was delivered. All button-press conditions were evenly split into left-hand and right-hand blocks.
The different condition blocks were organized as follows. Participants performed two training blocks of 2 min each to tune to the requested timing between button presses before the start of the experiment. A training in which no sounds were delivered was followed by a training in which sounds were delivered without omissions. The no-sound motor control was split into two blocks of ∼2.5 min each, one performed immediately before and one immediately after the remainder of conditions. After initial training and the first no-sound motor control block, participants performed a block of self-initiated sound trials for each hand and subsequently listened to the same sound sequence passively. This procedure was repeated twice in each sound probability condition. The 88% sound condition blocks were performed first, followed by the 50% sound condition blocks. In total, 1120 sound trials and 160 omission trials were performed and replayed for the 88% sound condition and 160 sound trials and 160 omission trials for the 50% sound condition. A total of 320 trials were performed as motor control. The order of left-hand/right-hand blocks was counterbalanced across subjects. An additional 3 min passive omission oddball condition was also presented alternatively before or after all other conditions. Data from this condition will not be discussed here. Total experimental time was ∼1 h 30 min.
Participants wore soft foam earplugs during the whole experiment to silence any possible noise generated by the button presses. Before the start of the experiment, and with the earplugs inserted, we measured the auditory threshold as 75% just-noticeable-difference thresholds with a weighted-up-down two-alternative forced-choice procedure, at least twice for each ear separately. Sounds were delivered at 45 dB above the threshold calculated as the mean of all measurements on both ears.
Electroencephalogram acquisition.
The electroencephalogram (EEG) was continuously acquired at a sampling rate of 500 Hz from 64 Ag/AgCl active electrodes commonly referenced to FCz, the signal amplified by BrainVision Professional BrainAmp DC amplifiers and recorded with Vision Recorder v1.10 (Brain Products). Electrodes were mounted in an elastic cap (actiCAP, Brain Products) according to the 10% extension of the international 10–20 system (Chatrian et al., 1985). To record eye movements, we placed four additional electrodes: one on the tip of the nose, one on the nasion, one below the left eye, and one below the right eye (Schlögl et al., 2007). The ground electrode was placed on AFz.
EEG preprocessing.
EEG analysis was performed with EEGlab (Delorme and Makeig, 2004) and Eeprobe (ANT). Offline, the EEG was rereferenced to the nose electrode, bandpass filtered from 0.5 to 100 Hz [windowed sinc finite impulse response (FIR) filter, Kaiser window, Kaiser β 5.653, filter order 1812], corrected for eye movements (Schlögl et al., 2007), and low-pass filtered (25 Hz low-pass, windowed sinc FIR filter, Kaiser window, Kaiser β 5.653, filter order 9056). Remaining artifacts were rejected by applying a 75 μV maximal signal-change per epoch threshold. A −200 to +500 ms epoch was defined around each event (button press, sound or sound omission). To avoid introducing motor preparation signals present in the baseline period into the poststimulus waveforms, no baseline correction was applied (Urbach and Kutas, 2006). Epochs were averaged for each condition separately. Analyses did not include any trial outside the 600–1200 ms button-press timing limit, the first five trials of each run of trials, or the two sound trials immediately following a sound omission in the 88% sound condition. Data from four participants were excluded due to excessive artifacts in the EEG recording (>30% of epochs meeting the rejection criteria). For the remaining participants, 8.7% of the trials on average were rejected per condition (range, 0–30%; median, 5.4%).
Event-related potential analysis.
First, the presence of prediction-related activity was verified comparing omissions of self-initiated sounds to equivalent silent button presses in the no-sound motor control condition, where no prediction should be present. To highlight prediction effects, all plots depicting omission responses show the difference between the omission-related potential and the response in the no-sound motor control. Statistical analysis was performed on two windows (N1 window, 56–112 ms; N2 window, 116–182 ms) defined to cover two clearly identifiable peaks with different topographies in the omission-related potential. Amplitude measures were averaged across electrodes over three regions of interest: left temporal (FT7, FC5, T7, C5), frontocentral midline (Fz, FCz, Cz), and right temporal leads (FC6, FT8, C6, T8). In each time window, separate condition (self-initiated omitted, no-sound motor control)–hand (left, right)–region (left temporal, central, right temporal) ANOVAs were performed for each of the sound probability conditions (88%, 50%). After the presence of prediction-related activity was tested in each condition, prediction-related responses were directly contrasted between the two probability conditions by means of a condition (12% omission, 50% omission)–hand–region ANOVA.
Topographic analysis.
To characterize the topography of the relevant event-related potential (ERP) components, ERP voltage distributions were transformed into scalp current density (SCD) maps. The surface Laplacian reflecting divergence of current density on the scalp, being proportional to the radial current flow at a given location, was computed as the second spatial derivative of the interpolated voltage distribution (Perrin et al., 1989). For all SCD analyses, the maximum degree of the Legendre polynomials was chosen to be 50, and the order of splines was set to 4. A smoothing parameter of 10−5 was applied.
Source analysis.
To reveal the generators of the relevant responses, brain electrical tomography analyses were applied by means of the variable resolution electromagnetic tomography (VARETA; Bosch-Bayard et al., 2001) approach. With this technique, sources are reconstructed by finding a discrete spline-interpolated solution to the EEG inverse problem: estimating the spatially smoothest intracranial primary current density (PCD) distribution compatible with the observed scalp voltages. Based on the probabilistic brain tissue maps available from the Montreal Neurological Institute, this technique allows for point-to-point variation in the amount of spatial smoothness and restricts the allowable solutions to the gray matter (Evans et al., 1993). This procedure minimizes the possibility of “ghost sources,” which are often present in linear inverse solutions (Trujillo-Barreto et al., 2004). A 3D grid of 3244 points (voxels, 7 mm grid spacing), representing possible sources of the scalp potential, and the recording array of 64 electrodes were registered with the average probabilistic brain atlas developed at the Montreal Neurological Institute. Subsequently, the scalp potential in the latency range of the auditory N1 was transformed into source space (at the predefined 3D grid locations) using VARETA. Statistical parametric maps (SPMs) of the PCD estimates were constructed based on a voxel-by-voxel Hotelling T2 test against zero to localize the sources of the response separately for the conditions of interest. To compare the sources between the two critical conditions (omissions vs sounds), source contrasts were computed based on a voxel-by-voxel Hotelling T2 test between the VARETA source localization of the two conditions. Moreover, source overlap was determined by identifying voxels significantly activated in both conditions. For all SPMs, random field theory (Worsley et al., 1996) was used to correct activation threshold for spatial dependencies between voxels. Results are shown as 3D activation images constructed on the basis of the average brain.
Results
We recorded brain electrical signals from human participants while they pressed a button that either consistently (88%), inconsistently (50%), or never (0%) initiated a sound (Fig. 2). Participants were able to maintain a stable pace between button presses, keeping an average of 857 ± 81 (SD) ms between presses in the no-sound motor control condition, 787 ± 68 ms in the 88% sound condition, and 784 ± 76 ms in the 50% sound condition. To isolate prediction, we compared electrical brain responses time-locked to identical button presses that were not followed by a sound. No prediction for a sound should be present in blocks in which button presses never caused a sound. Thus, these responses were used as a baseline. Any activity elicited in the 50 and 88% conditions above this baseline was considered a neural reflection of prediction.

Extraction of neural activity reflecting sound prediction. The experimental conditions are depicted on the left. In the motor baseline (top row), button presses never produced a sound. In the other two conditions, button presses produced a sound that was unpredictably omitted in either 12% (middle row) or 50% (bottom row) of the trials. The right plot depicts brain responses in button press trials not followed by a sound, after subtraction of the motor baseline. Prediction-related activity was only observed when sound omissions were rare.
No prediction activity was observed in the 50% sound condition (F < 1, not significant). Only when sounds could be predicted with confidence (88%), a clear time-locked response was elicited, consisting of two clearly distinguishable consecutive deflections in the early (condition: F(1,14) = 7.270, p = 0.017, η2 = 0.342) and late (condition: F(1,14) = 32.438, p < 0.001, η2 = 0.699) latency windows (Fig. 2, N1 and N2). The early response showed a bilateral temporal distribution (condition–region: F(2,28) = 18.362, p < 0.001, η2 = 0.567; right temporal: t(14) = −3.687, p = 0.002; left temporal: t(14) = −4.092, p = 0.001; midline: t(14) = −0.288, p = 0.778), while the late response was more broadly distributed. The possibility that this response was due to motor potentials rather than prediction-related processes is minimized by the finding that the scalp distribution of motor potentials depended on the execution hand (hand–region interaction, N1: F(2,28) = 5.325, p = 0.014, η2 = 0.276; N2: F(2,28) = 4.864, p = 0.019, η2 = 0.258), but this effect did not interact with the condition effect (no condition–hand–region interaction, N1: F(2,28) = 2.645, p = 0.096; N2: F(2,28) = 0.267, p = 0.619). The direct contrast between the 12 and 50% omissions corroborated the presence of larger prediction-related activity for rare than for frequent omissions in both the N1 (condition: F(1,14) = 7.680, p = 0.015, η2 = 0.354; condition–region: F(2,28) = 20.827, p < 0.001, η2 = 0.598; left temporal: t(14) = −3.890, p = 0.002; right temporal: t(14) = −4.297, p = 0.001; midline: t(14) = 0.341, p = 0.738) and N2 (condition: F(1,14) = 19.676, p = 0.001, η2 = 0.584) time windows.
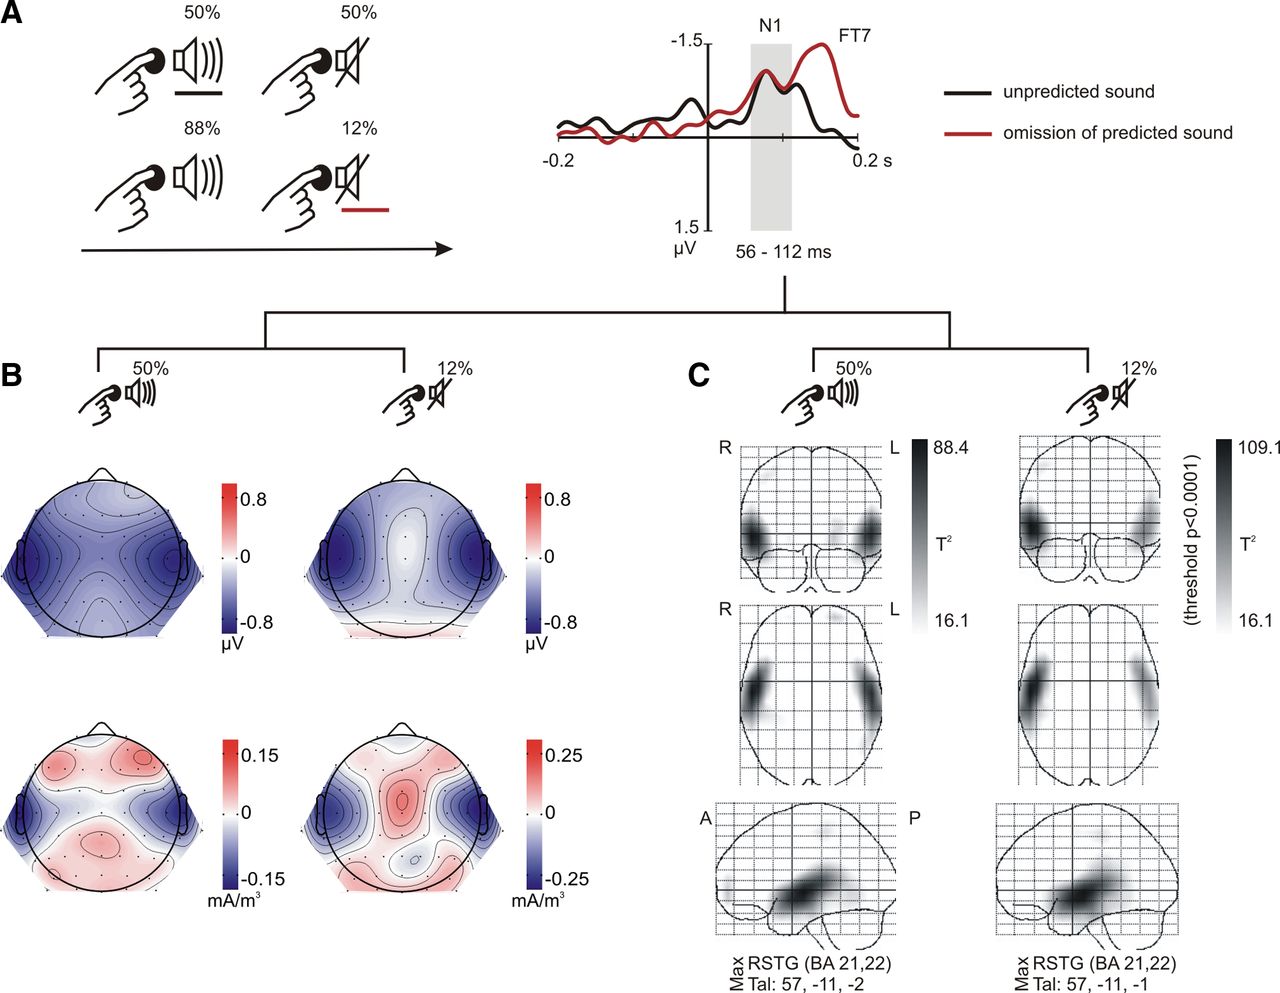
According to the theoretical models, if this activity encodes the prediction, it should resemble the exogenous response to the predicted stimulus (Arnal and Giraud, 2012). Thus, we compared the omission response to the auditory response elicited by the sound (Fig. 3A). Self-initiated sounds in the 50% sound condition were chosen for this comparison because motor potentials should be equivalent in these two conditions, and the absence of omission responses in the 50% sound condition indicates that no predictions were generated. Thus, self-initiated sounds in the 50% sound condition were the best controlled exogenous sound response example. Nevertheless, similar results were obtained if passive sounds or self-initiated sounds in the 88% sound condition were used in this comparison (data not shown). As expected, sounds elicited the auditory N1 wave, an obligatory exogenous sensory response (Näätänen and Picton, 1987). The N1 deflection unmasked when the expected sound was omitted follows the same time course as the exogenous sensory N1 (Fig. 3A), making it a likely candidate to directly reflect the neural expression of the prediction.

Comparison of prediction-related responses and sound responses. A, The experimental conditions compared are depicted on the left. In one condition (bottom row), participants pressed a button to initiate a sound, which was unpredictably omitted on 12% of the button presses. In the other condition (top row), sounds were omitted on 50% of the trials. On the right, brain responses elicited by rare omissions of self-initiated sounds (red trace) are compared with sound responses in the 50% sound condition (black trace). Both traces are corrected via subtraction of the no-sound motor baseline. The brain activity observed for omissions of predicted sounds mimics the time course of the exogenous auditory N1 to sounds that could not be predicted with confidence. B, Scalp potential (top) and scalp current density (bottom) maps indicate responses to sounds (left column) and omissions (right column) have common sources in auditory cortices. C, Statistical parametric maps of the VARETA source estimation yield broadly overlapping sources in superior temporal gyrus (STG) for sounds (left column) and omissions (right column). BA, Brodmann area; Tal, Talairach coordinates; R, right; L, left; A, anterior; P, posterior.
Thus, we compared the scalp distribution of exogenous response and prediction-related activity in the N1 time window (Fig. 3B). The distributions differ, meaning that the prediction N1 does not mimic the exogenous N1 over the entire scalp. However, scalp current density maps indicate that the prediction N1 and the exogenous N1 may share at least one set of brain sources. We corroborated the sensor-space analysis by comparing the responses in source space (Figs. 3C, 4). The prediction-related activity originated in auditory cortex (Fig. 3C), with sources that broadly overlap those of the exogenous response in the temporal cortex of both hemispheres (Fig. 4A). A direct comparison between the sources of the exogenous response and the prediction-related activity yielded significant differences only over a smaller area of right temporal cortex, compared with the overlapping portions. Thus, the contrast revealed that the sources of activity found for both sounds and omissions in the left temporal cortex were in fact indistinguishable (Fig. 4B).

Contrast and overlap of VARETA source estimation for self-initiated sounds in the 50% sound condition and prediction-related responses in the N1 time window. A, Overlapping voxels active at a threshold of p < 0.001 for both unpredictable self-initiated sounds and rare omissions of predictable self-initiated sounds. Both button presses elicit broadly overlapping sources on motor, somatosensory, and auditory cortices. B, Overlapping voxels after motor correction is applied. Both sounds and omissions activate overlapping sources in auditory cortex. C, The statistical contrast between the sound and omission solutions shows that prediction-related activity and auditory responses have indistinguishable sources in left superior temporal gyrus.
Discussion
Predictive coding theory ascribes a fundamental role to forward models in perception, proposing that specific sensory predictions are automatically generated on the basis of the information currently available to the system. We searched for a neural signature of such predictions in the brain. The results indicate that when a prediction can be formulated, it manifests by inducing a pattern of activity that shares brain sources and time course with the exogenous response to the predicted stimulus. This supports the idea that the brain uses sensory templates as a neural substrate for prediction.
The neural signature of prediction unmasked here shows remarkable similarity with responses obtained in other cases in which a generative model is necessary to activate a mental representation. Sensory-like activity in the absence of stimulation is found, for example, during imagination (Halpern and Zatorre, 1999; Janata, 2001; Kosslyn et al., 2001; Kraemer et al., 2005; Otsuka et al., 2008; Leaver et al., 2009), memory recall (Wheeler et al., 2000), memory rehearsal (Miller et al., 1996), and when holding an attentional template (Chawla et al., 1999; Kastner et al., 1999; Voisin et al., 2006). In all of these cases, the mental representation consists of activation in sensory cortices representing the particular object (i.e., a sensory template), usually maintained or induced with the top-down influence of other brain areas. Our results indicate that sensory predictions are represented using a similar general principle.
Here, the template resembled the sensory response but was not an exact reproduction. Granted, prediction must be in some way different from the exogenous response, else it would cause hallucination. Two factors might contribute to these differences. First, the template is most likely a simplified version of the exogenous response, or it might be lacking a purely bottom-up component like, for example, the orienting response elicited by the sound (Näätänen and Picton, 1987). In particular, the prediction-related activity in the present findings seems to reproduce only a part of the T complex (Wolpaw and Penry, 1975). The T complex is one of the components of the auditory N1 waveform and it has been proposed to reflect parallel processing in secondary auditory cortex, distinct from that generating the N1 components with a midline frontal scalp distribution (Tonnquist-Uhlen et al., 2003). Second, when the prediction is not fulfilled and the template is therefore fed forward to the higher level (Fig. 1), then it must be tagged as error. That is, we assume that the neurons encoding the template are also able to judge whether there is actual sensory input. Hence, the signal fed forward would not only consist of the unprocessed template, but it would also include the information that this template is now prediction error. This “error-tagging” of the template would prevent hallucination and it would make it possible to differentiate prediction from other processes that may use similar sensory templates as described above. Hence, it is not possible to disentangle prediction from prediction error in the present findings; however, since there was no sensory input, prediction error should be a mirror image of the prediction and thus the omission response provides access to the neural representation of prediction. Nevertheless, the visible differences between the prediction-related activity and the exogenous sound response may also argue against the idea of predictive activation of sensory templates. This paradigm provides the means for further research to ascertain just how similar prediction-related responses are to exogenous sensory responses.
Prediction has been proposed not only as a basis for perception, but as a general principle of brain function (Friston, 2010). Thus, prediction is assumed to be ubiquitous and to arise from any available source and at all processing levels. Evidence for prediction is indeed widespread, however, whether a common representational principle holds for different domains or functions remains to be established. The notion of predictive activation of sensory templates can readily be applied to findings from the fields of associative learning (McIntosh et al., 1998) and ideomotor theory (Shin et al., 2010), both of which have long advocated the idea of effect anticipation. Recently, it has been shown that when an auditory–visual association is learned, even incidentally, the mere presentation of the auditory stimulus can elicit activation of visual cortex (den Ouden et al., 2009). Moreover, when left or right button presses are consistently associated with the visual presentation of faces or houses, the motor act alone can elicit activation in the corresponding specialized visual processing area (Kühn et al., 2010). These findings provide converging evidence for the notion of ubiquitous predictions, subserved via the activation of sensory templates.
One of the most extensively researched fields providing evidence for prediction is the field of automatic rule extraction in the auditory domain. In these studies, participants are presented with a stream of sounds that follow a particular rule, unknown to the participant. Whenever a sound is presented violating a prediction that can be derived from the rule, a specific electrophysiological marker is elicited: the mismatch negativity (MMN, Näätänen et al., 2007). The MMN is also elicited in the case of unexpected omissions (Yabe et al., 1997). However, the omission MMN does not resemble the exogenous auditory response. N2-family signals, including the MMN, usually reflect higher-order error evaluation processes (Folstein and Van Petten, 2008), rather than a direct reflection of the prediction representation. A similar process was probably reflected here by the later N2 signal elicited by the omissions.
Nevertheless, a few omission studies in the auditory regularity extraction domain provide converging evidence that the activation of sensory templates coding for auditory predictions may be the precursor to MMN generation. When a sequence of sounds is prematurely interrupted, early (∼100 ms) activity has been observed (Raij et al., 1997; Hughes et al., 2001; Bendixen et al., 2009; Todorovic et al., 2011; Wacongne et al., 2011). Moreover, this activity seems to be generated in auditory cortex sources that also responded to sound presentation (Raij et al., 1997; Hughes et al., 2001; Wacongne et al., 2011). A caveat of these studies is that, similarly to well known limitations for obtaining the omission MMN (Yabe et al., 1997), early omission responses are rarely obtained when the time interval between the omission and the previous sound is >100–200 ms (but see Raij et al., 1997; Todorovic et al., 2011). This restriction severely limits the generalizability of the findings and their interpretability in terms of a purely predictive mechanism, as will be further addressed below. Possibly, when longer time delays need to be estimated, prediction becomes less precise in its timing, leading to a time-jittered activation of the sensory template and thus diluting the average response. However, this hypothesis remains to be tested. In fact, while the predictive coding framework extensively describes how the brain may predict what stimulus is next, the mechanisms by which it may predict when the stimulus is to be expected are far less clear (Arnal and Giraud, 2012). In general, researchers have spent far less effort investigating the processes, particularly nonattentive processes, underlying prediction in time (for review, see Nobre et al., 2007).
If prediction is accomplished via the activation of sensory templates, we can assume that to accurately predict the upcoming stimulus, the sensory template should mimic the exogenous response not only in its anatomical pattern but also in its timing. That is, the sensory template should become active in each hierarchical sensory processing level of the cortex at the precise time at which the presentation of the stimulus itself would activate that given level. One of the strengths of our approach is that the button press provided information not only of the nature of the upcoming stimulus but also of its precise time of occurrence. This makes it possible to observe precisely time-locked auditory predictions that are clearly separated in time from previous auditory stimulation and that also do not require a rhythmic auditory stimulation pattern. Thus, predictions are established here in a purely top-down and cross-modal fashion and any auditory activity observed is therefore not likely to reflect leftover activation from previous auditory stimuli, offset responses, or even entrainment patterns.
Remarkably, the sensory template arose at the predicted time point of sound occurrence in the electrophysiological recordings. While the auditory N1 is not the earliest sensory response that exists in the auditory domain, it was the first clearly observable response elicited by both the auditory stimulus and the omission with the current settings. Thus, the results suggest that at least up to the processing level of the auditory N1, prediction induced the adequate sensory template. Corroborating findings have been obtained in an auditory regularity extraction paradigm, in which unexpected omissions of the second tone of a pair elicited an electrophysiological response indistinguishable from the exogenous response to the sounds up until 50 ms after the omission onset (Bendixen et al., 2009).
It is likely that the top-down signals inducing auditory cortex activation when a sound was predicted after a button press originated in motor areas. Electrophysiological recordings in monkeys have shown that manual responses (Brosch et al., 2005) and somatosensory stimuli (Schroeder et al., 2001; Fu et al., 2003) can elicit responses in auditory cortex. Particularly, somatosensory stimuli have been shown to phase-reset ongoing oscillations at the supragranular layers of A1 (Lakatos et al., 2007), hence inducing responses that would be observable at the scalp. Moreover, such cross-modal activations are only elicited under certain task conditions (Lakatos et al., 2009). Given the presence of direct driving connections from somatosensory to auditory cortices (Hackett et al., 2007), the present results could be explained by the formation of cross-modal cell assemblies (Hebb, 1949) through the repeated association of motor and/or somatosensory and auditory units in the 88% sound condition, but not in the 50% sound condition. Such explanation can also be accommodated within the predicting coding framework, considering that the formation of cell assemblies reflects the encoding of causal regularities (Friston, 2010).
In line with our findings, simulations based on the predictive coding theory yield similar “perceptual” activity of a sensory prediction when a predicted sound is omitted (Friston and Kiebel, 2009). However, the bulk of experimental evidence supporting predictive coding comes from studies showing that sensory processing is affected by prediction, as reflected in match and mismatch effects (Bendixen et al., 2012). This evidence for prediction is indirect and can potentially be accounted for with alternative models. For example, one influential proposal (May and Tiitinen, 2010) relies on adaptation of sensory units to explain a great deal of mismatch effects, without recurring to a top-down template. Our findings help to clarify how predictions are expressed in the brain. They clearly support the idea of top-down sensory templates advocated by predictive coding models. Converging evidence from studies on auditory regularity extraction, associative learning, and ideomotor theory indicates that the predictive activation of such sensory templates represents a general principle of brain function. Having access to the neural code of prediction is an important step toward understanding how bottom-up signals interact with sensory predictions, finally leading to efficient perception in a demanding multimodal environment.
Footnotes
- Received December 20, 2012.
- Revision received February 13, 2013.
- Accepted March 6, 2013.
This work was funded by the German Research Foundation (DFG, Reinhart-Koselleck Project SCH 375/20-1). We thank Jana Timm and Nadin Greinert for data collection. This experiment was realized using Cogent Graphics developed by John Romaya at the Laboratory of Neurobiology at the Wellcome Department of Imaging Neuroscience.
The authors declare no competing financial interests.
- Correspondence should be addressed to Iria SanMiguel, Institute for Psychology, University of Leipzig, Seeburgstr. 14-20, 04103 Leipzig, Germany. iria.sanmiguel{at}uni-leipzig.de
- Copyright © 2013 the authors 0270-6474/13/338633-07$15.00/0