
Abstract
The striatopallidal (STP) and striatonigral (STN) neurons constitute the main neuronal populations of the striatum. Despite the increasing knowledge concerning their involvement in multiple tasks associated with the striatum, it is still challenging to understand the precise differential functions of these two neuronal populations and to identify and study new genes involved in these functions. Here, we describe a reliable approach, applied on adult mouse brain, to generate specific STP and STN neuron gene profiles. STP and STN neurons were identified in the same animal using the transgenic Adora2A-Cre × Z/EG mouse model combined with retrograde labeling, respectively. Gene profiling was generated from FACS-purified neurons leading to the identification of new STP and STN neuron-specific genes. Knock-down models based on Cre-dependent lentiviral vector were developed to investigate their function either in striatal or in STP neurons. Thereby, we demonstrate that ecto-5′-nucleotidase (NT5e) is specifically expressed in STP neurons and is at the origin of most of the extracellular adenosine produced in the striatum. Behavioral analysis of striatal and STP neuron knock-down mouse models as well as NT5e knock-out mice demonstrates the implication of this STP neuron enzyme in motor learning.
Introduction
The striatum, the primary input of the basal ganglia, has a critical role in motor control, habit, and reward learning (Albin et al., 1989; Graybiel et al., 1994; Yin and Knowlton, 2006). The intermingled projection neurons, which compose at least 95% of all neurons in the striatum, are the GABAergic medium-sized spiny neurons (MSNs). They are morphologically indistinguishable but can be divided into two populations according to their projections and their neuropeptides and receptor expression profiles. According to current basal ganglia model, these two striatal efferent neuron populations give rise to the direct and the indirect pathways, which provide a balance between promoting and inhibiting movement, respectively (Tepper et al., 2007; Durieux et al., 2009, 2012; Kravitz et al., 2010, 2012). Striatonigral (STN) neurons (direct pathway) project to the medial globus pallidus and substantia nigra pars reticulata (i.e., directly to the basal ganglia output nuclei) and express dopamine D1 receptors and substance P and dynorphin. Striatopallidal (STP) neurons (indirect pathway) project to the lateral globus pallidus, and express enkephalin and dopamine D2 and adenosine A2A receptors (Gerfen et al., 1990; Schiffmann and Vanderhaeghen, 1993).
Imbalance of the two neuronal populations contributes to neurological disorders such as Parkinson's disease, schizophrenia, Huntington's disease, and drug addiction. However, the understanding of the differential function of the STP and STN neurons remains incomplete, despite the effort of recent studies (Day et al., 2006, 2008; Shen et al., 2007, 2008b; Durieux et al., 2009, 2012; Hikida et al., 2010; Lobo et al., 2010; Ferguson et al., 2011; Kravitz et al., 2010, 2012) (for review, see Ena et al., 2011). Genome-wide transcriptional analysis and neurons purification by FACS have recently emerged as powerful tools to investigate the differential gene expression and gene function of defined cell types (Arlotta et al., 2005; Lobo et al., 2006; Cahoy et al., 2008; Heiman et al., 2008; Meurers et al., 2009; Guez-Barber et al., 2011, 2012).
In this study, we developed a specific labeling of STP and STN neurons in adult brain by using transgenic reporter mice and retrograde fluorescent tracing. This simultaneous identification associated with FACS and gene profiling led to the identification of new STP and STN neuron-specific genes. We identified ecto-5′-nucleotidase (NT5e), as an STP neuron-specific gene. NT5e is an ecto-enzyme known to produce extracellular adenosine from 5′-AMP (Zimmermann, 1996; Zimmermann et al., 2012). Adenosine, acting at A1 and A2A receptors, is an important neuromodulator in the CNS (Cunha, 2001a) and more specifically in the striatum, where A2A receptors are highly enriched (Schiffmann et al., 1991; Schiffmann and Vanderhaeghen, 1993) and play fundamental functions (Chen et al., 2003; Schiffmann et al., 2007; Shen et al., 2008a; Yu et al., 2009; Wei et al., 2011). In the striatum, the relative expression of NT5e in glial (Schoen and Graybiel., 1992) versus neuronal cells (Heiman et al., 2008) is still unclear. Our study shows the high enrichment of the NT5e in neurons compared with glia and, moreover, as reported by Heiman et al. (2008), its specific expression in STP neurons. No previous in vivo study has shown the neuronal NT5e function in striatum-related behavior. In this context, in addition to the characterization of the NT5e knock-out (KO) mice, we also developed striatal and STP knock-down models using a lentivirus (LV)-mediated small hairpin RNA, and showed that STP-specific NT5e is involved in striatum-dependent learning.
Materials and Methods
Animals
Adora2a-Cre+/− transgenic mice expressing the Cre recombinase under the control of the STP-specific A2A receptor promoter (Durieux et al., 2009) were bred with the Z/EG reporter mice (Novak et al., 2000). These Z/EG mice (Novak et al., 2000) express a LoxP-β-galactosidase-stop-LoxP-EGFP cassette under the control of the strong and ubiquitous pCAGGS promoter (Niwa et al., 1991; Lobe et al., 1999). After Cre recombination, cells expressing the Cre recombinase were identified based on their EGFP fluorescence and imaged by fluorescence microscopy. C57BL/6 Adora2a-Cre+/− mice were crossed with C57BL/6 iDTR+/+ mice (Durieux et al., 2009), resulting in 50% double-heterozygous Adora2a-Cre+/− iDTR+/− (A2A-DTR+ mice) and 50% Adora2a-Cre−/− iDTR+/− (A2A-DTR− mice), which were used as controls. NT5e knock-out mice (Thompson et al., 2004) were backcrossed onto C57BL/6 background. NT5e−/− and NT5e+/+ littermate controls were obtained by crossing of heterozygous NT5e+/− mice. Drd2-EGFP+/− mice were obtained by crossing Drd2-EGFP+/− with CD1 wild-type (WT) mice. Rosa26-tdTomato floxed mice (Madisen et al., 2010) were obtained from Jackson Laboratory. All procedures were performed according to the Institutional Animal Care Committee guidelines and were approved by the local ethics committees.
Stereotaxic injections
Adult 8- to 16-week-old transgenic Adora2a-Cre+/− × Z/EG mice were deeply anesthetized with avertin (13.5 mg/ml; 20 μl/g, i.p) and placed on a stereotaxic frame (David Kopf Instruments). Injections were performed using a blunt needle connected to a 10 μl Hamilton syringe and a microstereotaxic injection system (KD Scientific). FluoSpheres Carboxylate-Modified Microspheres [0.04 μm; red fluorescent (488/560); A8864; Invitrogen] were injected into the subtantia nigra pars reticulata (SNr) at the following coordinates in reference to the bregma and the dura (adapted from Paxinos and Franklin, 2001): anterior, −3.16 mm; lateral, + or −1.3 mm; ventral, −4.15 mm. Two microliters of the microspheres solution (5% solid) were injected at 0.35 μl/min. The needle was left in place for 5 min after the injection before being slowly removed. The mice were allowed to recover for 2 d and then used for the FACS experiments.
Immunofluorescence
Transgenic Adora2a-Cre+/− × Z/EG mice were transcardiacally perfused with a 0.01 m PBS solution followed by paraformaldehyde 4% in 0.01 m PBS solution. Brains were removed and successively cryoprotected in 20% and 30% sucrose solutions. The 20-μm-thick coronal sections were cut on a cryostat through the striatum. Sections were incubated in 10% normal horse serum in 0.01 m PBS-0.1% Triton-X for 60 min at room temperature to block the nonspecific antibody binding. For single immunofluorescence, sections were then incubated overnight at 4°C with the rabbit anti-GFP antibody (1:1500; A6455; Invitrogen) in 1% normal horse serum, 0.01 m PBS, and 0.1% Triton-X. Antibody was detected using a biotin-conjugated donkey anti-rabbit IgG (1:200) and a Dyelight 488-conjugated streptavidin (1:200; Jackson ImmunoResearch). For double immunofluorescence, the anti-GFP antibody was coincubated overnight at 4°C with sheep anti-NT5e (1:200; AF4488; R&D Systems) (Sowa et al., 2010) or mouse monoclonal anti-NeuN (1:100; MAB377; Millipore). Mouse monoclonal anti-NeuN and sheep anti-NT5e were detected using a biotin-conjugated donkey anti-mouse and anti-sheep IgG, respectively (1:200; Jackson ImmunoResearch) coupled with NL557-conjugated streptavidin (1:3000; NL999; R&D Systems), whereas EGFP was detected using a donkey anti-rabbit directly coupled with Dyelight 488 (1:200; Jackson ImmunoResearch). For the double-immunofluorescence EGFP/enkephalin and EGFP/μ-opioid receptor (MOR), the chicken polyclonal anti-GFP antibody (1:2000; ab13970; Abcam) was associated with the rabbit polyclonal anti pre-pro-enkephalin (1:1500; RA14124; Neuromics) or the rabbit MOR antiserum (1:500; 24126; Immunostar). The antibodies were detected using a goat anti-chicken Alexa Fluor 488 (1:400; A11039; Invitrogen) and a biotin-conjugated donkey anti-rabbit IgG (1:200; Jackson ImmunoResearch) coupled with an Alexa Fluor 647-conjugated streptavidin (1/200; Jackson ImmunoResearch) for the pre-proenkephalin and an Alexa Fluor 647 directly coupled donkey anti-rabbit IgG (1:200; Jackson ImmunoResearch). Hoechst 33342 was used for nuclear staining (1:5000; catalog #H3570; Invitrogen). For NT5e and enkephalin immunofluorescence, antigen retrieval was performed by preincubation of slides in sodium citrate buffer (10 mm; pH 6.5) at 95°C for 3 min and rinsed in PBS (0.01 m) before proceeding as described above. Sections were mounted between slide and coverslip using FluorSave mounting medium (Calbiochem).
Microscopy
Sections were imaged using an LSM 510 META laser scanning confocal system (Zeiss) mounted on an Axiovert 200M inverted microscope (Zeiss), equipped with a c-Achroplan NIR 40×/0.8W objective (Zeiss). The excitation beam of an argon laser (488 nm) and bandpass emission filter (500–550 nm) were used for the detection of the Dyelight 488 fluorophore and an HeNe (543 nm) and bandpass emission filter (565–615 nm) for NL557 fluorophore. Some sections were also imaged using an AxioImager Z1 (Zeiss) equipped with an objective EC Plan NeoFluar 5×/0.15 numerical aperture (NA), a 20× Plan Apochromat 20×/0.8 NA, and an α Plan Fluar 100×/1.45 NA oil. Excitation was provided by an HBO 105W lamp, and narrow bandpass filter sets (Zeiss) 49, 38, 43, and 50 were used to visualize blue, green, red, and far-red fluorochromes, respectively. Single plan images (1388 by 1040 pixels) were acquired with an AxioCam MRm (Zeiss) as 3 × 12 bit RGB proprietary *.zvi files (Zeiss), processed with AxioVision (4.6) software (Zeiss) and exported as uncompressed .jpg files. Figures were prepared using Fiji software and Adobe Illustrator.
Striatal cell dissociation and fluorescent activated cell sorting
Stereotaxically injected transgenic Adora2a-Cre × Z/EG mice (between 8 and 16 weeks of age) were deeply anesthetized with halothane, brains were removed and sectioned in the coronal plane at 250 μm on a Vibratome (Leica) in a chilled physiological solution containing the following (in mm): sucrose 180, KCl 2.5, NaCO3 26, Na2HPO4 1.2, glucose 25, CaCl2 0.1, MgCl2 1, and MgSO4 19, bubbled with 5% CO2 and 95% oxygen. The striatum was dissected out, first dissociated enzymatically (Protease type XIII 1.5 mg/ml; Sigma-Aldrich) and then triturated to obtain dissociated cells. To remove the excess debris, the cell suspension was subjected to a discontinuous gradient (OptiPrep) at 1900 rpm for 15 min, then resuspended in a buffered medium [L-15 Leibovitz medium–CO2 without phenol red; 10 mm HEPES] and filtered through a 40 μm cell strainer (catalog #352340; Falcon, BD Biosciences). Cells were treated with propidium iodide (PI; 5 ng/ml) to label dead cells and sorted on a Becton Dickson FACS Aria cell sorter for fluorescein isothiocyanate (FITC) signal (detecting GFP), phycoerythrin signal (detecting retrolabeled neurons) and Fl3 (detecting PI). Control samples were used to determine the optimal criteria for the sorting before each FACS session. First, WT nonfluorescent neurons were used to set the forward and side scatter. Then, single-labeled control samples (PI+, EGFP+, or retrolabeled neurons+) were used to realize the compensation in fluorescence overlap in the different channels and to set the sorting gate. The test samples were finally analyzed, and neurons were sorted. Sorted cells were directly collected in Qiagen RLT lysis buffer to proceed with the RNA extraction as described by the manufacturer. Each sample was the collection of cells pooled from five animals. All steps of this protocol were performed at 4°C except for the enzymatic dissociation, which was realized at 32°C.
RNA extraction and microarray analysis
Total RNA was extracted from sorted cells using RNeasy Microkit (Qiagen) as recommended by the manufacturer. All RNA samples were treated with an RNase Free DNase Set (Qiagen). RNA quality and quantities were assessed by gel electrophoresis on a RNA assay chips (Experion system and HighSens analysis kit; Bio-Rad). Total RNA was amplified, biotinylated, and hybridized according to the manufacturer's instructions to the Affymetrix Gene Chip Mouse Genome 430 2.0 Array. Processed chips were then read by an argon–ion laser confocal scanner (Genomics Core Facility, Memorial Sloan-Kettering Cancer Center). The entire procedure was repeated in duplicate for each sample to produce independent datasets per mRNA sample. Raw microarray images files were processed using Gene Chip Software (GCOS; Affymetrix) and Microarray suite (Mas5.0). Intensity data were normalized per chip to a fixed target intensity value (500), and expression data and absent/present call for individual probe sets were determined. Gene expression changes that were scored as increased but called absent in the numerator were eliminated. Similarly, any changes that were scored as decreased and called absent in the denominator were eliminated. Results were then filtered to eliminate any change with a fold change of <2 (with a p detection value of <0.01). Gene changes were confirmed by analyses of duplicate arrays. Then, to be classified as differentially expressed, the genes were required to pass two criteria: a fold change of ≥2 (with a p detection value of <0.01) and the presence of this change in the two biological replicates. We first validated our data by performing an “in silico validation” (Chuaqui et al., 2002). The comparative analysis of our dataset with the literature and recent microarray studies showed that genes previously reported as differentially expressed were also detected in our data. Characterized STP neuron genes (Adora2a, Drd2, and Penk1) and STN neuron genes (Drd1a and pDyn) (Gerfen et al., 1990; Schiffmann and Vanderhaeghen, 1993) (Table 1) were also identified in our profiles. Recently described STP neuron genes (GRP6, Upb1, Plxdc1, and Adk) and STN neuron genes (Slc35d3, Ebf1, Nrxn1, and Gnb4) (Lobo et al., 2006, 2007; Heiman et al., 2008) were also validated (Table 1). STP- and STN-enriched genes identified in this study were validated using quantitative PCR (qPCR) on four independent biological replicates.
In silico validation of microarray results
Reverse transcription and quantitative real-time PCR
Purified total RNA was used to synthesize a first strand cDNA in a 50 μl final volume, using an MMLV-RT kit (Invitrogen) and random hexamer (Roche). qPCR analysis was performed with 200 pg of cDNA as a template with Power SYBR green (Applied Biosystems) on the ABI 7500 Fast Real Time PCR system (Applied Biosystems). Primers used for qPCR analysis are listed in Table 2. All primers were designed using Primer Express (Applied Biosystems) on different exons to avoid genomic DNA amplification. The gene amplification efficiency was measured and only primers with an amplification efficiency of >90% were used. The quantity of Ttc12- and Trim25-specific transcripts was measured using the QuantiTect Primer Assay (Qiagen) Mm_Ttc12_1_SG and Mm_Trim25_1_SG, respectively. Ct values for each gene were normalized to Ct value for RER-1 and RPL13 to obtain relative expression level using qBASE 1.3.4 (Hellemans et al., 2007). The sample with the lowest gene expression was used as reference and set at an arbitrary value of 1.
qRT-PCR primers
shRNA design and lentiviral vectors
Three sequences of shRNA were designed to target the NT5e mRNA according to the published criteria (Reynolds et al., 2004) and using pSico Oligomaker 1.5 (Ventura et al., 2004). Nonspecific silencing was prevented by performing a BLAST analysis against the mouse genome with the three shRNA sequences (sh1028, sh1367, and sh1537) (see Fig. 5). The sequences were named by the position of the first base in the NT5e cDNA from the ATG. The control scramble sequence (shscr) has been previously described (Flygare et al., 2005). A BLAST analysis of the scramble sequence showed no target in the mouse genome.
Sense and antisense oligonucleotides containing the shRNA sequence were annealed and then cloned into HpaI and XhoI restriction sites into the pSico or pSicoR lentiviral vectors (Ventura et al., 2004). pSicoR conditional vector allowed the expression of EGFP and the shRNA without Cre recombination, whereas the shRNA is only expressed after Cre recombination with the pSico vector. Hairpin sequences were tested in vitro and in vivo to choose the most efficient shRNA sequence that achieves NT5e gene silencing.
Lentivirus production
Viruses were produced into HEK 293T cells (2.5 × 10⁶ cells in a 10 cm dish) by transient cotransfection of our transfer vector pSicoR or pSico, packaging plasmid (psPAX2) and envelope plasmid (pMD2G), using the calcium phosphate precipitation method. Cells were cultured 2 d in complete medium (DMEM complemented with 10% fetal bovine serum and Glutamax; Invitrogen) before supernatant was collected by centrifugation at 3000 rpm for 5 min at room temperature and filtered through 0.45 μm low protein binding filter (PN:4614, Pall Life Sciences). Viruses were centrifuged at 26,000 rpm for 2 h at 4°C (Beckman conical tube SW28) and then resuspended in 200 μl of PBS. Virus stocks were conserved at −80°C. Viruses were titered by infecting HEK293 T cells with a serial dilution of each lentiviral stock. The percentage of transduced cells, identified by EGFP fluorescence, was measured by flow cytometry 72 h postinfection and used to determine the number of transducing unit (TU) per unit volume. All lentivirus batches used in the experiments had comparable titers ranging from 0.5 × 10⁹ to 5 × 10⁹ TU/ml.
Striatal primary cell culture and in vitro lentiviral infection
Striata from P0-P1 mice were used to produce primary striatal cultures. Striata were dissected in L-15 (Invitrogen) 1 m glucose medium and then mechanically triturated in Neurobasal A supplemented with B27 and l-glutamine (0.5 mm; Invitrogen). A total of 100,000 cells are plated on coated poly-d-ornithine (15 μl/ml; Sigma-Aldrich) and laminin (3 μg/ml; Sigma-Aldrich). After 1 d in vitro (1DIV), the cultures were infected with the lentivirus at the multiplicity of infection of 10. At 2DIV, half of the medium was removed and replaced with freshly prepared medium (Zala et al., 2005). The EGFP fluorescence was observed 2 d after the lentivirus infection and the RNA was extracted, as described above, 10 d after the infection.
Intrastriatal lentivirus injection
Immediately before stereotaxic injection, lentiviruses were diluted in d-PBS (Invitrogen) to achieve the concentration of 0.5 × 10⁹ TU/ml. The viruses were kept on ice throughout the experiment. Five microliters of the virus were bilaterally injected (0.25 μl/min) in 8-week-old mice into the striatum at the following coordinates (adapted from Paxinos and Franklin, 2001; with bregma and the skull as reference): anterior, +0.86 mm; lateral, +1.9 mm; ventral: −3.5 mm. Mice were allowed to recover for 1 month and then used for behavioral experiments and NT5e expression analysis.
Ecto-5′-nucleotidase histochemistry
In this histochemical procedure, lead phosphate precipitates at the sites of tissue-bound enzymatic activity. Cryostat-cut sections of unfixed brains were dried for 1 h and then incubated for 1–2 h in a medium containing Tris-maleate buffer, pH 7.0 (50 mm), 5′-AMP, (1 mm), lead nitrate (2 mm), manganous nitrate (5 mm), and sucrose (0.25 m) at room temperature. Following thorough rinses in a 0.2 m Tris-maleate-sucrose buffer, pH 6.8, sections were washed for 1–2 min in the rinsing buffer adjusted to pH 6.5 with 6% aqueous sodium sulfide. Lead phosphate salt then became visible as a dark brown precipitate. Sections were rinsed again, briefly immersed in toluene, and mounted in DPX. Histochemical controls were performed by omitting the substrate 5′-AMP from the incubation medium. These control sections were devoid of any reaction product (nonspecific activity) (Schoen and Graybiel, 1992). In the striatal and STP knockdown, the quantification of histochemistry was performed by measuring the average optical density (OD) in the lentivirus injected striatal areas (Fiji software). Background as well as nonspecific activity levels were subtracted to obtain the corrected values. Three sections for each animal were used to calculate the average OD. Data were normalized to the pSicoR or pSico-scramble control group.
Striatal slice preparation
Coronal striatal slices (300 μm) were prepared from 8- to 12-week-old NT5e+/+ or NT5e−/− mice. Mice were killed by decapitation under halothane anesthesia, and brains were removed and cut in an ice-cold high-Mg2+, low-Ca2+ choline-based solution composed of the following (in mm): 110 choline chloride, 2.5 KCl, 1.25 NaH2PO4, 7 MgCl2, 0.5 CaCl2, 25 NaHCO3, and 7 glucose (bubbled with 95% O2 and 5% CO2). Slices were stored in standard ACSF containing the following (in mm): 127 NaCl, 2.5 KCl, 1.25 NaH2PO4, 2 MgCl2, 4 CaCl2, 25 NaHCO3, 10 glucose (bubbled with 95% O2 and 5% CO2), at 34°C for at least 1 h before recording.
Adenosine biosensor recording
Two types of biosensors (Sarissa Biomedical) were used for the recording: a null sensor to control the potential interferents and an adenosine-responsive sensor (Llaudet et al., 2003). A specific adenosine signal was obtained by subtracting the current recorded from the null sensor from the current recorded from the adenosine sensor. The sensors were calibrated with 10 μm adenosine before and after each set of experiments, to monitor the stability of the adenosine sensitivity during the experiment. Individual slices were transferred to a recording chamber mounted on an upright microscope (Axio Examiner A1; Zeiss) and superfused at 4 ml/min with ACSF, at room temperature. Biosensors were carefully inserted into the dorsal part of the striatum. For metabolism of ATP experiments, 10 μm ATP was perfused for 10 min with the superfusion system. Biosensors were polarized to +500 mV versus Ag/AgCl, and currents were recorded using a double EPC10 amplifier (HEKA Electronik), low-pass filtered at 1 Hz, digitized at 50 Hz, and acquired with the Patchmaster software (HEKA Electronik).
Behavioral experiments
NT5e knock-down mice were tested 1 month after the stereotaxic injection. Behavioral tests were performed in a video tracking room (Ethovision XT; Noldus Information Technology). Behavioral experiments were conducted on 12- to 16-week-old male mice.
Open field.
Locomotor activity was measured for a 1 h period in an open field locomotor activity boxes (40 × 40 cm) in stressful condition (100 lux illumination). A central zone (20 × 20 cm) was defined in the open field boxes. The total distance traveled was measured.
Rotarod.
The rotarod apparatus (accelerating model, Ugo Basile) consisted of a plastic roller (3 cm diameter) with small grooves running along its turning axis. On the first day, mice were placed on the rotarod at a constant speed (4 rpm) for a maximum of 1 min (training session). Afterward, mice received four trials per day during 5 consecutive days. During trials, animals were placed on the rotating rod at a constant speed (4 rpm), and, then, the rod was accelerated continuously from 4 to 40 rpm over a time period of 300 s. The latency to fall off the rotarod was measured. Animals that did not fall during the entire experiment were scored as 300 s (Buitrago et al., 2004; Bearzatto et al., 2005).
Haloperidol-induced catalepsy.
For a period of 3 d before injection, mice were handled and injected with saline solution (0.9% NaCl) daily. Mice were then injected with haloperidol (1 mg/kg, i.p). Cataleptic activity was assessed 30, 60, 90, and 120 min after injection by lifting the mouse by the tail, and by placing the front paws on a steel bar (15 cm long, 0.5 cm diameter, and 5.5 cm above the surface level) and the hind legs on a plane surface. Mice that did not remain in the forced position were scored as 0 s. The time period that the mice stayed in this position was recorded with a cutoff time of 60 s (Jeon et al., 2010).
Statistical analysis
Values are shown as the mean ± SEM. Statistical analysis of the data was performed using GraphPad Prism software. Statistical analysis of qPCR and OD measurements were performed using a two-tailed Student's t test. Comparisons between groups for the accelerating rotarod and open field were made by repeated-measures two-way ANOVA followed by a Bonferroni post hoc test. A p value of <0.05 was set as the threshold for significant effect.
Results
Identification of striatopallidal and striatonigral neurons
STP and STN neurons represent at least 95% of the cellular population in the striatum. They are indistinguishable and mosaically distributed in the striatum making a specific identification difficult without using techniques as transgenic mouse models or tracing methods. In our study, identification of STP and STN neurons was achieved by using the transgenic Adora2a-Cre × Z/EG mouse (Novak et al., 2000; Durieux et al., 2009) and a retrograde tracing method (Gerfen et al., 1990; Schiffmann and Vanderhaeghen, 1993), respectively, and allowing purification of both neuronal populations in the same animals. The Adora2a-Cre mouse is characterized by the specific and exclusive Cre recombination in STP neurons (Durieux et al., 2009, 2012). No recombination was found in cholinergic interneurons in contrast to similar studies using the Drd2 promoter to target the STP neurons (Lobo et al., 2006; Heiman et al., 2008). Crossing these mice with Z/EG reporter mice (Novak et al., 2000) induced recombination and hence the expression of EGFP in Cre-expressing neurons. Immunostaining against EGFP showed highly specific EGFP expression in the striatum (Fig. 1A) and in the globus pallidus but not in the SNr (data not shown). The STN neurons were identified by injecting red fluorescent microspheres into the SNr. Neurons that project to the SNr showed accumulation of microspheres in their cell body in the entire striatum (Fig. 1B) without clear segregation between the patch (high intensity of MOR staining) and matrix (low intensity of MOR staining) compartments (Fig. 1D,E). In contrast, in Adora2aCre-Z/EG mice EGFP staining presents a patchy pattern with a mild enrichment in the patch compartment (Fig. 1C,D). To investigate the specificity of the EGFP expression, we counted the number of retrolabeled STN neurons in four Adora2a-Cre × Z/EG mice (2271 EGFP-positive cells and 3153 retrolabeled STN neurons). Colocalization of EGFP and fluorescent microspheres was never detected (Fig. 1F). We therefore showed that, in this model, the targeting of STN neurons and STP neurons is mutually exclusive (Fig. 1F).

Characterization of the Adora2a-Cre × Z/EG mouse. A, Single EGFP immunostaining of coronal brain section shows the exclusive labeling of the striatum (Str), whereas no labeling is found in the cortex (Ctx). B, Stereotaxic injection in substantia nigra pars reticulata allows the specific retrograde labeling of the full striatum. C–E, MOR immunostaining on Adora2a-Cre × Z/EG retrolabeled striatum shows the labeling of STP (C) and STN (E) neurons in the matrix (MOR−; D) as well as in the striosome (MOR+; D) compartments. F, EGFP immunostaining on Adora2a-Cre × Z/EG retrolabeled striatum shows no colocalization between the EGFP and the retrograde labeling. Arrowheads mark examples of EGFP neurons. Arrows mark examples of retrolabeled neurons. Images were acquired by confocal microscopy. Scale bars: A, 2 mm; B, 100 μm; C–E, 40 μm; F, 20 μm.
Purification and gene expression profiling of striatopallidal and striatonigral neurons
In this study, we developed a reliable protocol of enzymatic dissociation and separation of the STP and STN neurons from adult mouse striatum (8–16 weeks of age) by FACS, based on the retrograde labeling of STN neurons in mice expressing EGFP under the indirect control of the STP neuron gene Adora2a. In each experiment, striatal slices from four to five retrolabeled Adora2a-Cre × Z/EG mice were enzymatically dissociated and labeled with PI (Fig. 2A) to identify dead neurons. We sorted PI−/GFP+ (EGFP+) neurons to purify STP neurons (Fig. 2B) and PI−/retrolabeled+ (R+) to purify STN neurons (Fig. 2B). Typically, 30,000–60,000 EGFP+ or R+ neurons were purified, and the reanalysis of the sorted neurons by FACS showed that enrichment of the R+ neurons (97% purity) (Fig. 2Ba) and EGFP+ neurons (>98% purity) is specific (Fig. 2Bb). Moreover, comparative analysis of the RNA extracted from EGFP+ and R+ neurons by qRT-PCR analysis demonstrated that the well known MSN markers (Gerfen and Young, 1988; Gerfen et al., 1990; Schiffmann and Vanderhaeghen, 1993) were highly enriched and correctly segregated by the FACS purification procedure: the dopamine D1 receptor (Drd1a) (67.1-fold; STP, 1.004 ± 0.003 n = 5 vs STN, 67.13 ± 16.99 n = 5, Student's t test, t = 3.893; p < 0.01) and substance P (Tac1) (5.5-fold; STP, 1.002 ± 0.002 n = 5 vs STN, 5.524 ± 0.691 n = 5, Student's t test, t = 6.543; p < 0.001) for STN neurons, dopamine D2 receptor (Drd2) (227.7-fold; STP, 227.70 ± 44.61 n = 4 vs STN, 1.003 ± 0.003 n = 4, Student's t test, t = 5.082; p < 0.01), adenosine A2A receptor (Adora2a) (273-fold; STP, 273.0 ± 78.2 n = 4 vs STN, 1.008 ± 0.003 n = 4, Student's t test, t = 3.478; p < 0.05) and enkephalin (Penk1) (51.8-fold; STP, 51.83 ± 21.92 n = 5 vs STN, 1.002 ± 0.002 n = 5, Student's t test, t = 2.319; p < 0.05) for STP neurons (Fig. 2C). The MSN population-specific RNAs were then used to generate the gene expression profiles of STP and STN neurons. For each striatal cell subtype, we compared two independent biological replicates to obtain differential gene expression profiles. According to the criteria defined in experimental procedures, we identified 227 and 469 genes, respectively, enriched in STP neurons and in STN neurons; 10 highly enriched genes in each neuronal population are listed in Table 3. Comparative analysis with the literature confirmed the STP- and STN-specific gene profiles (see Materials and Methods). STP and STN neuron-enriched genes selected according to their high fold change determined by the microarray and their putative functional interest in the basal ganglia physiology were validated using qPCR on four independent biological replicates (Fig. 2D). The differential expression of two STP neuron-specific genes, NT5e (27.51-fold; STP, 27.51 ± 3.15 n = 4 vs STN, 1.008 ± 0.003 n = 4, Student's t test, t = 8.411; p < 0.001) and Gucy1a3 (5.4-fold; STP, 5.428 ± 1.420 n = 4 vs STN, 1.003 ± 0.003 n = 4, Student's t test, t = 3.117; p < 0.05) also reported in the Heiman et al. (2008) study was confirmed. We also validated genes that were not identified in previous reports (Lobo et al., 2006, Heiman et al., 2008), namely two other STP neuron-specific genes, Rgs5 (32.8-fold, STP, 32.82 ± 4.251 n = 4, STN, 1.005 ± 0.002 n = 4, Student's t test, t = 7.486; p < 0.001) and Igfbp7 (28-fold; STP, 28.08 ± 4.79 n = 4 vs STN, 1.003 ± 0.003 n = 4, Student's t test, t = 5.655; p < 0.01), as well as two STN neuron-specific genes, Ntsr1 (26-fold; STP, 1.005 ± 0.003 n = 4 vs STN, 26.01 ± 7.64 n = 4, Student's t test, t = 3.272; p < 0.05) and GPR65 (21.6-fold; STP, 1.005 ± 0.003 n = 4 vs STN, 21.64 ± 8.37 n = 4, Student's t test, t = 2.467; p < 0.05) (Fig. 2D; n = 4 for each MSN population). Additionally, the specific STP neuron expression of Rgs5 was confirmed by immunostaining showing the colocalization of Rgs5 and the STP-enriched neuropeptide enkephalin (data not shown). Finally, the comparative analysis between the Heiman et al. (2008) study and our dataset led to the identification of a subset of genes only present in the Heiman et al. (2008) study gene list. Therefore, we decided to check, in our samples, the expression of two STP neuron genes, Ttc12 (270.27-fold) and Trim25 (2.08-fold) from this subset in the Heiman et al. (2008) report. The qRT-PCR assay on independent biological replicates validated the specific expression of Ttc12 (7.3-fold, STP, 7.290 ± 0.884 n = 4; STN, 1.000 ± 0.274 n = 6, Student's t test, t = 8.081, p < 0.0001) and Trim25 (4.6-fold, STP, 4.611 ± 1.287 n = 2; STN, 1.000 ± 0.134 n = 5, Student's t test, t = 5.035, p < 0.01). Altogether, these data confirm the validity and the robustness of our strategy for the differential identification of STP and STN neurons and their FACS purification from the same mouse striata. The obtained gene profiling allows us to identify specific MSN genes including the NT5e gene whose functions in STP neurons were studied in more detail.
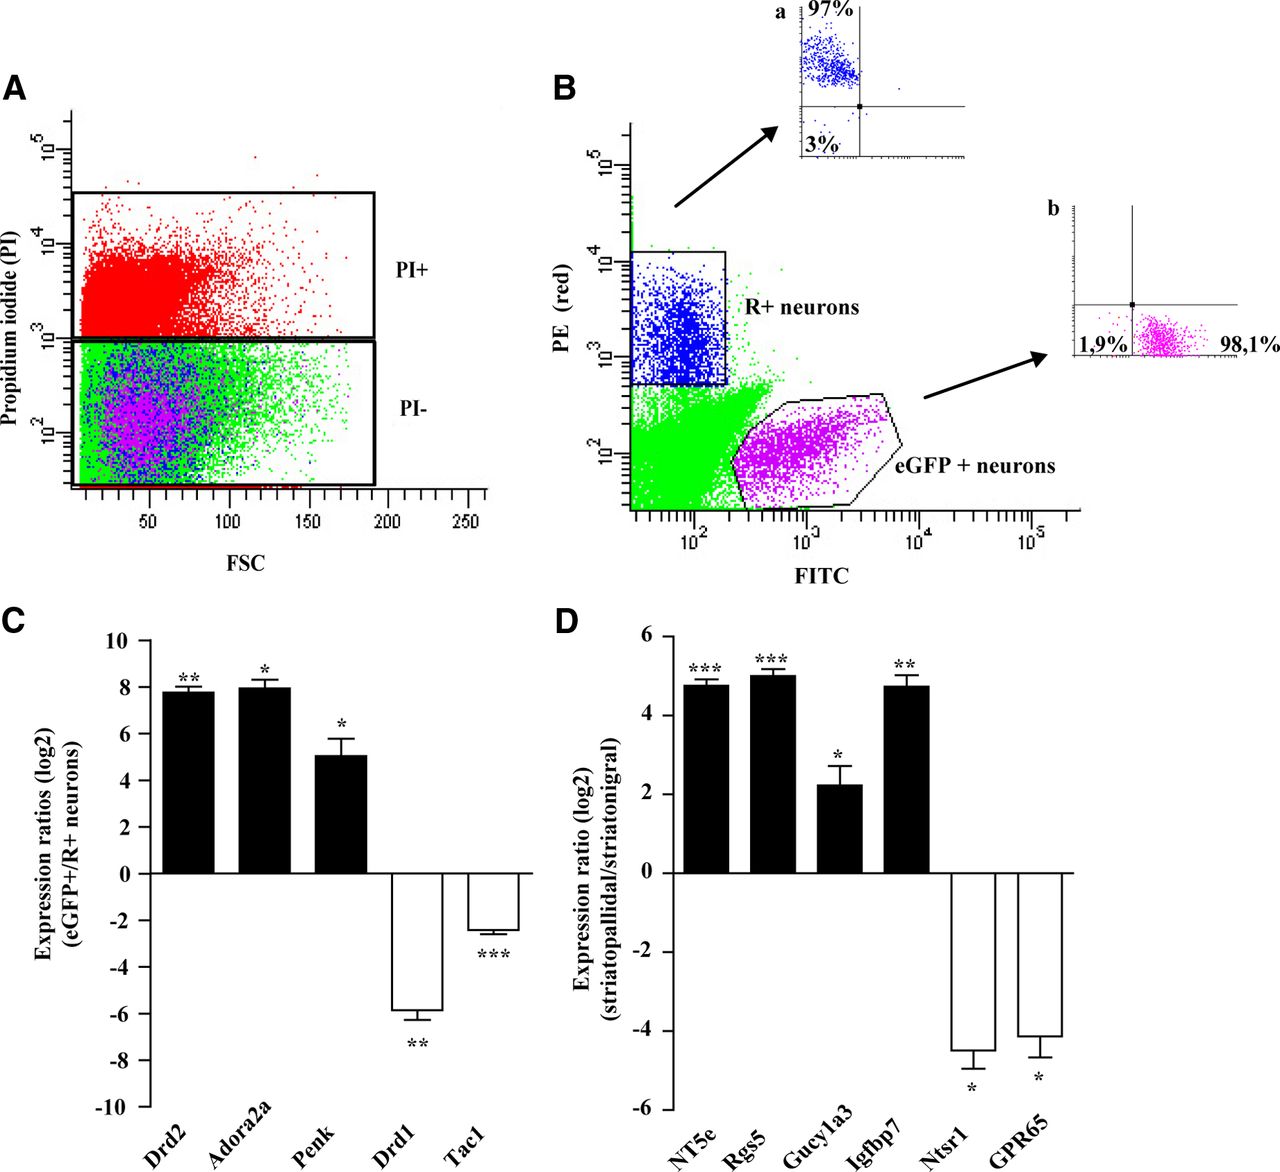
FACS purification and qRT-PCR validation of new striatopallidal and striatonigral neuron specific genes. A, B, Examples of FACS purification of the EGFP and R+ striatal neurons. To obtain a reliable purification of the EGFP+ and R+ neurons, only the PI− cell population is selected (A). Among those cells, the R+/PI− and the EGFP +/PI− neurons are purified (B). One thousand purified neurons were resorted to demonstrate the enrichment of R+ STN (Ba) and EGFP + STP neurons (Bb). C, qRT-PCR analysis using RNA extracted from GFP+ and retrolabeled + sorted neurons shows the correct segregation of the well characterized markers of the striatopallidal (Adora2a, Drd2, and Penk) and striatonigral neurons (Drd1a and Tac1) (n = 4–5). D, qRT-PCR validation of the microarray data from independent biological replicates (n = 3–4). Values are presented as mean ± SEM (n = 4–5). *p < 0.05; **p < 0.01; ***p < 0.001 by two-tailed Student's t test. FSC, Forward scatter detector; PE, phycoerythrin.
Genes highly enriched in striatonigral and striatopallidal neurons
Ecto-5′-nucleotidase is specifically expressed in striatopallidal neurons
qRT-PCR demonstrated that NT5e expression is higher in the striatum than in other structures such as cortex, cerebellum, and hippocampus (striatum, 5.376 ± 0.293 n = 4; vs cortex, 1.000 ± 0.135 n = 4, t = 13.55, p < 0.0001; vs cerebellum, 1.020 ± 0.069 n = 3, t = 12.38, p < 0.0001; vs hippocampus, 0.835 ± 0.148 n = 2, t = 10.11, p < 0.001, Student's t test). As described above, qRT-PCR clearly shows that NT5e is highly enriched in STP neurons (>27-fold in four independent replicates) (Fig. 2D; p < 0.001). The expression specificity of the NT5e in STP neurons was further confirmed by double immunofluorescence for NT5e and EGFP in Drd2-EGFP mice (www.gensat.org) (Gong et al., 2003), another transgenic mouse model expressing specifically EGFP in all STP neurons (Bertran-Gonzalez et al., 2008). Figure 3C shows that NT5e immunostaining is highly restricted to the striatum (Fig. 3B) and to axonal terminals in the lateral globus pallidus (data not shown) similar to Drd2-EGFP mice (Fig. 3A). Figure 3D–F shows the colocalization of EGFP expressed in STP neurons and NT5e (Fig. 3D–F), suggesting that the expression of NT5e in STP neurons is specific. Moreover, the fluorescence intensity profile generated for the NT5e labeling (red fluorophore) and EGFP (green fluorophore) demonstrated the membrane localization of NT5e in these neurons (Fig. 3G,H). Together, qPCR analysis and immunofluorescence confirm that the expression of NT5e is restricted to STP neurons.

NT5e is a striatopallidal neuron-specific marker. A, B, Histochemistry in a mouse model of a striatopallidal neuron-specific ablation (Adora2a-Cre+/− iDTR+/−) (Durieux et al., 2009) shows the absence of NT5e enzymatic activity (B) compared with the control (Adora2a-Cre−/− iDTR+/−) (A). C shows the nonspecific activity in absence of the enzymatic substrate in the control mice (5′AMP). D, The optical density quantification demonstrates an almost complete loss of the NT5e enzymatic activity in the absence of striatopallidal neurons in the striatum, whereas no modification is observed in the cortex. Data are expressed as optical density values (Adora2a-Cre−/− iDTR+/−, n = 8; Adora2a-Cre+/− iDTR+/−, n = 9). E–G, NT5e immunostaining in Drd2-EGFP mice shows a specific labeling of NT5e in the striatum (F) with the same expression pattern as the EGFP (E) as shown in merge image (G). H–J, High magnification in the dorsal striatum shows the expression of the EGFP-expressing striatopallidal neurons (H) and the NT5e (I); the merge image (J) shows the colocalization of the two markers. Arrowheads mark examples of neurons expressing the NT5e and EGFP. K, L, The fluorescent profile analysis of the NT5e and EGFP labelings demonstrates the presence of NT5e labeling at the membrane whereas that of EGFP is cytoplasmic. Intensity plots for the green and the red fluorophores were measured along the white line drawn on the respective merged image. Scale bars: E–G, 100 μm; H–J, 10 μm. Values are presented as mean ± SEM. ***p < 0.001 by two-tailed Student's t test.
To provide in vivo genetic confirmation of the microarray result, we used a transgenic mouse model of specific STP neuron ablation (Durieux et al., 2009, 2012). In these mice, the receptor of the diphteria toxin (DTR) is specifically expressed in STP neurons using the Adora2a-Cre mice. The stereotaxic injection of diphteria toxin in the striatum induced the cell death of STP neurons within 7 d by inhibition of protein synthesis. NT5e enzymatic activity was visualized by histochemistry in control mice (Adora2a-Cre−/− iDTR+/−) (Fig. 3A) and in lesioned mice (Adora2a-Cre+/− iDTR+/−) (Fig. 3B). The ablation of STP neurons led to an almost complete loss of NT5e activity in the dorsal striatum in comparison with control. This confirms the specific expression of NT5e in STP neurons (Fig. 3D; DTR+/Adora2a-Cre+/−, 0.083 ± 0.012 n = 9 vs DTR+/Adora2a-Cre−/−, 0.445 ± 0.012 n = 8, Student's t test, t = 21.89, p < 0.001), whereas no modification was observed in the cortex (Fig. 3D; DTR+/Adora2a-Cre+/−, 0.087 ± 0.012 n = 9 vs DTR+/Adora2a-Cre−/−, 0.090 ± 0.009 n = 8, Student's t test, t = 0.153, p > 0.05).
Ecto-5′-nucleotidase knock-out mice display striatal learning deficits
Global NT5e KO mice were first used to assess the NT5e function in behavior. Histochemistry shows the loss of the NT5e enzymatic activity in the striatum of NT5e KO mice compared with WT littermates validating the KO mouse model (Fig. 4A). Moreover, the conversion of ATP by native NT5e enzyme in striatal slices was measured by applying exogenous ATP and detecting adenosine production with biosensors in NT5e KO and WT mice (Llaudet et al., 2003; Klyuch et al., 2012). After application of ATP (10 μm), 1.69 ± 0.16 μm adenosine was measured in NT5e +/+ slices (n = 5), while in NT5e −/− slices (n = 6) the adenosine production was significantly reduced to 0.57 ± 0.14 μm (Student's t test, t = 5.345, p < 0.001) (Fig. 4B). This represents a decrease of 67% in ATP conversion, suggesting that a fraction of ATP is converted independently of NT5e in striatal slices. To study a striatum-dependent learning task, mice were trained in a motor skill learning task on an accelerating rotarod (Buitrago et al., 2004; Bearzatto et al., 2005; Durieux et al., 2012). NT5e KO mice exhibited a severe learning deficit in performing the accelerating rotarod task compared with WT control mice (Fig. 4C; NT5e KO n = 5 vs NT5e WT n = 6; two-way ANOVA followed by Bonferroni post hoc test, genotype main effect, F(1,36) = 23.55, p = 0.0009; genotype × day interaction, F(4,36) = 5.04, p = 0.0025). The two genotypes performed similarly at the first day of testing. Across the 5 d of testing, NT5e+/+ mice (day 1 vs day 5, F(4,25) = 10.91; p < 0.001, one-way ANOVA Tukey's multiple comparison test) improved their performance, whereas NT5e−/− did not (day 1 vs day 5, F(4,20) = 0.61; p > 0.05, one-way ANOVA with Tukey's multiple-comparison test). Spontaneous activity recorded in a video-tracked open field for 3 consecutive days did not significantly differ in NT5e KO mice compared with the NT5e WT control mice (Fig. 4D; two-way ANOVA followed by Bonferroni post hoc test, NT5e KO n = 5 vs NT5e WT n = 6; genotype main effect, F(1,18) = 2.34; p > 0.05), showing that the motor learning skill deficit observed in NT5e KO mice is not the consequence of a general locomotor activity deficit.

Motor skill and response learning in NT5e KO mice. A, Large decrease in enzymatic activity revealed by histochemistry in striatum of NT5e KO mice compared with WT mice. B, Superimposed adenosine biosensor traces illustrating the impaired production of adenosine from 10 μm ATP in striatal slices from NT5e KO compared with WT mice. C, Motor skill learning on an accelerating rotarod is impaired in NT5e KO mice. Mice were tested for 5 consecutive days, four trials per day. D, NT5e KO mice did not show any modification in the total horizontal distance traveled in 1 h open field when tested for 3 consecutive days. E, Cataleptic response to haloperidol (1 mg/kg, i.p) is reduced in the NT5e KO mice compared with the WT mice when tested at the different time points (WT, n = 6; NT5e KO, n = 5). Values are presented as the mean ± SEM. *p < 0.05, **p < 0.01, ***p < 0.001.
It has been demonstrated that the corticostriatal plasticity plays an important role in the acquisition and the consolidation of a learning skill (Costa et al., 2004; Dang et al., 2006; Kheirbek et al., 2009; Yin et al., 2009; Lovinger, 2010). Adenosine A2A receptors are involved in synaptic plasticity (d'Alcantara et al., 2001; Shen et al., 2008a), and recent data also report that specific striatal deletion of A2A receptor leads to the impairment of instrumental learning (Yu et al., 2009). As A2A receptors seem to be important players in the striatum-dependent learning, we hypothesized that the learning deficit observed in NT5e KO mice resulted from a decrease of A2A receptor activation as a consequence of the absence of NT5e and the decrease in extracellular adenosine. To test this hypothesis, we evaluated the catalepsy induced by the injection of the dopamine D2 antagonist haloperidol. Indeed, it has been demonstrated that the deletion of A2A receptors led to the decrease of the cataleptic responses to haloperidol showing the implication of the tonic activation of A2A receptor in this behavior (Chen et al., 2001; El Yacoubi et al., 2001). Mice were injected with haloperidol (1 mg/kg, i.p), and the cataleptic activity was tested at four different time points (30, 60, 90, and 120 min after drug administration). The cataleptic response was significantly decreased in NT5e KO mice compared with littermate controls (Fig. 4E; two-way ANOVA followed by Bonferroni post hoc test, NT5e KO n = 5 vs NT5e WT n = 6; genotype main effect, F(1,27) = 6.10; p = 0.0356). These results suggest the involvement of extracellular adenosine produced by NT5e in the activation of adenosine A2A receptors.
shRNA-mediated ecto-5′-nucleotidase gene silencing
Although our histochemical data strongly suggest that the bulk of NT5e activity resides in STP neurons, NT5e inactivation in other brain areas and in striatal astrocytes could contribute to the results obtained in NT5e KO mice. Therefore, to confirm the STP NT5e role in the functional consequences observed in NT5e KO mice, we elaborated a lentivirus-based RNA interference strategy using Cre/LoxP conditional lentiviral vectors pSicoR and pSico (Ventura et al., 2004) to induce restricted striatal and STP knockdown, respectively (Fig. 5A,B). Three sequences of shRNA were designed to target three different regions of the mouse NT5e gene (sh1028, sh1367, and sh1557) (Fig. 5C). shRNA or scramble sequence was cloned into the lentiviral expression vectors and lentivirus carrying pSico or pSicoR (LV-sh1028, LV-sh1367, LV-sh1557) and one control lentivirus expressing a scramble sequence (LV-shscr) were produced.

Ecto-5′-nucleotidase expression silencing strategy. A, Schematic representation of pSicoR (used in Figs. 6, 8 and 9). B, Schematic representation of pSico before and after Cre-mediated recombination (used in Figs. 7, 8, 9). C, Sequences of shRNA targeting the mouse NT5e. The position is given relative to the ATG of the NT5e cDNA. D, Quantification of NT5e expression by qPCR in striatal primary cultures after infection with LV-pSicoR-shRNA (n = 3/group).Values are presented as the mean ± SEM. **p < 0.01. CMV, Cytomegalovirus promoter; U6, mouse U6 promoter.
The respective efficiencies of the three different candidate shRNA sequences were tested in primary striatal neuronal culture infected with LV-pSicoR-shRNA. Striatal neurons infected with LV-pSicoR-shscramble (LV-pSicoR-shscr) were used as control. Nine days after lentiviral infection, the silencing of NT5e was measured by qPCR analysis. LV-pSicoR-sh1557 induced 93% decrease in NT5e mRNA level compared with the LV-pSicoR-shscr control (Fig. 5D; shscr 100 ± 4.153 n = 3 vs sh1557 6.934 ± 4.020 n = 3; p < 0.01, one-way ANOVA followed by Dunnett's multiple-comparison test). The other candidate sequences were less efficient, resulting in 75% and 45% NT5e expression decreases, respectively (Fig. 5D; shscr 100 ± 4.153 n = 3 vs sh1028 25.10 ± 9.772 n = 3, p < 0.01; vs sh1367 53.57 ± 24.61 n = 3, p > 0.05, one-way ANOVA followed by Dunnett's multiple comparison test). When the three shRNAs were coinfected, no further enhancement of NT5e silencing was observed compared with the shRNA 1557 (Fig. 5D; shscr 100 ± 4.153 n = 3 vs mix 3shRNA 7.588 ± 3.795 n = 3, p < 0.01, one-way ANOVA followed by Dunnett's multiple comparison test). This result shows that the LV-shRNA 1557 (shNT5e) exhibits the most efficient silencing effect, and it was therefore chosen for in vivo experiments.
In vivo knockdown of endogenous ecto-5′-nucleotidase expression
Silencing efficiency of the LV-shRNA was tested in vivo by unilateral injection the LV-pSicoR-shNT5e in the dorsal striatum. Animals injected with the LV-shscr were used as controls. pSicoR lentivector was used in those experiments because it allowed the simultaneous expression of the shRNA and EGFP in the infected neurons. The expression of NT5e and the EGFP labeling was evaluated to identify the areas and neurons infected by the lentivirus. One month after the stereotaxic injection of LV-pSicoR-shNT5e, immunostaining against NT5e showed a substantial decrease of this labeling (Fig. 6D) in the area where neurons are EGFP positive (Fig. 6C), whereas the area infected by the LV-pSicoR-shscr (Fig. 6A) presented a normal NT5e expression (Fig. 6B). Double immunofluorescence for EGFP and the neuronal marker NeuN showed similar density of NeuN-labeled neurons in areas of EGFP expression from striatum infected either by the LV-pSicoR-shscr (Fig. 6E,F) or LV-pSicoR-shNT5e (Fig. 6G,H). Altogether, these results show the efficient in vivo silencing of NT5e expression by shNT5e without modification of the target structure integrity.

The shNT5e reduces NT5e expression but does not modify the integrity of the striatum. A–H, Fluorescent immunostaining shows striatum 1 month after the stereotaxic injection of LV-pSicoR-shscramble (A, B, E, F) or LV-pSicoR-shNT5e (C, D, G, H). EGFP labeling shows transduced neurons after injection of either shscramble (A) or shNT5e (C). Fluorescent immunostaining against NT5e in the striatum shows loss of immunoreactivity in the EGFP-positive area injected with the shNT5e (D) but not in the area injected with the shscramble (B). NeuN immunostaining (neuronal marker) shows an intact labeling in both striata injected with the shscramble (F) or the shNT5e (H), indicating that the NT5e knockdown and the lentiviral injection did not modify the integrity of the target structure. Scale bar, 10 μm.
To assess the specificity of STP knock-down model, we took advantage of the EGFP conditional expression in pSico. As described earlier, the EGFP expression only occurs in cells that do not express the Cre recombinase. When the Cre recombinase is expressed, the Cre recombination allows the shRNA expression but not the EGFP expression. We therefore showed that, in Adora2aCre−/− injected with the LV-pSico-shNT5e, EGFP is present in all enkephalin-positive neurons, i.e., in the STP neurons (Fig. 7A–C). Thus, there is no recombination in STP neurons and, hence, no decrease in NT5e expression and NT5e enzymatic activity as shown in Figure 7D. Conversely, in Adora2aCre+/−, the EGFP immunostaining is not localized in enkephalin-positive neurons (Fig. 7E–G), confirming the recombination of pSico in STP neurons, which induced NT5e gene repression and the decrease of NT5e enzymatic activity in the LV-pSico-shNT5e injected area (Fig. 7H). To support these data, we also show in Adora2aCre+/− × tdTomato floxed+/− mice injected with the LV-pSico-shNT5e that the STP neurons visualized through tdTomato expression never colocalize with the EGFP in the LV-injected area (Fig. 7I–K). Together, these results prove the specific Cre recombination of pSico in STP neurons in Adora2aCre+/− mice and validate our STP knock-down model.
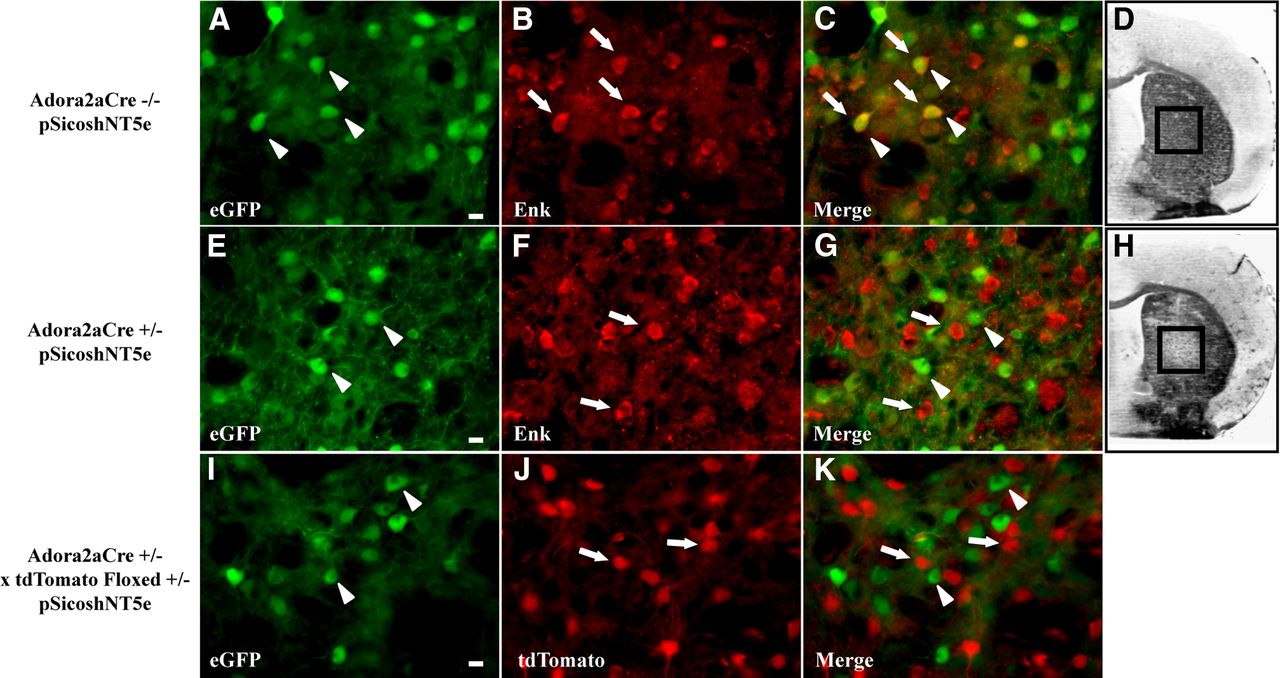
A–H, Injection of LV-pSico-shNT5e in Adora2aCre−/− (A–D), in Adora2aCre+/− (E–H) and AdoraCre+/− × tdTomato floxed +/− mice shows the specific recombination of pSico in striatopallidal neurons. Fluorescent immunostaining against EGFP (A, E) and enkephalin (Enk) (B, F) in the striatum shows a colocalization of Enk and EGFP staining in Adora2aCre−/− (C) but not in Adora2aCre+/− injected striatum. NT5e histochemistry on adjacent slice demonstrates a decrease in NT5e enzymatic activity in Adora2aCre+/− (H) but not in Adora2aCre−/− striatum (D). Imaging of the EGFP immunostaining (I) and the tdTomato native fluorescence (J) demonstrates the absence of colocalization in Adora2aCre+/− striatum (K). Arrowheads mark examples of EGFP+ neurons; arrows mark example of Enk+ or tdTomato+ neurons. Scale bar, 10 μm.
Motor learning deficit in ecto-5′-nucleotidase knock-down mice
The behavioral consequences of the striatal NT5e knockdown were tested in vivo by bilateral injection of lentiviruses carrying the shNT5e (LV-pSicoR-shNT5e) or shscramble (LV-pSicoR-shscr) into the dorsal striatum of WT mice. Although our morphological and validation data strongly suggest that striatal NT5e expression is highly restricted to STP neurons, it is well known that other cell types such as astrocytes also express this enzyme (Snyder et al., 1983; Caciagli et al., 1988; James and Richardson, 1993; Queiroz et al., 1997; Serrano et al., 2006). This astrocyte expression could contribute to the local production of adenosine and hence to the observed phenotype. Therefore, we performed a specific NT5e knockdown in STP neurons by injecting LV-pSico-shNT5e in the dorsal striatum of Adora2a-Cre+/− mice. Here, the Cre recombinase induced the LoxP recombination and the expression of shNT5e only in STP neurons. Mice injected with LV-pSicoR-shscr and Adora2a-Cre−/− mice injected with LV-pSico-shscr were used as control. One month after injection, the animals were tested in behavioral tasks and then killed to measure the efficiency of NT5e silencing by histochemistry. Both LV-pSicoR-shNT5e and LV-pSico-shNT5e injection into the dorsal striatum resulted in ∼1 mm anterior to posterior spread of the NT5e downregulation into the injected dorsal striatum (Fig. 8A,B). NT5e activity was not modified in the LV-shscr control (Fig. 8A,B). Quantification of the NT5e activity by histochemistry in the downregulated striatal area showed a significant decrease of the OD by 28% (shscr, 100.00 ± 3.87 n = 11 vs shNT5e, 71.32 ± 6.74 n = 12, Student's t test, t = 3.601, p < 0.01), 45% (shscr, 100.00 ± 4.60 n = 11 vs shNT5e, 54.92 ± 5.60 n = 12, Student's t test, t = 6.147, p < 0.001), and 39% (shscr, 100.00 ± 4.85 n = 11 vs shNT5e, 61.56 ± 6.15 n = 11, Student's t test, t = 4.909, p < 0.001) at coronal levels +0.74, +0.26, and +0.14 mm, respectively (Fig. 8C). No significant downregulation was found at the most anterior level (+1.18 mm; shscr, 100.00 ± 3.13 n = 11 vs shNT5e, 95.60 ± 6.77 n = 11, Student's t test, t = 0.589, p > 0.05) and posterior level (−0.34 mm; shscr, 100.00 ± 4.53 n = 10 vs shNT5e, 92.86 ± 5.21 n = 12, Student's t test, t = 0.589, p > 0.05) (Fig. 8C). No significant knockdown was found in the two most anterior levels in the STP neuron NT5e knockdown (+1.18 mm; shscr, 100.00 ± 2.64 n = 5 vs shNT5e, 90.33 ± 5.71 n = 7, Student's t test, t = 1.345, p > 0.05; + 0,74; shscr, 100.00 ± 8.04 n = 5 vs shNT5e, 84.67 ± 4.76 n = 7, Student's t test, t = 1.748, p > 0.05). However, LV-pSico-shNT5e reduced the NT5e expression in the striatum as demonstrated by a 21%, 26%, and 20% decrease in NT5e activity respectively at coronal levels +0.26 mm (shscr, 100.00 ± 4.18 n = 5 vs shNT5e, 79.49 ± 3.71 n = 7, Student's t test, t = 2.520, p < 0.01), +0.14 mm (shscr, 100.00 ± 5.86 n = 5 vs shNT5e, 80.38 ± 5.87 n = 7, Student's t test, t = 2.294, p < 0.05) and −0.34 mm (shscr, 100.00 ± 2.64 n = 5 vs shNT5e, 90.33 ± 5.70 n = 7, Student's t test, t = 1.345, p < 0.05).

Bilateral injection of lentivirus-expressing shNT5e results in an efficient downregulation of NT5e in striatum. A, B, Histochemistry for NT5e shows the anterior to posterior extension of areas with decreased NT5e activity elicited by the shNT5e and the absence of any modification with shscrambles with both pSicoR (A) and pSico (B) lentiviral vectors. Sections are arranged from anterior to posterior levels with coordinates referred to the bregma. C, D, Quantification of the optical density shows a significant decrease of the NT5e activity in three of five levels in the striatum injected with either pSicoR (shscramble = 10–11; shNT5e = 11–12) or pSico (shscramble n = 5; shNT5e n = 7). Data are expressed as a percentage of optical density values in pSicoR or pSico-shscramble controls. Values are presented as the mean ± SEM. *p < 0.05, **p < 0.01, ***p < 0.001 by two-tailed Student's t test.
As shown for NT5e KO mice, LV-pSicoR-shNT5e mice (striatal knock-down model) did not display a significant difference in the horizontal distance traveled compared with the LV-pSicoR-shscr injected group (Fig. 9A; two-way ANOVA followed by Bonferroni post hoc test, LV-pSicoR-shscr n = 11 vs LV-pSicoR-shNT5e n = 12; genotype main effect, F(1,42) = 0.01; p > 0.05). Similarly, in the STP neuron knock-down model Adora2a-Cre mice injected with LV-pSico-shNT5e did not show any modification in the horizontal distance traveled compared with their shscr controls (Fig. 9C; two-way ANOVA followed by Bonferroni post hoc test, LV-pSico-shscramble n = 5 vs LV-pSico-shNT5e n = 7; genotype main effect, F(1,22) = 0.16; p > 0.05). To confirm the learning deficit observed in NT5e KO mice, accelerating rotarod task was performed. LV-pSicoR-shNT5e injected mice showed a significant motor learning deficit compared with the LV-pSicoR-shscr (Fig. 9B; LV-pSicoR-shscr n = 11 vs LV-pSicoR-shNT5e n = 12; two-way ANOVA followed by Bonferroni post hoc test, genotype main effect, F(1,84) = 7.51; p = 0.012; genotype × day interaction, F(4,84) = 2.96; p = 0.024). Moreover, Adora2a-Cre+/−/LV-pSico-shNT5e mice also displayed a significant and similar motor learning deficit (p < 0.05) compared with their control group (Fig. 9D; LV-pSico-shscr n = 5 vs LV-pSico-shNT5e n = 7; two-way ANOVA followed by Bonferroni post hoc test, genotype main effect, F(1,40) = 6.72; p = 0.027; genotype × day interaction, F(4,40) = 2.99; p = 0.03). These results confirm the striatal phenotype and demonstrate that the motor learning deficit is specifically the consequence of the NT5e downregulation in STP neurons.

Motor skills in striatal and striatopallidal neuron NT5e knockdown. A–C, Analysis of the spontaneous locomotor activity in 1 h open field does not reveal any difference in the total horizontal distance run in the two groups injected with the shNT5e or shscramble lentivirus when tested for 3 consecutive days. B, D, Motor skill learning on an accelerating rotarod paradigm is impaired in mice with a striatal NT5e knockdown (LV-pSicoR-shNT5e) (B, n = 11–12 per group) as well as in mice with a striatopallidal neuron NT5e knockdown (LV-pSico-sh1557 injected in Adora2a-Cre+/− mice) (D, n = 5–6 per group). Mice were tested for 5 d, four trials per day. Values are presented as the mean ± SEM. *p < 0.05, **p < 0.01 by two-way ANOVA followed by a Bonferroni post hoc test.
Discussion
This study identifies new STP and STN neuron-specific genes by means of a reliable technique using the Adora2aCre transgenic mouse model and retrograde labeling, leading to the specific identification of adult mouse STP and STN neurons, respectively, combined with the FACS array profiling. These led to the identification of the unexpected role of STP neuron expression of NT5e in motor learning.
Our FACS array profiling identified previously well known MSN specific genes as well as recently described STN and STP neuron-specific genes (Lobo et al., 2006, 2007; Heiman et al., 2008). Our approach also led to the identification and validation of new STP (Rgs5, Igfbp7) and STN (GPR65, Ntsr1) neuron-specific genes. However, a subset of genes identified in the Heiman et al. (2008) study was not represented in our data list. We therefore validated our approach by carrying out qPCR on mRNA from independent FACS-sorted STN and STP neuron samples for two STP neuron-specific genes, identified in the Heiman et al. (2008) study, Ttc12 and Trim25. Our qPCR analysis also showed the specific STP neuron expression of Ttc12, for which probeset on the Affymetrix MAO 2.0 gave little signal, and of Trim 25, for which the fold change was not >2, indicating a sampling problem rather than a purification problem that could contribute to type II errors (false negatives).
An advantage of our approach is that both MSN RNA preparations were isolated from the same animal, reducing the interindividual variability. Another advantage of our approach is that selective expression of Cre recombinase from the Adora2a locus exclusively targets STP neurons (Durieux et al., 2009, 2012) rather than being expressed in both STP and cholinergic interneurons, as is the case for Drd2 (Yan et al., 1997; Bertran-Gonzalez et al., 2008).
In view of its potential importance in the modulation of the striatal microcircuit and, hence, of the basal ganglia system, we focused our attention on NT5e.
NT5e, a membrane-bound glycophosphatidylinositol-anchored ecto-enzyme, is the ultimate enzyme in a metabolic cascade encompassing ecto-nucleotidases that generate extracellular adenosine from adenine nucleotides as ATP that is coreleased with several neurotransmitters upon nerve stimulation (Cunha, 2008; Zimmermann et al., 2012). At physiological concentrations, adenosine influences many brain functions mostly by activation of A1 and A2A receptors (Fredholm et al., 2001, 2005), resulting in fine-tuning regulation of neurotransmitter release, neuronal excitability, synaptic activity, neuronal viability (neuroprotection), or astrocytic and microglial activities (Kirkpatrick and Richardson, 1993; Okada et al., 1996; Sebastião and Ribeiro, 2000; Cunha, 2001b; Gomes et al., 2011). There are two main sources of extracellular adenosine during physiological neuronal firing: the extracellular conversion of adenine nucleotides by ecto-nucleotidases including NT5e, and adenosine export through bidirectional equilibrative nucleoside transporters (Cunha, 2001a, 2008; Latini and Pedata, 2001). The mechanism involving ecto-nucleotidases was proposed to be related to the control of synaptic activity since it generates a synaptic pool of adenosine that is refilled as a function of neuronal firing (Cunha, 2008). However, since extracellular ATP can also originate from astrocytes, both synaptic and nonsynaptic production of adenosine by NT5e may occur. Astrocytically produced adenosine is mostly targeting A1 receptors leading to a global tonic inhibition (Pascual et al., 2005; Cunha, 2008), whereas the synaptically generated adenosine preferentially and locally activated A2A receptors (Cunha, 2008). Calcium-dependent release of adenosine has also recently been proposed for extracellular adenosine production (Pajski and Venton, 2010; Klyuch et al., 2012; Lovatt et al., 2012). Yet, the relative contributions of different cellular and metabolic sources of extracellular adenosine (astrocytes vs neurons, synaptic vs nonsynaptic, released per se vs generated from extracellular ATP) remain unclear and controversial.
Among striatal intrinsic neuronal populations, STP MSNs selectively and abundantly express A2A receptors (Schiffmann et al., 1991, 2003, 2007). Antagonistic interactions between A2A and D2 receptors strongly modulate the function of these MSNs through opposite actions on intracellular signaling cascades and via a reciprocal intramembrane A2A–D2 receptor interaction (Schiffmann et al., 2003, 2007; Ferré et al., 2005; Azdad et al., 2009). Moreover, corticostriatal glutamatergic terminals express facilitatory A2A and inhibitory A1 receptors (Ciruela et al., 2006), whose effects on glutamate release depend on extracellular adenosine level at the synapse and, ultimately, on the local synaptic activity (for review, see Cunha et al., 1996; Cunha, 2001a, 2008). Thus, by acting on presynaptic and/or postsynaptic A1 and/or A2A receptors, extracellular adenosine exhibits multiple modulatory actions on synaptic activity in the striatum, but the sources of this adenosine, their exact locations, and the sites of adenosine actions in this system remained unknown.
In agreement with previous studies (Schoen and Graybiel, 1992; Langer et al., 2008), we demonstrated that NT5e is more abundantly expressed in the striatum than in other brain regions. NT5e activity was identified in both neuronal and glial cells (James and Richardson, 1993; Queiroz et al., 1997; Sowa et al., 2010). However, no consistent data were available concerning the cellular localization of NT5e in the striatum. Using specific STP neuron ablation model, histochemistry, and immunofluorescence, we demonstrated the specific expression of NT5e at the membrane of STP neurons, where it constitutes at least 80% of striatal NT5e activity. This implies that, in this region, the process of adenosine generation at the extracellular level by ATP breakdown is primarily controlled by STP neurons.
The NT5e KO mice were used for a first assessment of the role of NT5e in behavior. We show that the NT5e KO mice display a complete disruption of motor learning in a rotarod paradigm and a decrease in haloperidol-induced catalepsy. Consistent with previous studies in A2A receptor knock-out mice showing a requirement of these receptors for haloperidol-induced catalepsy (Chen et al., 2001; El Yacoubi et al., 2001), present evidence suggests that lack of A2A receptor activation in STP neurons underlies this behavioral deficit of NT5e KO mice. Yet, these behavioral alterations may depend, at least in part, on inactivation of NT5e in other brain areas and in striatal astrocytes. Therefore, to confirm the specific role of NT5e in STP neurons, we successfully developed a lentivirus-mediated shRNA knock-down strategy in the striatum and also more specifically in STP neurons. Interestingly, the decrease in NT5e expression was smaller in the STP neuron than in full striatal knock-down models, probably due to the dependence of Cre recombination for the shRNA expression in the former model. Moreover, although our results showed a predominant expression of NT5e in STP neurons, a weak NT5e expression in glial cells is plausible and therefore these cells would express the shRNA targeting NT5e only in the striatal knock-down mouse model. The striatal and the STP neuron knock-down mice recapitulated the behavioral profile of NT5e KO mice characterized by a significant impairment of motor skill learning, thus indicating that NT5e loss impairs striatum-dependent learning tasks. Our results therefore suggested that disruption of extracellular adenosine production leads to a lack of activation of A2A receptor in STP neurons and/or presynaptic A2A receptors that could affect synaptic mechanisms underlying striatum-dependent learning. The specific and similarly high coexpression of NT5e and A2A receptors by an MSN subpopulation and hence at the same corticostriatal synapse also suggested a local modulatory mechanism similar to the one shown in the synapses between mossy fibers and CA3 pyramidal neurons (Rebola et al., 2008).
In contrast to our results, a recent microdialysis study suggests that striatal generation of adenosine is dependent on ecto-nucleotidase activity in ischemic conditions but not in physiological condition (Melani et al., 2012). However, microdialysis could probably not resolve local variations in adenosine levels in the synaptic activity time window.
In conclusion, the FACS array profiling performed in adult mice provides new gene datasets regrouping known and unknown STP and STN neuron-specific genes. The current study highlights the role of NT5e, validated as a STP neuron-specific gene, in striatum-dependent learning. These results show the efficiency of our experimental procedure to identify new molecules involved in the basal ganglia physiology and can be easily transposed to conditional knock-out mice or pathological models to identify new molecular players and to evaluate compensatory mechanisms taking place in STP and STN neurons.
Footnotes
- Received June 25, 2012.
- Revision received April 8, 2013.
- Accepted April 10, 2013.
S.L.E. was supported by a FRIA (Fonds pour la formation à la Recherche dans l'Industrie et dans l'Agriculture) PhD fellowship from the Fund for Scientific Research-Fonds de la Recherche Scientifique (FRS-FNRS) (Belgium) and a Biowin grant from the Walloon Region. A.d.K.d'E. is a Research Associate of the FRS-FNRS (Belgium). This study was supported by the Fondation Médicale Reine Elisabeth (Belgium), FRS-FNRS (Belgium), FER (Fonds d'Encouragement à la Recherche) from Université Libre de Bruxelles, the Interuniversity Attraction Poles program (IUAP–P7/10) from the Belgian State, Federal Office for Scientific Affairs, Action de Recherche Concertée from the FWB (Fédération Wallonie-Bruxelles). We thank Professor Linda Thompson and Professor Corrinne Lobe for providing the NT5e knock-out mice and Z/EG mice, respectively; Professor Oberdan Leo and Georgette Vansanten for the expertise with FACS and the use of their FACS facilities; Dr. Fabrice Heizt for his expertise with lentiviral vectors; Professor Nicholas Dale and Dr. Robert Sims for their help with the adenosine biosensors; Delphine Houtteman, Laetitia Cuvelier, and Souad Laghmari for expert technical assistance; and Professor Michele Zoli for the helpful and critical comments on the manuscript. We would like to acknowledge Professor Jean-Marie Vanderwinden and Dr. Frédéric Bollet-Quivogne from the Light Microscopy Facility, Université Libre de Bruxelles, Brussels, Belgium, for their support with the imaging presented herein.
The authors declare no competing financial interests.
- Correspondence should be addressed to either Dr. Alban de Kerchove d'Exaerde or Dr. Serge N. Schiffmann, Laboratory of Neurophysiology, Université Libre de Bruxelles 808, Route de Lennik CP601, B-1070 Brussels, Belgium, adekerch{at}ulb.ac.be or sschiffm{at}ulb.ac.be
- Copyright © 2013 the authors 0270-6474/13/338794-16$15.00/0