
Abstract
Pitch is one of the most fundamental percepts in the auditory system and can be extracted using either spectral or temporal information in an acoustic signal. Although pitch perception has been extensively studied in human subjects, it is far less clear how nonhuman primates perceive pitch. We have addressed this question in a series of behavioral studies in which marmosets, a vocal nonhuman primate species, were trained to discriminate complex harmonic tones differing in either spectral (fundamental frequency [f0]) or temporal envelope (repetition rate) cues. We found that marmosets used temporal envelope information to discriminate pitch for acoustic stimuli with higher-order harmonics and lower f0 values and spectral information for acoustic stimuli with lower-order harmonics and higher f0 values. We further measured frequency resolution in marmosets using a psychophysical task in which pure tone thresholds were measured as a function of notched noise masker bandwidth. Results show that only the first four harmonics are resolved at low f0 values and up to 16 harmonics are resolved at higher f0 values. Resolvability in marmosets is different from that in humans, where the first five to nine harmonics are consistently resolved across most f0 values, and is likely the result of a smaller marmoset cochlea. In sum, these results show that marmosets use two mechanisms to extract pitch (harmonic templates [spectral] for resolved harmonics, and envelope extraction [temporal] for unresolved harmonics) and that species differences in stimulus resolvability need to be taken into account when investigating and comparing mechanisms of pitch perception across animals.
Introduction
Pitch is one of the most important percepts in audition and a principle attribute of spectrally and temporally periodic sounds, including music and speech (Plack et al., 2005; Moore, 2012). Many vertebrate species are sensitive to pitch, including songbirds (Cynx and Shapiro, 1986; Lohr and Dooling, 1998; Dooling et al., 2002), chinchillas (Shofner, 2011), cats (Heffner and Whitfield, 1976), ferrets (Kalluri et al., 2008; Walker et al., 2009), and monkeys (Tomlinson and Schwarz, 1988). Pitch is not explicitly represented in the cochlea; instead, it must be computed centrally. For example, pitch can be extracted by calculating the specific frequencies of, and harmonic spacing between, the individually identified (resolved) components of a complex sound (Plomp, 1964; Plomp and Mimpen, 1968).
Resolvability is estimated by measuring sensory thresholds for pure tones as a function of notch width in a notched-noise masker (Patterson, 1976; Glasberg and Moore, 1990). These estimates assume that the basilar membrane contains a bank of auditory filters, and different frequencies are resolved if they are processed by separate filters (Fletcher, 1940). As the width of the notch increases, the power of the noise passing through the filter, and thus the sensory threshold, decreases. These threshold data are used to estimate the equivalent rectangular bandwidth (ERB), which is the bandwidth of a rectangular filter passing the same total energy as the purported auditory filter.
If harmonics cannot be separated out on the cochlea (unresolved), pitch must be derived from the time-varying pattern of vibrations produced by the interaction of those harmonics on the basilar membrane. A compelling case has been made for temporal coding mechanisms in humans (de Cheveigné, 1998; Meddis and Hewitt, 1991a, 1991b; Meddis and O'Mard, 1997; Yost et al., 1996; but see Oxenham et al., 2011) and animals (Cariani and Delgutte, 1996a, 1996b; Simmons and Buxbaum, 1996). However, combining spectral and temporal mechanisms provides a more parsimonious explanation of human psychophysical data (Flanagan and Guttman, 1960a, 1960b; Guttman and Flanagan, 1964; Carlyon and Shackleton, 1994; Shackleton and Carlyon, 1994), suggesting that pitch extraction is dependent on frequency resolution in the auditory periphery.
Recent work has described a putative area specialized for pitch processing in auditory cortex of marmosets (Bendor and Wang, 2005, 2010), similar to that in humans (Patterson et al., 2002; Penagos et al., 2004; Bendor and Wang, 2006; Wang and Walker, 2012). In marmosets, this area contains neurons that encode pitch using spectral or temporal envelope cues (Bendor et al., 2012). To evaluate the influence of harmonic resolvability on pitch perception, we trained marmosets to discriminate complex tones in which temporal cues (envelope repetition rate) could be varied independently from spectral cues (f0). We then measured frequency resolution using a psychophysical task in which tone thresholds were measured as a function of notched noise bandwidth. Results show that marmosets are sensitive to phase in harmonic complex sounds and can extract pitch using both spectral and temporal envelope cues and that the particular cue used depends on the resolvability of the stimulus spectrum.
Materials and Methods
Subjects.
Six common marmosets (five male, one female) were used in these experiments: four in Experiment 1 and five in Experiment 2 (three were subjects in both experiments). Animals were housed in individual cages in a large colony at the Johns Hopkins University School of Medicine and were maintained at ∼90% of their free-feeding weight on a diet consisting of monkey chow, fruit, and yogurt and had ad libitum access to water. Subjects were tested five days per week between the hours of 0900 and 1800. All experimental procedures were approved by the Johns Hopkins University Animal Care and Use Committee and were in compliance with the guidelines of the National Institutes of Health.
Operant testing apparatus.
Marmosets were tested while seated in a Plexiglas restraint chair mounted in the center of a single-walled sound isolation chamber (Industrial Acoustic, model 400A) lined with 3-inch acoustic absorption foam (Pinta Acoustics). A food delivery tube was positioned at the top of the restraint chair in front of the animal; and a custom bracket, which housed an infrared photobeam, was mounted to the end of the feeding tube. Responses were recorded whenever the animal broke the photobeam by licking at the tube. Reward food consisted of a mixture of Similac baby formula, Gerber single-grain rice cereal, and strawberry-flavored Nesquik, delivered via a syringe pump (New Era Pump Systems, model NE-500) mounted to the base of the chair.
All sound stimuli were generated using MATLAB software (MathWorks) and delivered at a nominal sampling rate of 100 kHz through a digital signal processor and programmable attenuator (Tucker-Davis Technologies, RX6 and PA5) followed by an audio amplifier (Crown Instruments, model D-75). Stimuli were played from a speaker (Tannoy) mounted 40 cm directly in front of the animal and were calibrated before each experiment using a 1/2” free-field microphone (Brüel and Kjaer, type 4191) positioned at the same location as the animal's head. Test sessions were monitored via portable webcam (Logitech, model B905).
Operant methods.
The basic operant task has been described in detail previously (Osmanski and Wang, 2011; Remington et al., 2012). Briefly, each session was comprised of 100 trials, each of which was composed of the following: (1) a 3–10 s variable duration waiting period in which a “background” sound was repeatedly presented to the animal, and (2) a 5 s response window in which the background sound was alternated with a “target” sound. Animals had to detect the presentation of the target sound and respond by licking the feeding tube (“hit”) to receive food reward. Response latency was measured as the time from the first target onset to the time of lick onset (i.e., when the animal first broke the infrared photobeam). Thirty percent of all trials were catch trials in which the target was the same as the background. Licks during a catch trial resulted in a “false alarm” and the chamber lights were extinguished (a “blackout”) for 5 s. A failure to respond during a target or catch trial was recorded as a “miss” or “correct reject,” respectively.
Experiment 1.
Marmosets were trained to discriminate harmonic complex tones differing in their phase relationships. Each stimulus consisted of up to nine harmonics and was constructed so that the components either all began in cosine phase (COS) or were alternated such that odd harmonics began in sine phase and even harmonics began in cosine phase (ALT). The f0 of a COS stimulus is the same whether it is measured using that sound's envelope repetition rate (temporal) or using the spacing between the sound's harmonics (spectral). An ALT stimulus, however, has the same harmonic spacing (and thus the same pitch derived from spectral cues) as a corresponding COS stimulus, but double the envelope repetition rate (i.e., the pitch derived from temporal envelope cues is one octave higher) (Fig. 1).

Harmonic complex tone stimuli. Harmonics were either in same (COS) or alternating (ALT) phase (odd harmonics in sine phase, even harmonics in cosine phase). Acoustic waveforms (left column) and frequency spectra (right column) shown for three example stimuli: 150 Hz f0 COS (top), 300 Hz f0 COS (middle), and 150 Hz f0 ALT (bottom). ALT stimuli have an identical spectrum, but twice the repetition rate, of a COS stimulus with the same f0.
Stimuli were 500 ms (20 ms rise/fall time, 200 ms interstimulus interval) and presented at an average level of 70 ± 4 dB SPL. Intensity was roved for each stimulus presentation to remove potential amplitude cues between stimuli with differing phase relationships. Stimuli were presented in blocks of 10 trials. Each block contained five COS targets, two ALT targets, and three catch trials. ALT stimuli essentially functioned as low-probability probe sounds to determine whether they were perceived in the same way as the higher-probability COS stimuli. We quantified responses in terms of d′ [d′ = z(hit rate) − z(false alarm rate)] (higher d′ values indicate better discriminability), as well as a corrected hit rate [hit ratecorr = (hit rate − false alarm rate)/(1 − false alarm rate)] (Gescheider, 1985). Final d′ and hit rate values are based on a minimum of 300 trials. Sessions with a false alarm rate >25% were discarded (<10% of all sessions). Significance tests were conducted with a Bonferroni correction.
Experiment 2.
Marmosets were trained to detect a 500 ms pure tone target (20 ms rise/fall time, 200 ms interstimulus interval) against a silent background. Targets were alternated with equal-duration periods of silence during the response window. We tested frequencies of 500, 1000, 7000, and 16,000 Hz. Seven different amplitudes (in 5 dB SPL steps) of a given tone frequency were presented per session and were chosen based on previously measured thresholds (Osmanski and Wang, 2011). Threshold was defined as the target amplitude corresponding to a hit rate of 50% correct detection, after a correction for false alarm rate. If a threshold could not be determined, tone amplitudes were adjusted in the subsequent session to bracket the presumed threshold. Animals were tested until threshold values stabilized (i.e., three successive sessions in which the obtained threshold was within ±1/3 step size). Final threshold estimates are based on a minimum of 300 trials. Sessions with a false alarm rate >25% were discarded (<12% of all sessions).
Once thresholds were determined in quiet, the detection task was modified to include a continuous broadband noise played across the effective bandwidth of the speaker (0.8–54 kHz). Noise level was increased over several sessions until thresholds were elevated ∼35 ± 5 dB relative to thresholds in quiet. The level of the noise was the same for all animals at a given frequency but varied across frequencies. The average noise spectrum level required to attain the criterion threshold shift across all frequencies tested was 34.8 ± 2.3 dB. Subsequent thresholds were measured by adding spectral notches to the noise background. Notched noise filter coefficients were generated in MATLAB and input to the digital signal processor. Notches were logarithmically centered on the tone frequency with bandwidths of 0.125, 0.25, 0.5, 1, and 2 octaves. Only one bandwidth was presented per session, and the same bandwidth was used until threshold values stabilized.
Derivation of auditory filter shapes and ERB estimation.
Auditory filter shapes were derived using a rounded exponential (roex) filter fitting function (using custom MATLAB software adapted from Glasberg and Moore, 1990). This procedure has been described in detail previously (Lina and Lauer, 2013). Briefly, the technique involves a minimization algorithm for calculating fitting parameters against the interpolated masked threshold data, which is determined by minimizing the root-mean-square error between the recorded threshold values and the filter-generated predicted values.
The power spectrum model of masking (Fletcher, 1940; Glasberg and Moore, 1990) is mathematically summarized as follows:
 where the masked threshold of a signal (Ps) is defined by the power spectrum of the noise (N(f)) and the weighted function of the signal (W(f)) in the frequency domain. The constant K is a scalar adjustment factor equal to the signal-to-masker ratio at the output of the filter required to achieve threshold. Previous psychoacoustic studies (Patterson, 1976) using noise with spectral notches have found that the shape of the auditory filter can be approximated by a roex(p,r) fit as follows:
 where p describes the filter skirt slopes and r flattens the filter at remote frequencies. The parameter g is the frequency deviation of the edge of the notch normalized by its center frequency (Δf/fc).
Equations 1 and 2 can be combined to yield Equation 3, which is analogous to Equation 1 converted into the power spectrum domain:
 Equation 3 is then used to compare masked thresholds to the optimized roex (p,r) filter output values. Masked thresholds and filter magnitudes are plotted in terms of the deviation at the near (lower) edge. Finally, using the resultant roex(p,r) filter parameters, the ERB of the auditory filter shape can be calculated according to the following:

Harmonic resolvability model.
The lowest f0 an auditory channel centered at fc can resolve is assumed equal to 1 ERB (Moore and Ohgushi, 1993; Moore, 2012). Thus, the highest resolved harmonic for this f0 can be estimated by the following equation:
 where fc is center frequency. Resolvability curves were cubic spline interpolated from the measured ERB (f0) points. Additionally, we used previously published neural frequency tuning data measured at each neuron's best sound level (Bartlett et al., 2011) to estimate the resolvability of A1 neurons in marmoset. For these neural data, we substituted the ERB term in Equation 5 with the frequency response bandwidth (calculated by Bartlett et al., 2011) to derive the highest resolved harmonic of marmoset A1 neurons.
Results
Experiment 1a: pitch discrimination
Animals were trained to discriminate one of two “targets” (2f0 COS or f0 ALT) from a repeating “background” (f0 COS) (see Materials and Methods). We assumed that, if marmosets rely on spectral cues to extract pitch, they would respond to the 2f0 COS target but not the f0 ALT target. However, if they rely on temporal envelope cues, they would respond to both targets. Animals were tested using three stimulus sets: first nine harmonics present (H1-H9), a missing f0 set containing the fourth through 12th harmonics of a common f0 (H4-H12), and first four harmonics present (H1-H4). Set H4-H12 was presented with a 3-octave-wide band of noise (10 dB signal-to-noise ratio) centered at f0 to minimize potential harmonic distortion effects at the level of the cochlea. In all three stimulus sets, background sounds had f0 values of 150, 300, 450, 600, and 900 Hz (2f0 COS targets had f0 values ranging from 300 to 1800 Hz).
Performance for ALT targets was highly dependent on f0 in both H1-H9 and H4-H12 conditions, but not so for 2f0 COS targets (Fig. 2A,B). We quantified performance in terms of d′ (see Materials and Methods) and found a significant decrease in discriminability for ALT stimuli as f0 increased (H1-H9, F(4,12) = 12.59, p < 0.001; H4-H12, F(4,12) = 33.29, p < 0.001) (Fig. 2A,B, top). Performance for ALT and COS targets was indistinguishable at 150 Hz (H1-H9, t(3) = −1.09, p = 0.36, corrected; H4-H12, t(3) = −2.74, p = 0.071, corrected), but significantly different at 900 Hz (H1-H9, t(3) = −16.86, p < 0.001, corrected; H4-H12, 900 Hz: t(3) = −17.25, p < 0.001, corrected). Subjects required significantly more time to respond to ALT targets as f0 increased (H1-H9, F(4,12) = 6.82, p < 0.01; H4-H12, F(4,12) = 10.42, p = 0.001) (Fig. 2A,B, bottom). However, discrimination was impaired across all five f0 values in the H1-H4 condition, suggesting that subjects could not make discriminations based on temporal envelope cues in these stimuli (150 Hz, t(3) = −7.97, p < 0.01, corrected; 300 Hz, t(3) = −6.67, p < 0.01, corrected; 450 Hz, t(3) = −18.18, p < 0.01, corrected; 600 Hz, t(3) = −42.63, p < 0.01, corrected; 900 Hz, t(3) = −5.34, p < 0.05, corrected) (Fig. 2C). Overall, these results suggest that marmosets are sensitive to temporal envelope cues at f0 values <450 Hz but rely more strongly on spectral cues for f0 values >450 Hz, and that the first four harmonics of these complex tones are probably resolved.

Evidence for two mechanisms of pitch processing. A, B, Marmosets were trained to discriminate f0 ALT (red lines) and 2f0 COS (blue lines) tone targets from an f0 COS background. Stimuli were 9-component harmonic complex tones in which either the first nine harmonics were present (A) or the first three harmonics were removed (B). Top panels, Results plotted as both proportion correct (dashed lines) and d′ (solid lines). Envelope repetition rate was used to correctly identify ALT phase stimuli at low, but not high, f0 values. Bottom panels, Animals require more time to respond to ALT stimuli at higher f0 values. C, Temporal envelope cues could not be used to reliably discriminate 4-component ALT stimuli (H1-H4) at any f0 tested, as measured by both proportion correct and d′ (top). Response latencies were also increased for ALT compared with COS stimuli (bottom). Error bars indicate SEM in all plots.
Experiment 1b: the role of harmonic order on temporal pitch processing
We further examined the influence of stimulus resolvability on temporal envelope processing by testing discrimination of complex tones with harmonics confined to one of three spectral regions: low (H1-H4), medium (H5-H8), or high (H9-H12). Stimuli in the medium and high conditions were presented with a 3 octave noise band centered at f0. Only f0 values of 150 Hz and 900 Hz were used. If all harmonics are resolved, performance should be dependent on spectral cues alone and marmosets should respond only to COS (not ALT) stimuli. If all harmonics are unresolved, or if there is a mixture of resolved and unresolved harmonics (which produces an ambiguous pitch in human listeners) (Shackleton and Carlyon, 1994), temporal envelope cues should cause marmosets to respond to both targets.
Discriminability of ALT targets was highly dependent on spectral region at 150 Hz (F(2,6) = 24.23, p < 0.01), but not at 900 Hz (F(2,6) = 1.01, p = 0.42) (Fig. 3A,B, top). At 150 Hz, d′ values for ALT targets were significantly lower than COS targets in both low (t(3) = −7.79, p < 0.01, corrected) and medium (t(3) = −5.65, p < 0.05, corrected), but not high (t(3) = −2.08, p = 0.129, corrected), conditions, and response latency decreased as spectral region increased (F(2,6) = 0.777, p < 0.05) (Fig. 3A, bottom). d′ values for ALT stimuli at 900 Hz were significantly different from COS stimuli at all f0 values (low, t(3) = −6.24, p < 0.01, corrected; medium, t(3) = −8.56, p < 0.01, corrected; high, t(3) = −4.95, p < 0.05, corrected) (Fig. 3B, top). These data suggest that at 150 Hz, but not 900 Hz, harmonics are probably unresolved above ∼fifth.

Role of resolvability in pitch discrimination. A, B, The role of resolved versus unresolved harmonics was tested using 4-component harmonic complexes with f0 values of 150 Hz (A) or 900 Hz (B) at three different spectral regions. Performance was assessed using proportion correct and d′ (top panels) and response latency (bottom panels). Discrimination performance improved, and latency decreased, for ALT phase stimuli as spectral region increased for 150 Hz, but not 900 Hz, stimuli. C, Stimulus reversal task requiring discrimination of f0 ALT and f0 COS targets from a 2 f0 COS background. Stimuli were the same as in Figure 2A. Proportion correct (top), d′ (center), and response latency (bottom) were the same for both ALT and COS phase complexes for both H1-H9 and H4-H12 stimulus sets, suggesting that marmosets hear these stimuli as distinct percepts. Error bars indicate SEM in all plots.
Experiment 1c: background-target stimulus reversal
Experiment 1a showed that discrimination performance for f0 ALT and 2f0 COS targets is the same at 150 Hz for both H1-H9 and H4-H12 conditions (Fig. 2A,B, top), but it is unclear whether these stimuli are perceptually equivalent. We changed the background-target relationships so that a correct response required discriminating f0 ALT and f0 COS targets from a 2f0 COS background. Animals thus had to report on an octave decrease. If f0 ALT and 2f0 COS stimuli are perceptually indistinguishable, then subjects should not respond to f0 ALT targets. Results show that, for both H1-H9 and H4-H12 stimuli, marmosets were able to easily discriminate both target types with equal latency (hit rate: H1-H9, t(3) = 0.54, p = 0.628; H4-H12, t(3) = 0.88, p = 0.442; d′: H1-H9, t(3) = 0.74, p = 0.516; H4-H12, t(3) = 0.88, p = 0.444; response latency: H1-H9, t(3) = 0.059, p = 0.957; H4-H12, t(3) = −0.721, p = 0.523) (Fig. 3C).
Experiment 2a: psychophysical estimates of frequency selectivity
Results of Experiment 1 suggest that frequency resolution in the auditory periphery primarily determines whether a spectral or temporal mechanism is used to extract pitch. We estimated frequency resolution by measuring ERBs using notched noise procedures (see Materials and Methods). Previous work has shown that auditory filter shapes can be approximated by applying roex filter fits to notched noise data (Glasberg and Moore, 1990). The ERB transforms this filter into a rectangular shape with the same peak and total transmission. We tested four tone frequencies (500, 1000, 7000, and 16,000 Hz) drawn from across the marmoset hearing range (Osmanski and Wang, 2011).
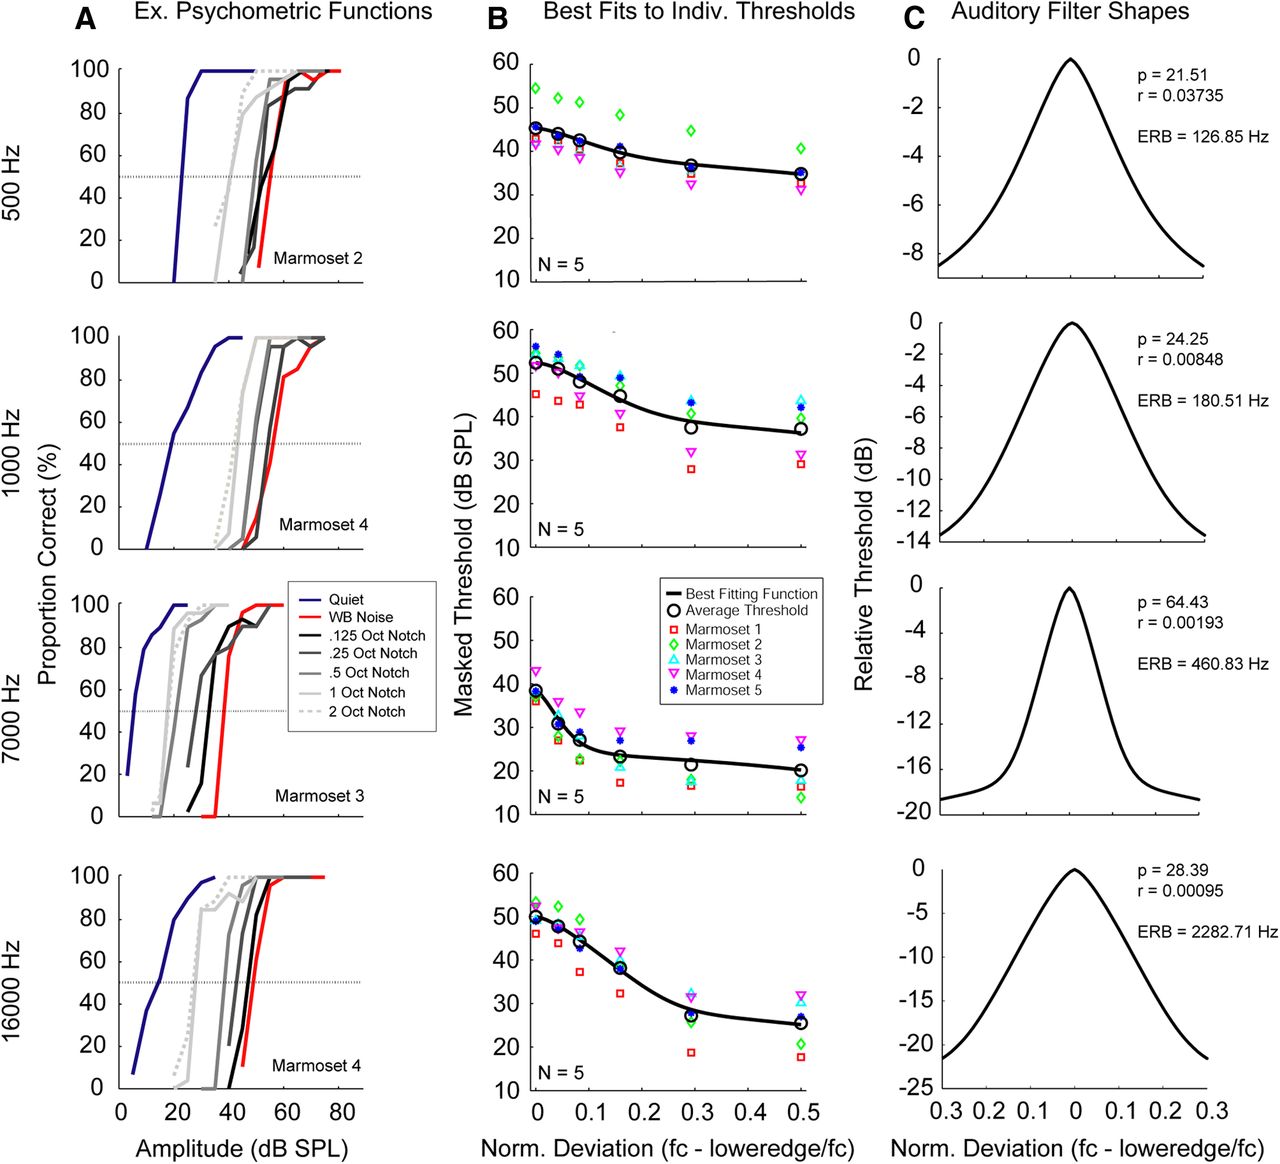
Psychometric functions were measured in seven conditions (quiet, broadband noise, and five different spectral notch widths). Examples of individual psychometric functions are shown in Figure 4A. Thresholds compared favorably with previously measured audiograms for this species (Osmanski and Wang, 2011). Masking effects are indicated by a rightward shift in the psychometric functions measured in noise relative to quiet. The largest shift is seen for broadband noise, and adding spectral notches reduced the magnitude of this shift. Individual thresholds for each notch width were averaged to derive the input to the roex function (see Materials and Methods). These thresholds, along with the best fitting function to the masked threshold data, are shown in Figure 4B. Filter parameters obtained from the fitting algorithm were used to derive the filter shapes, which were then converted into ERBs (Fig. 4C).

ERB estimation. A, Summary psychometric functions for each of the four tone frequencies in seven conditions (quiet, broadband noise, and five bandwidths of notched noise). Representative performance from example subjects is plotted as the proportion of correct responses as a function of tone amplitude. Threshold = 50% correct. B, Effects of notched noise bandwidth on detection thresholds for all five subjects (colored symbols) for each tone frequency. The best fitting function is shown (solid black line) fitted to the average of each deviation (black open circles). C, Estimated roex(p,r) filter functions plotted against the interpolated average notched-noise thresholds across all five subjects.
Psychophysical measures of frequency selectivity using notched noise data have been described for only a few species, and these data are shown in Figure 5 (mouse, May et al., 2006; chinchilla, Niemiec et al., 1992; guinea pig, Evans et al., 1992). ERBs are typically between 10% and 20% of center frequency across species. Those measured in the current experiment vary from 6.6% (7 kHz) - 25.4% (0.5 kHz) (Fig. 5). Marmoset ERBs tend to be wider than those measured in humans, except at 7000 Hz, where bandwidths were narrower than those of the other four species.

Comparison of ERBs across species. Marmoset ERBs were generally similar to other mammalian ERBs measured using notched-noise procedures. Marmosets show wider ERBs compared with humans, except at 7000 Hz, which is the frequency of best hearing in these animals. Error bars indicate SD.
Experiment 2b: modeling harmonic resolvability
Our ERB estimates were used to model harmonic resolvability in marmosets. The highest resolved harmonic of a complex tone is approximately equal to the center frequency of the auditory filter divided by its ERB (see Materials and Methods). We compare resolvability for marmosets and humans in Figure 6A. The first five to nine harmonics of a complex tone are consistently resolved in humans (Plomp, 1964; Glasberg and Moore, 1990). In marmosets, however, the first four or five harmonics are resolved at an f0 of 150 Hz, and this number increases to the first 14–16 harmonics between 600 and 800 Hz (Fig. 6A) before decreasing again at higher f0 values. These values show a remarkable correspondence to our pitch discrimination data, where temporal cues could be reliably used to discriminate complex tones at 150 Hz f0 (but only when stimuli contained harmonics > fifth), and this ability decreased as f0 increased (up to 900 Hz, presumably as the stimuli became entirely composed of fully resolved harmonics).

Model of harmonic resolvability. A, Resolvability boundaries for both marmosets (solid black line) and humans (dashed black line) derived from psychophysical ERB estimates. Harmonics falling to the left of each boundary are fully resolved, whereas harmonics falling to the right are unresolved or partially resolved. Compared with humans, marmosets have poorer spectral resolution ∼<300 Hz. Marmosets can fully resolve up to 12 harmonics at 400 Hz, a result that matches results from Experiment 1 where temporal envelope cues were no longer salient for H1–H9 or H4–H12 stimuli ∼>450 Hz. B, Comparison of harmonic resolvability for marmosets using both behavioral data and tuning bandwidths of neurons recorded from A1. Psychophysical curves form a lower envelope for resolvability estimates derived from neural tuning bandwidths.
Previous work has shown agreement between ERBs measured psychophysically and those derived from the tuning bandwidths of cortical neurons (Evans et al., 1992; Fishman and Steinschneider, 2006; Bitterman et al., 2008). We estimated the harmonic resolvability of marmoset A1 neurons based on previously measured cortical tuning bandwidths in this species (Bartlett et al., 2011) and show that these data show a qualitative agreement with our psychophysical estimates (Fig. 6B). Behavioral thresholds, which presumably reflect spectral resolvability in the auditory periphery, generally describe a lower resolvability boundary for these cortical neurons. This relationship is consistent with the idea that a sensory threshold is determined by the most sensitive neurons contributing to a given behavior (Parker and Newsome, 1998). The overall poorer spectral resolvability measured across neurons in cortex compared with psychophysical thresholds is likely the result of information being increasingly integrated at successive processing stages of the auditory system.
Discussion
We trained common marmosets to discriminate complex harmonic tones differing in their phase relationships to disentangle the relative use of temporal envelope and spectral cues in extracting pitch from complex sounds. Our results suggest that marmosets are sensitive to both cues and that the primary determinants of which mechanism is used for pitch extraction are f0 and harmonic order. Specifically, marmosets were able to use changes in the envelope repetition rate of these sounds to extract pitch when stimuli contained low f0 values and high harmonic orders, whereas spectral information was used for higher f0 values with low harmonic orders. In a second experiment, we estimated auditory filter ERBs using notched noise techniques. Results show that marmoset ERBs are generally comparable to other mammalian species. Marmosets had wider ERBs compared with humans, except at 7000 Hz, which is approximately the frequency of best hearing in this species and also the frequency where most of the spectral energy in marmoset vocalizations is concentrated (Osmanski and Wang, 2011).
These behavioral results can be summarized by our model of harmonic resolvability (Fig. 6A), which shows that frequency resolution in marmosets is strongly dependent on both f0 and harmonic number. Only the first four harmonics are resolved at low f0 values (∼150 Hz), whereas this number grows to include the first 12–16 harmonics at higher f0 values (∼400–1000 Hz). These model data match our pitch results from Experiment 1, where temporal envelope cues dominate performance at f0 values ∼<450 Hz when stimuli contain harmonic numbers ∼>5.
The influence of f0 on pitch perception in marmosets is qualitatively similar to humans, where spectral cues dominate at f0 values ∼>100 Hz and sensitivity to temporal envelope cues becomes important only at very low f0 values <100 Hz (Flanagan and Guttman, 1960a,b). Quantitatively, however, our results suggest that marmosets and humans will perceive different pitches across a range of acoustic stimuli in which temporal envelope and spectral cues indicate different fundamental frequencies. For example, our data suggest that, for an ALT phase stimulus with an f0 = 150 Hz and containing harmonics 5–8, marmosets will hear either an ambiguous pitch or a pitch one octave above the f0 (extracted from temporal envelope cues), whereas humans will hear a pitch equal to the f0 (extracted from spectral cues) (Shackleton and Carlyon, 1994).
Marmoset sensitivity to envelope repetition rate at f0 values higher that those reported in humans (450 Hz vs 100 Hz) likely results from the fact that the marmoset cochlea is less than half that of the human (Johnson et al., 2012), even though the two species have similar ranges of hearing (Osmanski and Wang, 2011). This anatomical difference likely puts large restrictions on how sounds are represented centrally. In other words, marmoset auditory filter bandwidths might be expected to be wider, at least at certain frequencies, to reflect the fact that there is limited peripheral space on which to encode those frequencies. Heightened sensitivity to temporal envelope cues (as seen in Experiment 1) may then be the result of poorer spectral resolving power due to wider filter bandwidths compared with humans (Shera et al., 2002). Differences in the size of human and marmoset auditory filters, and thus differences in spectral resolution, may reflect a series of tradeoffs between basilar membrane length, hearing range, and the need to process species-specific communication signals centered in a particular range of frequencies (∼7000 Hz). Smaller cochleae may also limit spectral resolvability in other animals relative to humans, measured as increased pitch discrimination thresholds (Shofner, 2002; Kalluri et al., 2008; see, for example, Walker et al., 2009; Klinge et al., 2010; Shofner and Chaney, 2012), and wider ERBs (Evans et al., 1992; Niemiec et al., 1992; May et al., 2006).
Our ERB estimates compare favorably with previous human data using simultaneous masking paradigms (e.g., Patterson, 1976). However, much sharper estimates of auditory filter tuning widths have been described in humans using a variant of the notched noise technique in which brief, near-threshold signals were presented in a forward masking paradigm (Shera et al., 2002; Oxenham and Shera, 2003). These results show that ERBs are substantially narrower in forward, compared with simultaneous, masking conditions and are thought to provide more accurate estimates of tuning at low levels. Auditory filter bandwidths are known to widen with increasing level (Moore and Glasberg, 1987), and our choice of a simultaneous masking paradigm at relatively high levels (∼35 dB) was based on the fact that our pitch task was designed to examine mechanisms of pitch perception, previously studied in humans, which operate well above threshold levels (average stimulus level was 70 dB SPL). Calculating ERBs at lower levels would potentially limit meaningful comparisons between our tuning estimates and our pitch results.
In human pitch matching experiments, subjects report a pitch intermediate between an f0 and 2f0 COS stimulus when both resolved and unresolved harmonics are present in an f0 ALT stimulus (Shackleton and Carlyon, 1994). Our results suggest that the same holds true for marmosets because they easily discriminate f0 ALT from both f0 (Experiment 1a) and 2f0 (Experiment 1c) COS stimuli. It is important to keep in mind, however, that subjects were trained to respond to any acoustic change in these experiments, and presentation of ALT stimuli is accompanied by a change in spectrum in Experiment 1c. Thus, timbre, and not pitch, could have formed the basis for discrimination. Ultimately, questions about stimulus similarity and perceptual grouping can only be properly answered using a more complex categorization or matching task in which stimuli are judged based on perceived similarity.
Finally, although we argue that marmosets are sensitive to spectral cues in these experiments, it is important to note that we cannot separate a spectral processing scheme in our experiments from a complementary scheme using temporal fine structure information (see, for example, Oxenham et al., 2004; Shofner and Campbell, 2012). For instance, similar predictions have been obtained whether one uses a harmonic template-based mechanism or one based on the waveform autocorrelation function (Cariani and Delgutte, 1996a,b; Meddis and O'Mard, 1997). In addition to temporal fine structure cues, marmosets could potentially be using other kinds of spectral cues to make pitch judgments for COS stimuli, including changes in the position of the highest harmonic. Further work will be required to tease apart these possible alternatives to determine whether marmosets are truly sensitive to spectral mechanisms of pitch extraction.
In conclusion, these behavioral data support a dual pitch processing mechanism whereby both harmonic templates (spectral) and envelope extraction (temporal) are used to compute pitch depending on the resolvability of the stimulus spectrum. Although previous work has shown that primates are able to use pitch cues to make judgments about sound (May et al., 1989; Wright et al., 2000; Izumi, 2001; Brosch et al., 2004), we think that these data represent the first rigorous psychophysical tests of pitch perception in nonhuman primates that begin to address questions of underlying mechanism. Marmosets, an emerging model system in auditory neuroscience with a large vocal repertoire and an easily accessible auditory cortex (Wang, 2000, 2007), are an ideal species for questions of this kind. Teasing apart the various mechanisms that give rise to pitch perception in marmosets will provide valuable comparative data, which will advance our understanding of how the auditory system works to create a unified pitch percept in different animal species, including humans.
Footnotes
- Received January 7, 2013.
- Revision received April 12, 2013.
- Accepted April 19, 2013.
This work was supported by the National Institutes of Health Grant DC 03180 to X.W. and Grant T32 DC000023. We thank J. Estes and N. Sotuyo for assistance with animal care; C. Cummings, R. Desideri, J. Howard, M. Maguire, and E. Nagourney for help running the behavior experiments; I. Lina for work on the analysis software for roex filter fits and ERB derivation; V. Sadagopan for calculating neural frequency tuning bandwidths to fit our resolvability model; and D. Bendor and I. Lina for providing valuable comments on an earlier draft of this manuscript.
The authors declare no competing financial interests.
- Correspondence should be addressed to either Dr. Michael S. Osmanski or Dr. Xiaoqin Wang, Laboratory of Auditory Neurophysiology, Department of Biomedical Engineering, Johns Hopkins University School of Medicine, 720 Rutland Avenue, Traylor 410, Baltimore, MD 21205. michael.osmanski{at}jhu.edu or xiaoqin.wang{at}jhu.edu
- Copyright © 2013 the authors 0270-6474/13/339161-08$15.00/0