
Abstract
The caudate nucleus is a part of the visual corticostriatal loop (VCSL), receiving input from different visual areas and projecting back to the same cortical areas via globus pallidus, substantia nigra, and thalamus. Despite perceptual and navigation impairments in patients with VCSL disruption due to caudate atrophy (e.g., Huntington's disease, HD), the relevance of the caudate nucleus and VCSL on cortical visual processing is not fully understood. In a series of fMRI experiments, we found that the caudate showed a stronger functional connection to parahippocampal place area (PPA) compared with adjacent regions (e.g., fusiform face area, FFA) within the temporal visual cortex. Consistent with this functional link, the caudate showed a higher response to scenes compared with faces, similar to the PPA. Testing the impact of VCSL disruption on neural processes within PPA, HD patients showed reduced scene-selective activity within PPA compared with healthy matched controls. In contrast, the level of selective activity in adjacent cortical and subcortical face-selective areas (i.e., FFA and amygdala) remained intact. These results show some of the first evidence for the direct impact and potential clinical significance of VCSL on the generation of “selective” activity within PPA.
SIGNIFICANCE STATEMENT Visual perception is often considered the product of a multistage feedforward neural processing between visual cortical areas, ignoring the likely impact of corticosubcortical loops on this process. Here, we provide evidence for the contribution of visual corticostriatal loop and the caudate nucleus on generating selective response within parahippocampal place area (PPA). Our results show that disruption of this loop in Huntington's disease patients reduces the level of selective activity within PPA, which may lead to related perceptual impairments in these patients.
- caudate
- Huntington's disease
- PPA
- scene and shape perception
- visual categorization
Introduction
Studies in nonhuman primates (NHPs) have shown that the striatum receives projections from the temporal visual cortex. These projections innervate the caudate and posterior portions of the putamen (Yeterian and Pandya, 1995; Middleton and Strick, 1996; Cheng et al., 1997), two major nuclei of the striatum. Outputs from these striatal nuclei enter the globus pallidus, substantia nigra, thalamus, and finally project back to the same cortical areas, generating a closed recurrent loop known as the visual corticostriatal loop (VCSL) (Middleton and Strick, 1996; Seger, 2013). Computational models have suggested that this loop helps generate selective responses in cortical regions by strengthening (or weakening) the thalamic input to these areas (Lee et al., 2012; Seger, 2013). However, to our knowledge, no previous study has shown a direct link between this loop and functional selectivity of temporal visual cortex.
Temporal visual cortex in humans and NHPs is a heterogeneous area consisting of distinct subregions involved in face (Kanwisher et al., 1997; Rajimehr et al., 2009), scene (Epstein and Kanwisher, 1998; Kornblith et al., 2013), and object/shape (Denys et al., 2004; Bell et al., 2011) processing (for review, see Vanduffel et al., 2014). Previous functional connectivity studies in humans (Postuma and Dagher, 2006; Di Martino et al., 2008; Robinson et al., 2012; Stillman et al., 2013; Porter et al., 2015) have shown functional connections between the caudate and the temporal visual cortex. However, selectivity of this functional connection and its impact on the cortical visual processing have remained mostly unknown. In the first part of this study, we mapped the functional connection of the caudate to different subregions of the temporal cortex and tested whether all visual temporal areas show the same level of functional connection to the caudate.
In the following experiment, we tested the impact of this functional connectivity on the neural processing within the caudate. We hypothesized that, if a specific subregion of the temporal cortex was functionally linked to the caudate, then the caudate would show a similar stimulus selectivity to that subregion. Consistent with this hypothesis, previous studies in NHPs have shown that the patterns of visually driven response in the caudate resemble those of inferotemporal neurons (Caan et al., 1984; Brown et al., 1995; Hikosaka et al., 1998; Watanabe and Munoz, 2013). However, in contrast to adjacent areas such as nucleus accumbens and amygdala (Williams et al., 1993; Breiter et al., 1996; Fried et al., 1997), response selectivity of the caudate has never been tested systematically (Peterson and Seger, 2013). Therefore, the second goal here was to examine caudate stimulus selectivity in relation to its functional connections to the temporal cortex.
A third goal was to examine the activity within visual areas in cases where VCSL is disrupted, specifically in Huntington's disease (HD). HD is characterized by an early and profound degeneration of the striatum (Vonsattel et al., 1985; Aylward et al., 2004; Bohanna et al., 2008). Although cognitive deficits in learning, memory, and attention control have been described previously in HD (Lawrence et al., 1998; Seger, 2013), very few studies have examined visual impairments in HD patients. Those studies have identified deficits in tasks that require complex visual integration (Jacobs et al., 1995; Gomez-Tortosa et al., 1996; Lawrence et al., 2000; Wolf et al., 2014), but the underlying nature of the deficits was not fully explored (Wolf et al., 2014).
By measuring the fMRI response in human subjects, we found that the caudate showed a selective functional connection to the parahippocampal place area (PPA), an area involved in scene and shape encoding (Epstein and Kanwisher, 1998; Nasr et al., 2014; Troiani et al., 2014). The caudate response (like PPA) was also biased for scenes compared with faces, supporting the hypothesis that caudate response is dominated by its input from PPA. Moreover, in HD patients with caudate atrophy, we found a profoundly diminished scene selectivity in PPA and also impaired scene and shape perception.
Materials and Methods
Participants
Experiment 1.
Thirty (15 female) healthy volunteers between 21 and 40 years of age (29.33 ± 5.07 mean ± SD) participated in this study.
Experiment 2.
Forty-three (25 female) healthy volunteers, including the 30 subjects who participated in Experiment 1, between 21 and 40 years of age (29.53 ± 4.75) participated in this study.
Experiment 3.
Eighteen HD patients (seven female) and 18 healthy matched controls (12 female) other than those who participated in Experiments 1 and 2 participated in this experiment. Two patients (one female) could not stay in the scanner long enough to finish the tests and were therefore excluded. Sixteen remaining patients and 18 matched healthy controls between 29 and 68 (54.93 ± 9.62) and 32 and 68 (49.10 ± 11.27) years of age, respectively, participated in the study. An application of one-way ANOVA did not show any significant age difference between the two groups (F(1,33) = 2.60, p = 0.12).
Experiment 4.
Twelve HD patients (7 female) and 12 healthy matched controls (7 female) participated in the behavioral tests. Among them, two patients (one female) and six controls (three females) had participated in Experiment 3. Patients and their matched healthy controls had an age range of 25–68 (50.8 ± 13.43) and 27–75 (50.6 ± 14.13), respectively. Application of a one-way ANOVA did not show any significant difference between the age range of the two groups (F(1,23) = 0.87, p = 0.97).
Patients who participated in Experiments 3–4 were all in the early stages of HD (Shoulson stages 1 and 2) and had a genetically confirmed CAG repeat expansion (≥40) in the HTT gene. None of the HD patients had any current or lifetime mental disorder or presented with a history of other neurological disease or a history of head trauma. Fourteen patients were not taking any medications, eight patients were taking serotonin reuptake inhibitors, and four were taking both serotonin reuptake inhibitors and neuroleptics. Healthy controls who participated in Experiments 3–4 were often patients' spouses or care-givers. Control subjects were also matched for their level of education compared with HD patients.
All subjects had normal or corrected-to-normal visual acuity. Healthy controls had radiologically normal appearing brains without any history of neuropsychological disorder. All experimental procedures conformed to National Institutes of Health guidelines and were approved by the Massachusetts General Hospital review board. Written informed consent was obtained from all subjects before the experiments.
Imaging
Functional and structural imaging scans were conducted in a 3T Siemens scanner (Tim Trio) using the vendor-supplied 32-channel receive coil array. Resting-state data (Experiment 1) were acquired using single-shot gradient-echo EPI with isotropic voxels of nominally 3.0 mm resolution using the following protocol parameters: TR = 3000 ms, TE = 30 ms, flip angle = 85°, matrix = 72 × 72, BW = 2240 Hz/pix, echo-spacing = 0.51 ms, no partial Fourier, voxel size = 3 × 3 × 3 mm3, FOV = 216 × 216 mm, 47 axial slices covering the entire brain, and no acceleration.
Stimulus-driven functional data (Experiments 2 and 3) were acquired using an EPI protocol with the following parameters: TR = 2000 ms, TE = 30 ms, flip angle = 90°, matrix = 64 × 64, BW = 2298 Hz/pix, echo-spacing = 0.5 ms, no partial Fourier, voxel size = 3 × 3 × 3 mm3, FOV = 192 × 192 mm, 33 axial slices covering the entire brain, and no acceleration.
For all subjects, structural (anatomical) data were acquired using a high-resolution 3D T1-weighted MPRAGE sequence with the following protocol parameter values: TR = 2530 ms, TE = 3.39 ms, TI = 1100 ms, flip angle = 7°, BW = 200 Hz/pix, echo spacing = 8.2 ms, voxel size = 1.0 × 1.0 × 1.33 mm3, FOV = 256 × 256 × 170 mm3.
Stimuli and procedure
Experiment 1.
During the resting-state scans, subjects were required to close their eyes and stay still for the duration of the scan (372 s), during which 124 functional volumes were collected.
Experiment 2.
Stimuli were presented via an LCD projector (1024 × 768 pixels resolution, 60 Hz refresh rate) onto a rear projection screen viewed through a mirror mounted on the receive coil array. Matlab 2013a (The MathWorks) (RRID:SCR_001622) and the Psychophysics Toolbox (Brainard, 1997; Pelli, 1997) (RRID:SCR_002881) were used to control stimulus presentation.
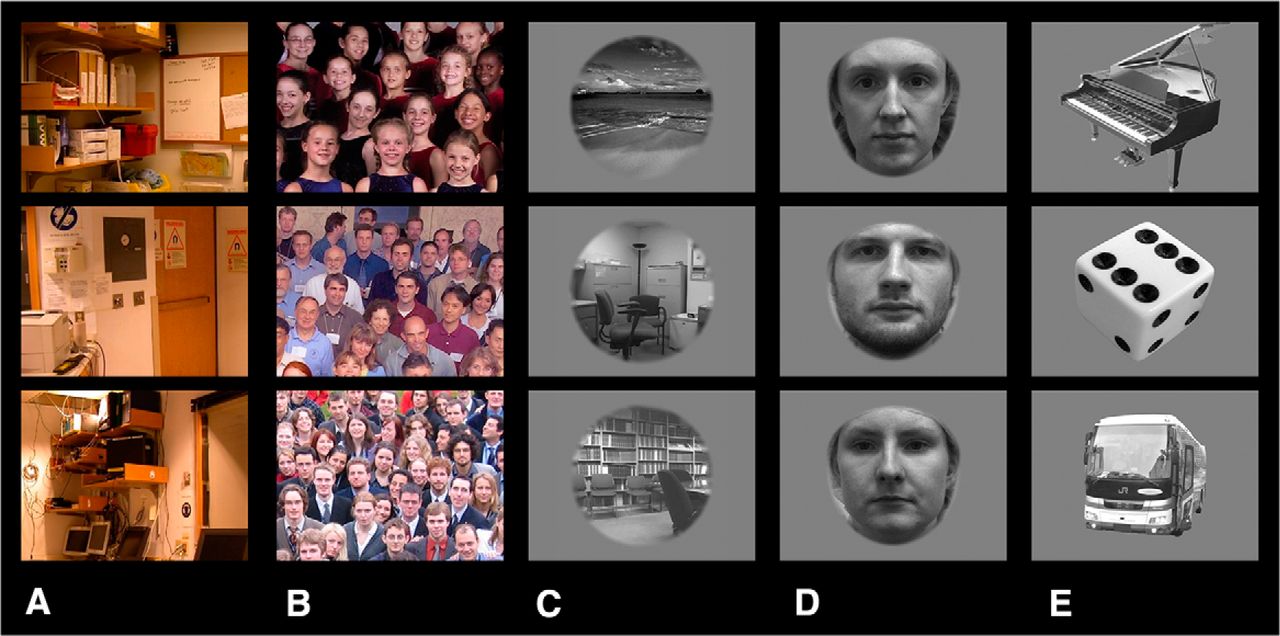
Stimuli were retinotopically matched (20° × 27° of visual angle) images of eight real-world (colorful) scenes (familiar images of the scanner room and waiting area) and eight face groups (Fig. 1A,B). The same set of images was used previously to localize scene-selective and face-selective areas in normal human subjects (Rajimehr et al., 2009; Nasr et al., 2011). These scene and face images were presented within different blocks. Each block lasted 16 s, during which different stimuli were presented for 1 s each. Each run consisted of 10 blocks of stimulus presentation and began and ended with 32 s of blank presentation. Throughout each run, subjects were required to fixate on a small fixation spot (0.3° × 0.3° of visual angle) presented at the center of the screen. To control the subjects' level of attention during the scans, they were required to report changes in the color of the fixation spot (red to blue or vice versa) by pressing a key on a keypad. Each subject completed eight runs, during which 896 functional volumes were collected.

Sample of stimuli used in Experiments 2 and 3. In Experiment 2, subjects were presented with retinotopically matched images of scenes (A) and group faces (B). In Experiment 3, subjects viewed images of scenes (C), faces (D), and single objects (E). All images were presented centrally on screen. A fixation point was also presented at the center of all images (see Materials and Methods).
Experiment 3.
The stimulus presentation procedure was similar to Experiment 2. Stimuli were independent of those presented in Experiment 2: gray-scaled images of 32 unfamiliar scenes (Fig. 1C), 32 unfamiliar faces (Fig. 1D), and 32 single objects including furniture, tools, fruits, and vehicles (Fig. 1E). All images were presented within a circular aperture (radius = 10° of visual angle) against a gray background. Scene, face, and object stimuli were presented during separate blocks. Each experiment block lasted 16 s, during which different stimuli were presented at 1 s each. Each run consisted of nine blocks of stimulus presentation and started and ended with 16 s of blank presentation. Each subject participated in 12 runs, during which 1056 functional volumes were collected. Other details were as in Experiment 2.
Experiment 4.
This experiment was conducted outside the scanner, in an isolated room prepared for behavioral tests. Stimuli were presented via an LCD screen (1024 × 768 pixels resolution, 60 Hz refresh rate). Matlab 2014a (The MathWorks) (RRID:SCR_001622) and the Psychophysics Toolbox (Brainard, 1997; Pelli, 1997) (RRID:SCR_002881) were used to control stimulus presentation.
House discrimination test.
Stimuli were computer generated house images (Google-Sketchpad Software; Fig. 2) similar to those used earlier to study neural correlated of scene recognition (Nasr and Tootell, 2012b). All houses were based on a common 3D template, differing from each other in the size and/or location of architectural features (e.g., windows, door, and stairs). All images were achromatic and presented at the center of the screen against a spatially uniform gray background. Each image subtended 10° (average of horizontal and vertical extent). For each individual house, images were generated and presented in three views: frontal and rotated ±45° to the left or right. The level of similarity between house images were adjusted according to a previous study (Nasr and Tootell, 2012b) so that control subjects were expected to discriminate them from each other with 75% accuracy.

Computer generated houses used in one-back house discrimination test (see also Nasr and Tootell, 2012b). House images were presented at either frontal or oblique views for 2 s with a 4 s blank interval between the stimuli. During the experiment, a green fixation point remained visible at the center of screen. Subjects had to report whether each image was different from the preceding one (i.e., a two-alternative forced choice).
During the experiment, each house image was presented for 2 s with 4 s blank interval after each images. Houses were always presented from two different viewpoints in each of two consecutive trials (Fig. 2). Subjects were asked to perform a one-back house discrimination task while fixating on a small, centrally located fixation spot (0.3° × 0.3° of visual angle). Subjects were asked to report whether consecutively presented house images were drawn from a common house or from two different houses (i.e., a two-alternative forced choice) regardless of their viewing angles. Subjects reported their answers by pressing either of two keys on a keypad without receiving any feedback about their response accuracy. Each subject participated in 60 trials with a 30 s break between them. Accuracy was stressed rather than speed. Before the test, all subjects were allowed to inspect each individual house to become familiar with them and then practiced with the task and stimuli (>10 trials), during which time they received feedback about their response accuracy. The tests started only when subjects felt confident about the task.
Shape and spatial comparison test.
Stimuli were two colored, semitranslucent objects (one red and the other blue) that were presented simultaneously in randomized locations against a white noise background (20° × 20° of visual angle; Fig. 3). Object shape (either square or triangle) varied randomly from trial to trial and object size was scaled according to its eccentricity and cortical magnification factor (range = 0.33–0.57° of visual angle). In each trial, objects were presented simultaneously for 100 ms at the beginning of each trial. This short presentation discouraged saccadic eye movements. The white noise background remained constant throughout the trial interval (1500 ms for controls and 3000 ms for HD patients). Using extended trial intervals assured us that any difference in performance between HD patients and healthy controls was not due to the slower reaction time in HD patients compared with controls.

Schematic representation of shape and spatial comparison trials (also see Nasr et al., 2013). Target objects were presented for 100 ms on screen with 1500 and 3000 ms intertrials interval for controls and HD patients, respectively. To facilitate eye fixation, a green fixation point remained visible at the center of screen during the experiment. During spatial comparison trials, subjects had to report whether the colorful target objects were on the same side of screen regardless of their shapes. During the shape comparison trials, subjects had to report whether target objects had the same shape (i.e., a two-alternative forced choice) regardless of their size and/or location on screen.
During each trial, subjects were asked to fixate a small fixation spot (0.3° × 0.3° of visual angle) presented at the center of the screen. During the spatial comparison trials, subjects reported whether the two objects were presented on the same or opposite sides of the screen in a two-alternative forced choice. During the shape comparison trials, subjects reported whether objects were the same or different, by pressing either of two keys on a keypad without feedback about performance accuracy. Each subject participated in 40 trials for each task. During these trials, response accuracy (i.e., number of correct responses relative to the total number of responses) was adjusted for each individual subject to 75% by manipulating object transparency level using a staircase method (Nasr et al., 2013). In both tasks, accuracy was stressed rather than speed. Shape and spatial comparison tests were conducted separately with a 5 min break between them. The sequences of the tasks were counterbalanced between subjects. Subjects practiced with the tasks and stimuli for at least 5 min before the tests. During these practice trials, subjects received feedback about their response accuracy. Data acquisition started only when subjects felt confident and could respond correctly to four sample trials.
Imaging data processing
Anatomical and functional data were processed using FreeSurfer and FS-FAST (version 5.3; http://surfer.nmr.mgh.harvard.edu/; RRID:SCR_001847; Fischl, 2012).
Anatomical data.
For each subject, inflated and flattened cortical surfaces were reconstructed based on the high-resolution anatomical data (Dale et al., 1999; Fischl et al., 1999; Fischl et al., 2002). For all subjects, subcortical regions of interest including caudate, putamen, pallidum, thalamus, ventral diencephalon, and amygdala were localized based on individual high-resolution anatomical scans and the cytoarchitectonic structure of each nucleus (Fischl et al., 2002).
For each subject, the cortical thickness was also measured by defining the gray–white matter interface and the surface of the gray matter based on the high-resolution structural scans (Dale et al., 1999; Fischl et al., 1999; Fischl et al., 2002). Maps of between-group cortical thinning (patients vs healthy matched controls) were calculated by correcting for multiple comparisons.
Resting-state functional data.
Functional images were motion corrected and spatially smoothed (3 mm half-width at half-maximum, HWHM). Functional data were rigidly aligned (6 degrees of freedom, DOF) relative to an independently generated averaged brain template (fsaverage, Freesurfer) using boundary-based registration (Greve and Fischl, 2009). Sources of variance of noninterest were removed, as described previously (Nir et al., 2006; Stevens et al., 2010; Nasr et al., 2013; 2015), except as noted in Experiment 1. These sources included all motion parameters measured during the motion correction procedure, the mean whole-brain signal, the mean signal from the lateral ventricles, and the mean signal from a region within the deep cerebral white matter. For each individual subject, the mean BOLD signal time course was measured for each of the seeded nuclei (i.e., caudate, putamen, and pallidum). Then, for each of the seeded nuclei, the correlation coefficient between the measured time courses and every voxel in the brain was computed and then converted to z values. Whole-brain z-maps were then subjected to random-effects analyses (Friston et al., 1999) to measure statistical significance across participants at the group level. All maps were also corrected for multiple comparisons.
Stimulus-driven functional data.
All functional images (from patients and healthy controls) were corrected for motion artifacts. Functional data from each run were rigidly aligned (6 DOF) relative to an independently generated averaged brain template (fsaverage, Freesurfer) using a boundary-based registration method (Greve and Fischl, 2009). All functional data were then spatially smoothed using a 3D Gaussian kernel (2.5 mm HWHM) and normalized across scans.
To estimate the amplitude of the BOLD response, a standard hemodynamic model based on a gamma function was fit to the fMRI signal and then the average BOLD response maps were calculated for each condition. Finally, voxelwise statistical tests were conducted by computing contrasts based on a univariate general linear model. To generate group-averaged maps for human subjects, functional maps were spatially normalized across subjects and then averaged using random-effects models (Friston et al., 1999). The resultant significance maps were projected onto the averaged human brain template after correction for multiple comparisons. For Experiment 3, between-group (patients vs healthy matched controls) differential activity maps were also calculated and then corrected for multiple comparisons.
ROI analysis
For each individual subject participating in Experiment 1, borders of the primary visual area V1 were defined based on their high-resolution anatomical scans and the MR-based myelination differences (Hinds et al., 2008). Also defined were the borders of face-selective (i.e., fusiform face area, FFA) and scene-selective (i.e., PPA and retrosplenial cortex, RSC) areas for each of these subjects using independent localizers based on face versus place contrast collected within an independent scan session. Additional details of the stimuli and scanning have been described previously (Rajimehr et al., 2009; Nasr et al., 2011).
For HD patients and their matched healthy controls participating in Experiment 3, we used the results of Experiment 2 to define the borders of PPA and RSC areas because access to these subjects was very limited and multiple scan sessions were not possible. More specifically, in these subjects, we defined the area borders using the group-averaged activity map (random effect) evoked by the scene > face contrast in Experiment 2 at p < 10−7 threshold level. Then, these borders were transposed from the average human brain template to each individual subject brain (as implemented in the FreeSurfer tool “mri_label2label”). Reassuringly, results of Experiments 2 and 3 plus many previous studies (Nasr et al., 2011; Julian et al., 2012; Nasr et al., 2014) have demonstrated that the cortical location of PPA and RSC does not vary greatly between different groups (e.g., Experiments 2 vs Experiment 3) and also between patients and healthy controls (Experiment 3, Table 1).
Level of atrophy in different subcortical nuclei
In Experiments 2 and 3, to examine the link between PPA-to-caudate functional connectivity and PPA response selectivity, we subdivided the PPA ROI into two subregions based on their level of functional connections to the caudate. Specifically, the PPA ROI was projected onto the functional connectivity map (Fig. 4). The portion of PPA (mainly in the posterior part) that showed strong (p < 10−4) functional connection with caudate versus the rest of PPA that showed weaker to no functional connection were used as two separate ROIs in this control test (Fig. 6). Other details were as described above.
Results
Experiment 1: functional connections between striatum and visual cortex
To compare systematically the influence of the VCSL on the activity of the temporal visual areas, the functional connection between the caudate (i.e., the main input site to striatum) and temporal visual areas was mapped. This was done by measuring the amount of correlation between fMRI activity fluctuations in the caudate nucleus (seeded area) and different temporal visual cortical areas in 30 healthy human subjects during the resting state with eyes closed (i.e., no external visual stimulation) and without explicit instructions (see Materials and Methods).
Figure 4A shows the resultant group-averaged functional connectivity. These results showed that activity fluctuations in the caudate demonstrated the highest level of correlation (functional connection) with the PPA compared with any other temporal cortical area. Consistent with this whole-brain analysis, results of analysis in different ROIs showed a significantly stronger (more negative) correlation between the caudate and PPA compared with the FFA (t(29) = −2.27, p = 0.03), scene-selective RSC (t(29) = −2.39, p = 0.02), and primary visual area V1 (t(29) = −5.20, p < 10−4; see Discussion). Beyond classic visual cortex, caudate showed a significant functional connection with the ventromedial prefrontal cortex and dorsal anterior cingulate cortex (dACC) consistent with previous diffusion tensor imaging (DTI) (Lehéricy et al., 2004; Leh et al., 2007) and functional connectivity (Postuma and Dagher, 2006; Robinson et al., 2012) analyses.

PPA is functionally connected to the caudate. A, Group-averaged (n = 30) correlation maps between the caudate (seed) and cortical areas. Black lines indicate borders of PPA and RSC based on activity evoked by scene > face contrast in the same individuals measured during separate scans. B, Corresponding correlation coefficient values averaged within different ROIs. Among tested ROIs, PPA showed the highest level of correlation with caudate. Error bars indicate 1 SEM.
Previous studies have been reported that “negative” functional connections can be due to correction for the whole-brain activity (Murphy et al., 2009). To test whether the strong selective functional connection between PPA and the caudate was due to correction for whole-brain activity, we repeated our tests but this time without correction for whole-brain activity. Results of this test showed that, despite a change in the sign of correlation (from negative to positive), the level of correlation between the caudate and PPA remained significantly higher than other visual areas, including FFA (t(29) = 2.43, p = 0.02), RSC (t(29) = 6.59, p < 10−4), and V1 (t(29) = 5.73, p < 10−4). Therefore, although these results do not prove a direct neuroanatomical link between caudate and PPA (see Discussion), they suggest a strong functional link between caudate response and activity within PPA (see Experiments 2 and 3).
As a further control, we tested the functional connections of the other two striatal nuclei (i.e., putamen and pallidum) with the visual cortex. In NHPs, these nuclei receive weaker (or no) direct afferent input from the temporal visual areas (Yeterian and Pandya, 1995; Cheng et al., 1997). Consistent with those studies, analysis of functional connection and subsequent ROI analysis in humans did not show any significant functional connection between putamen and/or pallidum relative to the FFA (p > 0.75) and PPA (p > 0.08) (i.e., the main areas of interest). Rather, they showed a strong functional connection to dACC and insular cortex (not shown here).
Experiment 2: biased response in subcortical and cortical regions
Based on the results of Experiment 1, one might expect caudate activity to be influenced to a larger extent by input from PPA (rather than the other temporal visual area, the FFA) and thus show a similar activity bias for scenes compared with faces (Epstein and Kanwisher, 1998; Nasr et al., 2011). To test this hypothesis, we examined fMRI activation in 43 healthy controls in response to a standard face versus scene contrast (see Materials and Methods). Previous studies have shown that this contrast evokes the highest level of selective response in scene-selective areas including PPA (Epstein and Kanwisher, 1998; Nasr et al., 2011).
Subcortical regions
Figure 5A shows the resultant group-averaged activity map evoked by the scene > face contrast in subcortical areas including the caudate. Consistent with our hypothesis, left and right caudate nuclei showed a significant scene > face bias, similar to the well established bias in cortical areas PPA and RSC (Epstein and Kanwisher, 1998; Park and Chun, 2009; Nasr et al., 2011). To our knowledge, no previous study has reported such a selectivity of caudate activity in response to this stimulus contrast. As a control, we also tested the selectivity of the amygdala. The amygdala showed an opposite selectivity for faces (Fig. 5B), as reported in many previous studies in both humans and NHPs (Breiter et al., 1996; Fried et al., 1997). Although unlikely, the other possible reason for caudate scene > face biased response could be subject's familiarity with the scene stimuli (see Materials and Methods). This possibility was further tested and ruled out in Experiment 3.
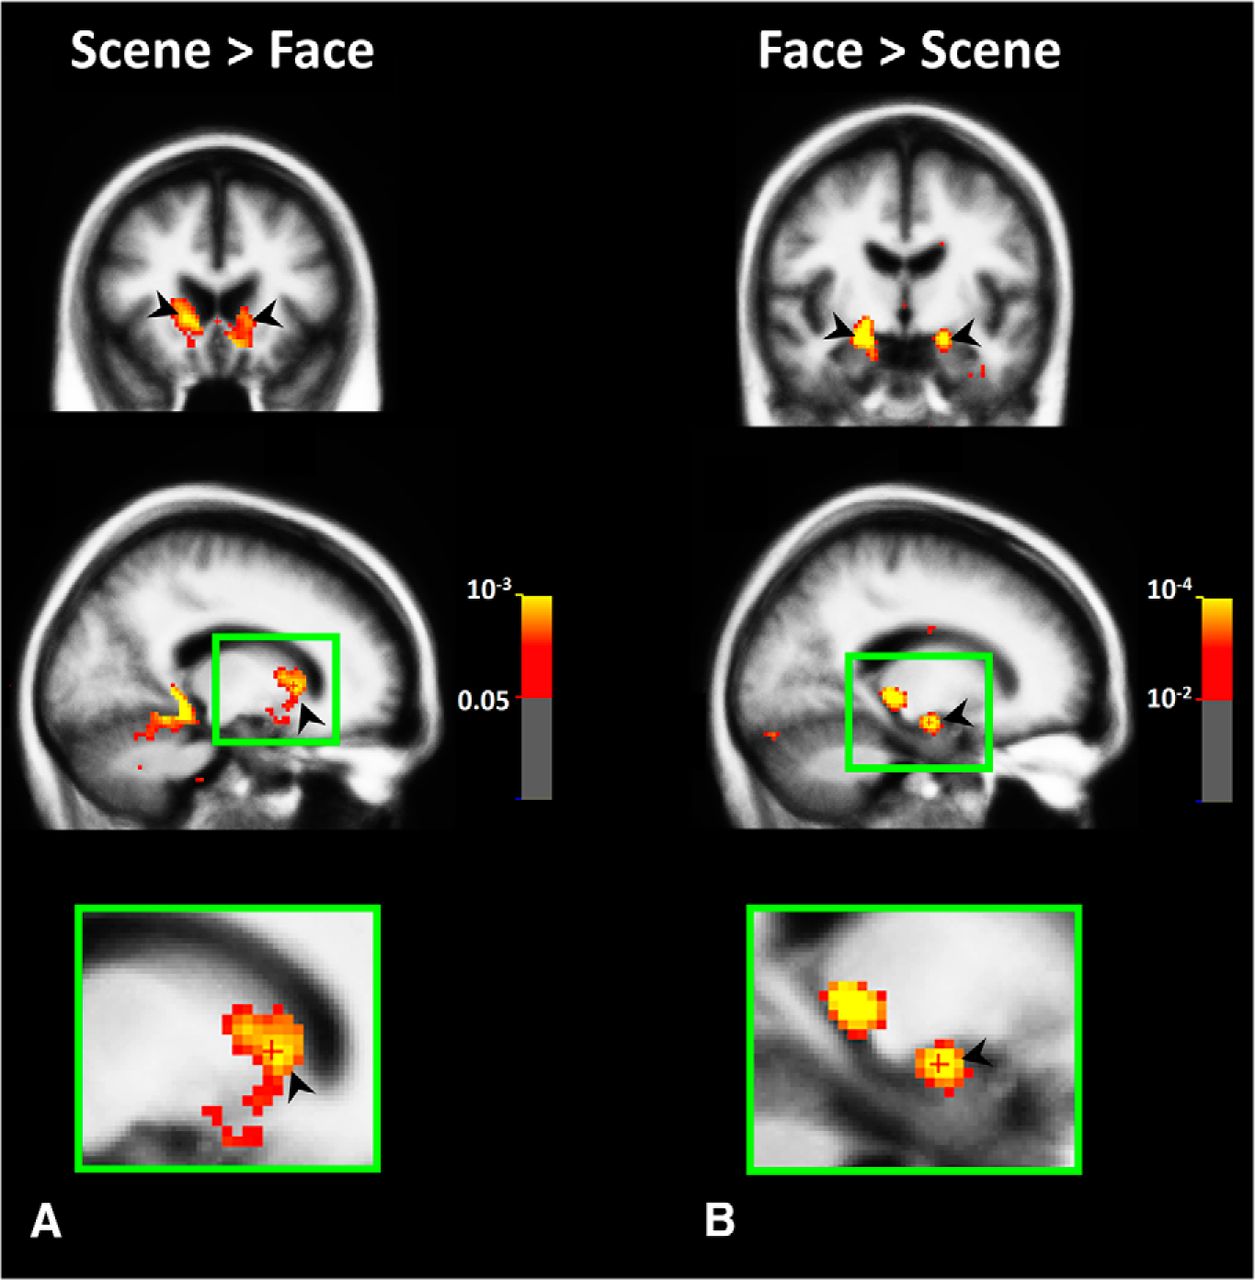
Visually selective response in subcortical areas. Group-averaged (n = 43) map of subcortical activity evoked by scene > face (A) and face > scene (B) contrasts in Experiment 2. All activities are measured based on random-effect and corrected for multiple comparisons. As indicated by black arrows, we found scene > face activity bias within both left and right caudate nuclei. Top, middle, and bottom panels, respectively, show the coronal, sagittal, and enlarged sagittal views. Activity outside the brain matter (including ventricles) was masked.
Cortical regions
As demonstrated in Figure 6A and consistent with the previous studies (Epstein and Kanwisher, 1998; Nasr et al., 2011), scene > face contrast also activated scene-selective cortical regions including PPA. To test the possible link between the level of PPA-to-caudate functional connection and the level of scene > face response evoked in this region we divided PPA into two subregions (Fig. 6B): 1) the portion of PPA which showed strong (p < 10−4) functional connection to Caudate, located mainly in the posterior portion of PPA and 2) the portion of PPA which showed weaker-to-no (p > 10−4) functional connection to Caudate, located mainly in the anterior portion of this area (see Materials and Methods). The resulted PPA subregions are demonstrated in Figure 6B. Subsequently, we projected these ROIs into each individual subject's brain and measured the level scene > face response in them (Fig. 6C). Application of a paired t test to the results of this measurement showed a stronger scene > face response in the PPA subregion that showed a stronger rather than weaker functional connection to the caudate (t(42) = 7.55, p < 10−8).

The link between PPA-to-caudate functional connectivity and PPA scene > face response. A, Group-averaged (n = 43) cortical activity map evoked by scene > face contrast, conventionally used to localized PPA (Rajimehr et al., 2009; Nasr et al., 2011; Nasr et al., 2014). B, PPA subregions with strong (blue) and weak (red) functional connectivity with the caudate nucleus. C, Level of scene > face response in the two PPA subregions. As demonstrated here, between the two PPA subregions, the posterior subregion with stronger functional connectivity to caudate showed a stronger scene > face response. Error bars indicate 1 SEM.
These results suggest that a PPA-to-caudate functional link (and VCSL) may play a role in generation of well known scene-selective response in PPA, especially in the posterior portion of this region that is more involved in processing of simpler objects and shapes (Baldassano et al., 2013; Nasr et al., 2014) and to a lesser extent in processing of the spatial context (Bar and Aminoff, 2003). This possibility was further scrutinized in Experiment 3.
Experiment 3: impact of the VCSL disruption on cortical visual processing
Results of Experiments 1 and 2 suggest that the caudate response may reflect dominant input from PPA. It also suggests that VCSL contributes in generation of scene > face response in area PPA. However, one other possibility is that this apparent functional link between the caudate and PPA is due to other factors, such as a common input into these two brain regions. In this situation, caudate degeneration and VCSL disruption would have no effect on PPA function. To test this hypothesis, we measured fMRI activity in 16 early stage HD patients and in 18 healthy matched controls in response to the presentation of an independent set of scenes, faces, and objects (see Materials and Methods). None of the healthy matched controls in this experiment had participated in the previous experiments. To rule out the possible familiarity effect on the caudate scene > face response, here, we only used unfamiliar scene and face images.
As demonstrated in Figure 7 and consistent with the previous HD studies (Vonsattel et al., 1985; Rosas et al., 2001; Aylward et al., 2004; Bohanna et al., 2008), caudate showed a significant degeneration in HD patients compared with matched healthy controls. In comparison, adjacent nonstriatal regions such as the thalamus and ventral diencephalon remained mostly intact between HD patients and controls. To measure the extent of striatum atrophy in HD patients quantitatively, we compared the size of caudate and putamen along other subcortical nuclei including amygdala, hippocampus, and ventral diencephalon and thalamus between HD patients and controls. All measurements were normalized relative to the individual subject's brain volume (Table 1). Despite the early stage of disease in these patients, their structural scan showed a significant caudate atrophy in left (F(1,32) = 34.04, p < 10−5) and right (F(1,32) = 35.51, p < 10−5) hemispheres compared with the matched healthy controls. Atrophy of other subcortical regions including amygdala, hippocampus, thalamus, and ventral diencephalon was less in extent and less significant on average (Table 1).

Structural imaging of the caudate nucleus in nine different healthy controls (blue outlines) and eight different HD patients (red outlines) who participated in Experiment 3. As demonstrated here, caudate nucleus was significantly degenerated in HD patients compared with controls, whereas adjacent nonstriatal regions such as thalamus and ventral diencephalon remained mostly intact (also see Table 1). A, Amygdala; Ac, nucleus accumbens; C, caudate; H, hippocampus; Pa, pallidum; Pu, putamen; T, thalamus; V, ventral diencephalon.
Figure 8, A and B, show the group-averaged activity maps evoked by the scene > face contrast in healthy controls and HD patients, respectively. In both groups, scene-selective PPA and RSC were detected and localized within the collateral sulcus and parieto-occipital sulcus, consistent with previous studies of these areas (Nasr et al., 2011). To compare the location of PPA and RSC between patients versus healthy controls, we determined the center of PPA and RSC activity (in medial vs lateral, anterior vs posterior, and superior vs inferior dimensions) for all individual subjects and compared them between the two groups. To eliminate the effect of brain size on these measurements, we first mapped all activity to the averaged brain (see Materials and Methods) and then measured the center of activity (i.e., the location with the highest scene > face response) within PPA and RSC for each subject. The result of this analysis did not yield any significant between-group difference in location of PPA and RSC (Table 2).
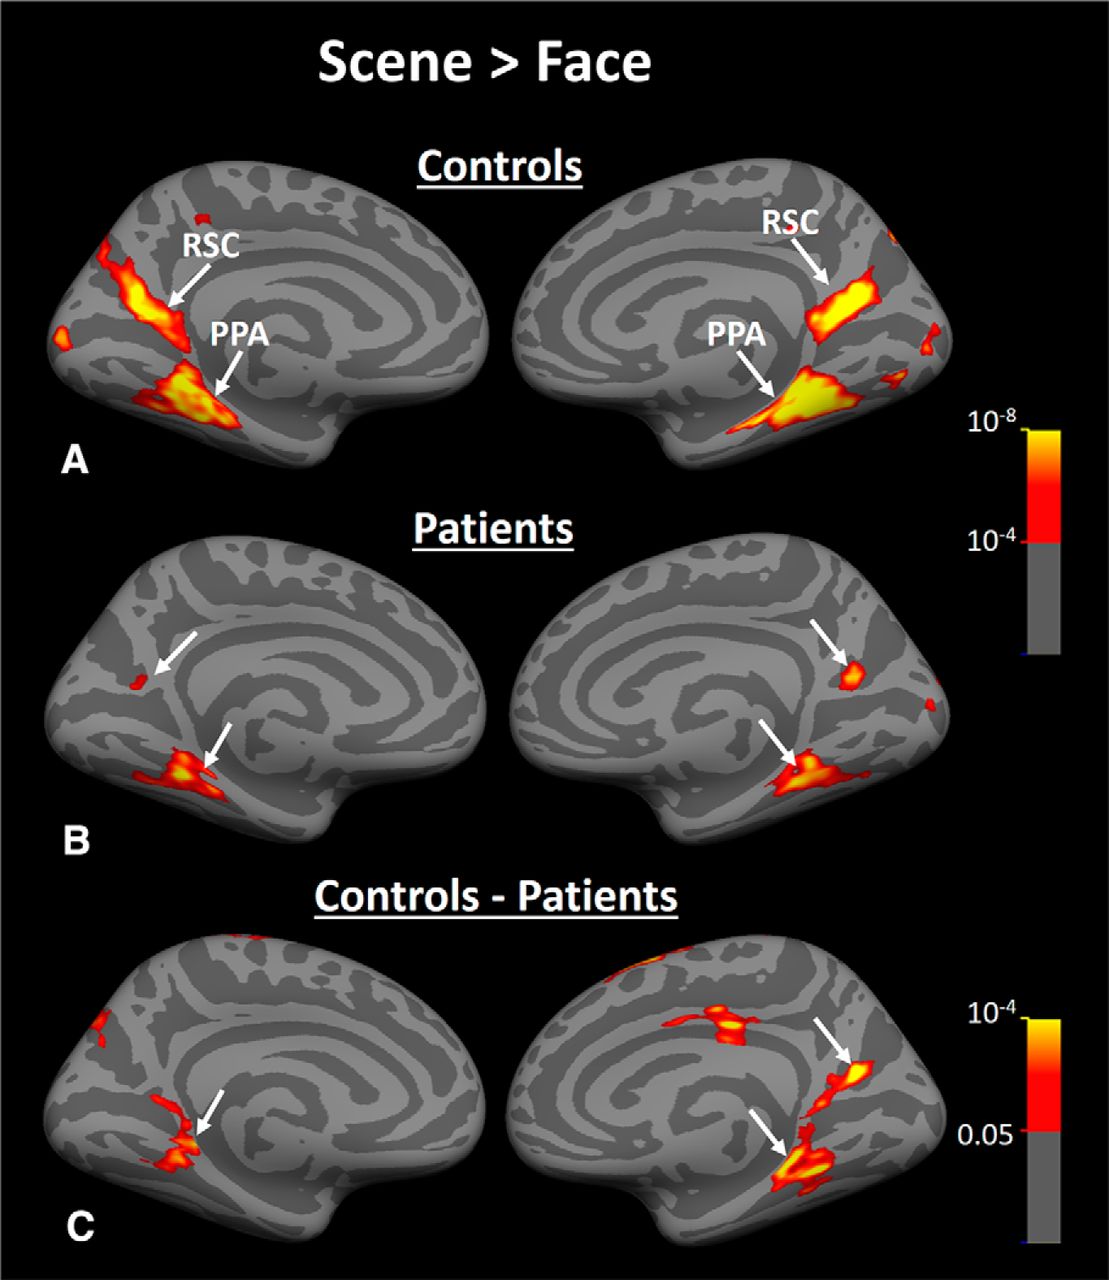
Group-averaged activity maps evoked by scene > face contrast in Experiment 3. A, Scene > face biased activity within PPA and RSC of healthy matched controls (n = 18). B, Brain response to the same contrast in HD subjects (n = 16). C, Results of between-group comparison. Arrows indicate the location of PPA and RSC in each hemisphere.
Coordination of PPA and RSC areas in HD patients and healthy controls
Despite this between-group similarity in the centroid of PPA and RSC activity, the level of the scene > face bias in both areas was lower in HD patients compared with controls (Fig. 8A,B) and between-group comparisons showed a significant bilateral decrease in the level of scene > face bias within PPA and RSC in HD patients compared with healthy controls (Fig. 8C). As a comparison, the converse test for face > scene bias did not show any significant difference between the two groups in any visual areas including FFA (Fig. 9). It could be argued that a more sensitive analysis based on averaged activity could also reveal a significant change in FFA selectivity. Therefore, we measured the level of fMRI response in PPA, RSC, and FFA (i.e., ROIs) evoked by scenes and faces relative to the baseline (the uniform gray display) in all individual subjects. ROI borders were defined independently based on an independent set of scans and stimuli (see Materials and Methods). Consistent with the group activity maps, separate applications of a one-way repeated measure ANOVA (stimulus type = scenes vs faces) with a group factor (patients vs controls) showed a significant group × stimulus type interaction in PPA (F(1,32) = 21.00, p < 10−4) and RSC (F(1,32) = 6.18, p = 0.02), but not in FFA (F(1,32) = 0.88, p = 0.36). These results provide additional evidence for a selective functional link between PPA and caudate, as suggested by Experiments 1 and 2.
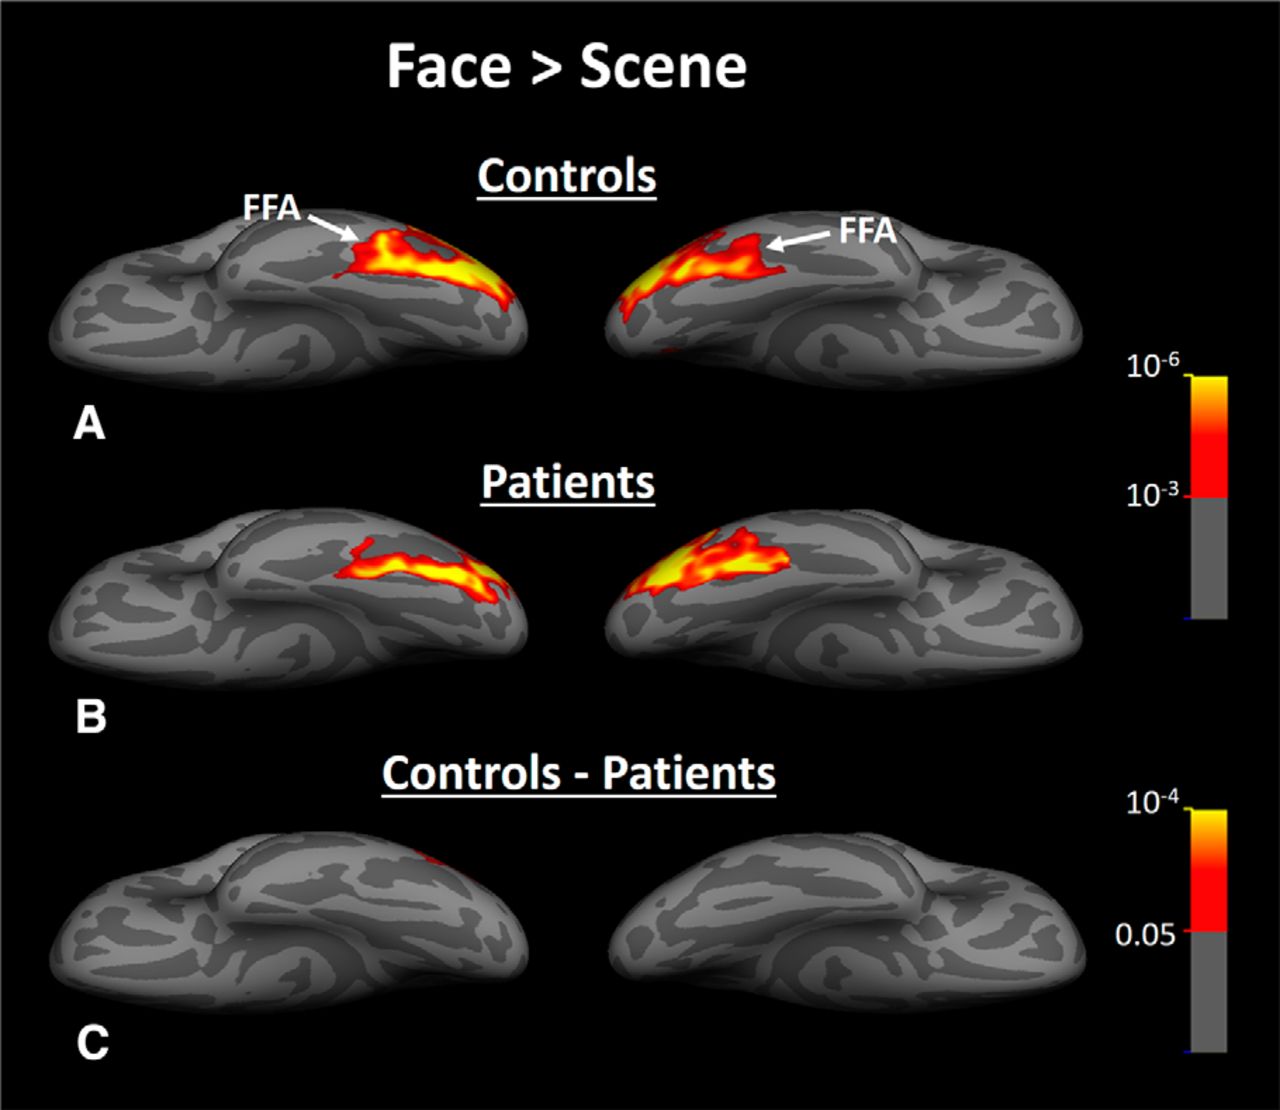
Group-averaged activity evoked by face > scene contrast within fusiform gyrus of healthy controls (A), HD patients (B), and the difference between face-selective activity evoked in patients versus controls (C). In contrast to scene-selective response (Fig. 8), we did not find any significant difference between face-selective activity evoked in patients and controls. In these maps, FFA is indicated by a white arrow. All other details are similar to Figure 8.
The reduced scene > face bias in PPA and RSC could be due to either a reduced response to the preferred stimuli (i.e., scenes), an increased response to nonpreferred stimuli (i.e., faces), or a combination of these two effects. The results of an ROI analysis suggested that the reduced selectivity in PPA is due to a significantly lower response to scenes (F(1,33) = 23.13, p > 10−4) in patients compared with the matched controls (Fig. 10A). In contrast, the PPA response level to faces did not differ significantly between the two groups (F(1,33) = 0.83, p = 0.37). Notably, the PPA response to face stimuli was significantly above the baseline for both patients (t(15) = 3.64, p < 0.01) and controls (t(17) = 7.98, p < 10−6). Therefore, this absence of between-group difference in response to faces could not be due to a floor effect.

Activity measured in PPA (A) and RSC (B) during Experiment 3. In PPA, response to scenes and objects (but not to faces) decreased significantly in HD patients compared with controls. In RSC, reduced biased activity was due to a combination of decreased response to scenes plus increased (less negative) response to faces. In each panel, activity in HD patients and controls are illustrated in red and blue, respectively. Error bars indicate 1 SEM.
We also compared the PPA response to objects between patients and healthy controls. Previous studies have suggested that PPA could be also involved in a more general shape encoding process rather than scene encoding per se (Baldassano et al., 2013; Nasr et al., 2014). To test this hypothesis, we applied a one-way repeated-measure ANOVA (stimulus type = scenes vs objects) with a group factor (patients vs controls) to PPA activity. Although we still found a significant group × stimulus type interaction in PPA (F(1,32) = 5.22, p = 0.03) due to a stronger activity difference in response to scenes (compared with objects) between the two groups, subsequent analysis showed that the PPA response to nonface objects was also reduced significantly (F(1,33) = 8.28, p < 0.01) in patients compared with controls (Fig. 10A). Therefore, whereas PPA impairments appear to be more prominent in response to scenes, the visual impairment in HD patients was not limited to the evoked response to scenes; it also influenced the evoked response to nonscene objects (see Experiment 4).
Application of the same ROI analysis to activity in the other scene-selective area (RSC) (Fig. 10B) was less conclusive and showed that the reduced scene > face bias in RSC was not due solely to either decreased response to scenes (F(1,33) = 0.70, p = 0.41) or objects (F(1,33) = 0.97, p = 0.33) or to increased (less negative) response to faces (F(1,33) = 0.32, p = 0.57). Rather, a combination of these responses was behind the observed functional effects in RSC in HD patients (see Discussion). These results suggest a differential impact of VCSL disruption on PPA versus RSC. We tested this more directly by applying a two-factor repeated-measures ANOVA (area = PPA vs RSC) and stimulus type (scene vs face vs object) with a between-group factor (HD vs control) to the measured fMRI response in RSC and PPA. Consistent with the PPA–RSC differences mentioned above, results of this analysis showed significant area × group (F(1,32) = 6.77, p = 0.01) and area × stimulus type × group (F(2,64) = 5.23, p < 0.01) interactions. Notably, replication of this test with a scene- and face-related response (i.e., without inclusion of object-related activity) showed a similar result: a significant area × group (F(1,32) = 7.11, p < 0.01) and area × stimulus type × group (F(1,32) = 7.52, p = 0.01) interactions. Therefore, HD had a significantly different effect on the PPA and RSC response to the presented stimuli.
We also evaluated the level of stimulus selectivity in subcortical nuclei. Consistent with the results of Experiment 2 (Fig. 5), we found a significant scene > face activity bias in the caudate in the matched controls (Fig. 11A). This result ruled out the possibility that caudate scene > face response in Experiment 2 is due to familiarity of the subjects to the scenes. Also, notably, we did not find such a biased activity in HD patients' caudate (Fig. 11B) despite the low threshold level used in this test (p < 0.05). This is most likely due to the significant degeneration of the caudate in HD patients (Fig. 7; Table 1).

Effect of HD on the level of visually selective response in subcortical areas. Group-averaged activity maps evoked by scene > face contrast in subcortical areas of patients (A) and controls (B) during Experiment 3. In A, caudate location is indicated by black arrows. C, D, Group-averaged activity maps evoked by face > scene contrast in patients and controls, respectively. Amygdala location is indicated by black arrows. Although patients showed reduced scene > face activity in caudate compared with controls, they did not show any prominent difference in the level face > scene activity within amygdala.
Prior studies have reported preferential degeneration of the striatum compared with the amygdala in HD (Table 1; Breiter et al., 1996; Fried et al., 1997). Consistently, we found that face > scene activity was equivalent in the amygdala across healthy matched controls (Fig. 11C) and HD patients (Fig. 11D). The ROI analysis in amygdala showed neither a significant group × stimulus type interaction (F(1,1) = 1.27, p = 0.27) nor a significant difference in the level of activity evoked by faces (F(1,33) = 0.44, p = 0.51) or scenes (F(1,33) = 1.62, p = 0.21). Therefore, despite mild atrophy in amygdala (Table 1), activity in this area (in contrast to caudate) remained mostly intact between HD patients and healthy controls. This supports the notion that functional impairment in HD patients is mostly limited to caudate and PPA, at least in the early stages of HD.
In summary, HD patients showed a significant change in the level of scene > face bias within PPA and caudate nucleus. However, the level of face-selective activity in the cortical (FFA) and subcortical (amygdala) areas remained unchanged between the two groups. This intact face-selective response in cortical and subcortical areas rules out the possibility that reduced scene > face bias is due to a nonselective impairment (e.g., due to attention deficits) or low fMRI signal quality (e.g., due to involuntary head motion) in patients compared with healthy controls.
Scene selectivity versus functional connectivity
Based on the above results, one may hypothesize that patients with HD should show a more prominent selectivity decrease in the portion of PPA that showed a greater functional connection to the caudate. To test this hypothesis, we used the same PPA subregions with strong versus weaker-to-no functional connection to caudate as described in Experiment 2 (also see Materials and Methods) and measured the level of scene > face response in these two PPA subregions in both patients and controls.
Figure 12 shows the results. Application of one-way repeated-measures (area with strong vs weak functional connection to caudate) with a group factor (HD patients vs controls) to the measured scene > face response showed a significant area × group interaction (F(1,32) = 4.63, p = 0.03) due to a stronger between-group difference in the portion of PPA that showed a stronger functional connection to caudate. In addition, we found significant effects of area (F(1,32) = 107.42, p < 10−11) and group on the level of scene > face response (F(1,32) = 23.34, p < 10−4). Therefore, consistent with the results of Experiment 2, these results support the hypothesis that PPA-to-caudate functional connection influences the level of evoked scene > face response in this area.

The level of scene > face activity measured within the portion of PPA that showed strong (left) and weak (right) functional connection to caudate. It appeared that the portion of PPA that showed a stronger functional connection to the caudate was more affected by the caudate degeneration and showed weaker scene > face response in HD patients (red bars) compared with controls (blue bars).
Functional versus structural changes
Output disruption due to a lesion in the target area may lead to retrograde transneuronal degeneration (also known as dying-back) in connected brain area(s). Therefore, with regard to the PPA functional link with the caudate, caudate degeneration could result in PPA degeneration (thinning) in HD patients. If true, a reduction in the scene > face activity in PPA could be due to the PPA degeneration and not necessarily related to VCSL influence on PPA processing. To determine whether PPA dysfunction was associated with structural degeneration in this area, we measured the cortical thinning in the same group of HD patients that participated in Experiment 3 (compared with the same control subjects) and then compared the pattern of cortical thinning versus decrease in scene > face bias (Fig. 13).

Comparing the pattern of decrease in scene selectivity (A) relative to the pattern of cortical thinning (B) in the same subjects that participated in Experiment 3. Lack of overlap between these two disease-related neural changes ruled out any causal link between them. Probabilistic borders of V1 and V2 are illustrated with dashed and dotted lines, respectively (Fischl et al., 2008). Asterisks indicate the location of foveal representation.
Consistent with previous studies (Rosas et al., 2008), HD patients showed cortical thinning within visual areas mainly including: (1) the portion of early visual areas (V1/V2) that responds to central visual field stimulation, (2) intraparietal sulcus (IPS) and (3) the posterior–lateral regions of the fusiform gyrus, and (4) anterior temporal pole. We did not find any overlap between those areas that showed a decrease in scene > face bias (Fig. 13A) and those areas that showed cortical thinning (Fig. 13B). Furthermore, because it is unlikely that the cortical thinning in the early visual areas is responsible for the decrease in PPA scene > face response for two reasons: (1) although PPA is more sensitive to the peripheral visual field stimulation (Hasson et al., 2003; Levy et al., 2004), cortical thinning was more prominent in those regions that responded to central visual field stimulation; and (2) area FFA, which receives the majority of its input from those visual areas that respond to central visual field stimulation (Hasson et al., 2003; Levy et al., 2004) and shows thinning in HD patients, still shows a face > scene response comparable to that in the healthy controls. This suggests that cortical thinning in the early visual areas does not necessarily lead to a change in the level of selective response in higher-order regions. All in all, it is seems unlikely that the decreased scene > face bias reported here is due to PPA structural degeneration in HD patients compared with controls.
Experiment 4: corresponding behavioral impairments
Only a few studies have reported visual perceptual deficits in HD, based on psychophysics (Jacobs et al., 1995; Gomez-Tortosa et al., 1996; Lawrence et al., 2000). Given the neural processing deficits evident in Experiment 3, we next investigated whether visual perception (at the behavioral level) might also be impaired in HD patients and, if so, whether this perceptual impairment was more severe for objects and visual features that were processed selectively within PPA.
To test this possibility, we instructed a group of HD patients (n = 12) and healthy matched controls (n = 12) to participate in three two-alternative forced choice visual tasks (see Materials and Methods). In the first task, participants were instructed to perform a one-back house discrimination task (Fig. 2 and Materials and Methods). Because perceptual impairments in early stages of neurodegenerative diseases could be minor and not detectable unless the visual system is overloaded, the level of similarity between house images was adjusted so that healthy controls were expected to show an ∼75% response accuracy in this task (Nasr and Tootell, 2012b). At this level of difficulty, previous studies have shown that discrimination of house/building images strongly modulate the PPA response (Epstein et al., 2007; Nasr and Tootell, 2012b). Here, we found that HD patients showed significantly (F(1,23) = 5.17, p = 0.03) lower response accuracy (67.69 ± 12.74, mean ± SD) than healthy matched controls (78.24 ± 9.79) in a house discrimination task. Importantly, the patients' performance remained significantly above the chance (50%) level (t(11) = 18.40, p < 10−8). This better-than-chance performance may explain why perceptual impairments in HD patients have been largely unreported in previous clinical studies.
Previous studies have shown that PPA is involved in shape encoding (Baldassano et al., 2013; Nasr et al., 2014; Troiani et al., 2014), but have little or no role in spatial discrimination (Nasr et al., 2013). According to these studies and the results of Experiment 3, we expected stronger impairments in shape discrimination compared with spatial discrimination. To test this hypothesis, we measured the sensitivity of HD patients and matched controls to shape and spatial differences when objects were presented simultaneously on screen (see Materials and Methods). Compared with the one-back task, this procedure reduced the impact of working memory load on subject's response accuracy. For the same reason mentioned above, in both tests, the performance level was adjusted to 75% accuracy by adjusting the contrast of the target objects for each individual subject (Nasr et al., 2013).
The results confirmed our hypothesis. At this individually adjusted performance level, the sensitivity (measured as 100/object contrast) of HD patients to shape differences (2.08 ± 0.58) was significantly (F(1,23) = 6.33, p = 0.02) lower than healthy controls (2.89 ± 0.95). In contrast, sensitivity to spatial differences in HDs (5.28 ± 2.26) did not vary significantly (F(1,23) = 2.80, p = 0.11) from the healthy matched controls (6.66 ± 1.73). These results suggested that the visual discrimination problems in HD patients were due (at least partly) to their reduced sensitivity to shape differences independent of attention and working memory load, consistent with the suggested role for PPA in shape encoding (Baldassano et al., 2013; Nasr et al., 2014; Troiani et al., 2014). It also suggests that previously reported perceptual problems in HD patients (e.g., impaired object recognition, Gomez-Tortosa et al., 1996, Lawrence et al., 2000; and/or navigation problems, Majerová et al., 2012) are, at least to some extent, due to the reduce shape encoding capabilities in these patients.
Discussion
Visual perception is often considered the product of a multistage feedforward neural processing in which visual information is relayed from the thalamus to early visual areas and then to higher-order visual regions including PPA, RSC, and FFA, ignoring the likely impact of corticosubcortical loops on this process (Alexander et al., 1986; Cheng et al., 1997). Here, we provide some of the first evidence for the contribution of VCSL on generating biased (selective) activity in the visual cortex. These results appear to be consistent with the general idea that corticostriatal loops are involved in resolving stimulus ambiguity (for review, see Seger, 2013). Among all visual stimuli, scene images appear to be more complicated (contain many objects) and therefore require more clarification and ambiguity reduction. These results also expand the role of VCSL beyond rule-based classification and categorization learning (Seger and Cincotta, 2005; Seger, 2008; Seger et al., 2010) and to perceptual categorization.
Caudate functional connections
Here, we used functional connectivity analysis as a measure of VCSL influence on visual cortical activity. Consistent with our findings, previous studies have reported functional connections between caudate and temporal visual areas (Postuma and Dagher, 2006; Di Martino et al., 2008; Robinson et al., 2012; Stillman et al., 2013; Porter et al., 2015), but we have shown here that the PPA to caudate functional connection was stronger than the functional connection between caudate and other temporal visual areas.
Simplistically, negative functional connectivity between PPA and caudate can be interpreted as an inhibitory link between the two regions. However, the interpretation of positive and negative BOLD signals remains somewhat uncertain. Many studies have suggested that anticorrelated fMRI fluctuations are (at least partly) due to global brain signal regression (Murphy et al., 2009; Keller et al., 2013). With regard to our findings, although global brain activity regression influenced the sign of PPA to caudate correlation, the level of correlation between them remained stronger than the caudate correlation with any other temporal visual area regardless of exclusion/inclusion of global brain activity. In addition, we did not find any selective functional connection between the putamen or pallidum with PPA regardless of exclusion/inclusion of global brain activity. Therefore, our findings support a selective functional link between PPA and caudate.
Despite a general similarity between structural and the functional connectivity findings (Greicius et al., 2009; Shehzad et al., 2009; Miranda-Dominguez et al., 2014), one should be especially cautious in interpreting the resting-state functional connectivity. In contrast to the neuroanatomical methods used to trace connections in NHPs, functional connectivity analyses provide an indirect measure of the link between brain areas (Greicius et al., 2009; Van Dijk et al., 2010; Yeo et al., 2011). EEG and intracranial recordings suggest that functional connectivity corresponds to a coupling of low-frequency neural activity between brain areas (He et al., 2008; Schölvinck et al., 2010; Magri et al., 2012; Wang et al., 2012; Keller et al., 2013). Other studies have shown that variables that are not strictly related to the neuroanatomical connections per se (e.g., common input, Honey et al., 2009; Adachi et al., 2012; and/or global brain activity, Murphy et al., 2009; Keller et al., 2013) may also influence the functional connection between regions. Although we ruled out the impact of common (visual) input and global brain activity on our findings, we still believe that understanding the nature of PPA-to-caudate connectivity (inhibitory vs excitatory) requires more direct measurements in the future.
Caudate neuroanatomical connections in NHPs and humans
In NHPs, neuroanatomical connections between the caudate and visual temporal cortex have been shown in multiple histological studies (Yeterian and Pandya, 1995; Middleton and Strick, 1996; Cheng et al., 1997). According to these studies, visual areas (including the monkey homolog of PPA) project heavily to the tail and only to a lesser extent to the body of caudate. In contrast, results from the functional connectivity studies (see above) and at least one DTI study in humans suggest a strong connection between the body of caudate and the inferior temporal visual areas (Leh et al., 2007).
This apparent discrepancy can emanate from (at least) two reasons: (1) analysis of functional connection used in human studies is only an indirect measure of connection between two brain regions; and (2) this might be (partly) due to the evolutionary differences between the human and NHP brain structures. Consistently, it is known that human PPA is larger (and probably more developed) compared with monkeys (Nasr et al., 2011; Kornblith et al., 2013). With regard to these issues and also the technical limitations of DTI technique (Assaf and Pasternak, 2008; Hagmann et al., 2010), further studies are necessary to map the neuroanatomical connections between the caudate and visual temporal cortex.
Biased response for scenes in caudate
Despite our use of distinctly different stimuli, including familiar (Experiment 2) and nonfamiliar (Experiment 3) scenes, the caudate showed a significant bias for scenes. However, activity bias in the caudate might be evoked by simple features that are common between scenes (but not faces) such as high spatial frequency (Rajimehr et al., 2011; Zeidman et al., 2012), horizontal and vertical contours (Nasr and Tootell, 2012a), and rectilinearity (Nasr et al., 2014). This possibility is supported by the fact that PPA-to-caudate functional connection was stronger in the posterior (rather than anterior) portion of PPA, which also responds to simpler visual features and shapes (Baldassano et al., 2013; Nasr et al., 2014). In any event, more studies are necessary to clarify the stimulus selectivity of the caudate nucleus.
In contrast, because the level of attention and nature of the tasks did not vary between experimental conditions, rule-based learning (Seger and Cincotta, 2005; Seger, 2008; Seger et al., 2010; Seger, 2013), action selection (Mink, 1996; Humphries et al., 2006; Frank, 2011), and/or unbalanced level of attention to different stimuli could not be responsible for the evoked biased activity within caudate.
Reduced bias for scenes in PPA after caudate atrophy
Here, we showed that caudate atrophy (in our HD cohort) was associated with a decreased PPA response to its preferred stimuli (i.e., scenes and objects), whereas its response to nonpreferred stimuli (faces) remained similar between patients and controls. Interestingly, this decrease was stronger in the portion of PPA that showed a stronger functional connection to caudate. Because we did not find any significant cortical thinning in PPA in patients, such reduced PPA selectivity is unlikely to be due to PPA degeneration (Fig. 13). Moreover, because face selectivity in FFA and amygdala were similar in patients and controls, it is unlikely that a more general phenomenon (e.g., attention and/or working memory deficits) was responsible for decreased PPA selectivity.
Consistent with these results, one study has shown that the level of resting-state activity fluctuations within the fusiform gyrus of HD patients is reduced compared with healthy controls (Wolf et al., 2014). However, the fusiform gyrus is shared between face- and a scene-selective areas (i.e., FFA and lateral portion of PPA; Nasr et al., 2011). The prior study did not state whether this effect was limited to the scene-selective portion of the fusiform gyrus (i.e., PPA) or if it also included the adjacent FFA. They also did not report any evidence for a change in the selectivity of stimulus-driven responses in this area.
In addition to PPA, we also found decreased scene selectivity in RSC, a brain area now thought to be involved in navigation (Epstein et al., 2007) and spatial comparison (Wolbers et al., 2011; Harel et al., 2013; Nasr et al., 2013). Compared with PPA, the selectivity decrease in patients' RSC was weaker and less conclusive. Potentially, this weak selectivity decrease in RSC is (at least partly) due to its functional connection to PPA (Baldassano et al., 2013; Nasr et al., 2013) and reflects PPA dysfunction. However, more studies are necessary to understand the nature of this selectivity decrease in RSC.
Caudate abnormality in other neurological disorders
Degeneration of the caudate has been shown, not only in HD, but also in several other neurodegenerative disorders, including Alzheimer's disease (AD) and Parkinson's disease (PD) (Grahn et al., 2009; Jiji et al., 2013). Therefore, our findings may have broader implications. Although AD and PD patients show visual perceptual impairments that are closely correlated with their functional status (Perry and Hodges, 2000; Rizzo et al., 2000; Gillebert et al., 2015), the apparent link between the caudate degeneration and visual impairments has not been examined directly in these patients. However, those findings are consistent with our hypothesis that disruptions of VCSL, along with other neurological disorders, play a critical role in visual perceptual impairments.
Footnotes
- Received March 6, 2016.
- Revision received July 24, 2016.
- Accepted August 24, 2016.
This work was supported by the National Institutes of Health (Grant R56-NS042861 to H.D.R.) and the Martinos Center for Biomedical Imaging and National Institutes of Health (Grant 5P41-EB-015896-17). We thank Prof. Roger B.H. Tootell for help and unconditional support, all of our subjects, and the coordinators and research assistants who helped us during this study.
- Correspondence should be addressed to Shahin Nasr, Athinoula A. Martinos Center for Biomedical Imaging, Bldg.149, 13th Street, Charlestown, MA 02129. shahin{at}nmr.mgh.harvard.edu
- Copyright © 2016 the authors 0270-6474/16/3610456-16$15.00/0