
Abstract
Spindles and slow oscillations (SOs) both appear to play an important role in memory consolidation. Spindle and SO “nesting,” or the temporal overlap between the two events, is believed to modulate consolidation. However, the neurophysiological processes modified by nesting remain poorly understood. We thus recorded activity from the primary motor cortex of 4 male sleeping rats to investigate how SO and spindles interact to modulate the correlation structure of neural firing. During spindles, primary motor cortex neurons fired at a preferred phase, with neural pairs demonstrating greater neural synchrony, or correlated firing, during spindle peaks. We found a direct relationship between the temporal proximity between SO and spindles, and changes to the distribution of neural correlations; nesting was associated with narrowing of the distribution, with a reduction in low- and high-correlation pairs. Such narrowing may be consistent with greater exploration of neural states. Interestingly, after animals practiced a novel motor task, pairwise correlations increased during nested spindles, consistent with targeted strengthening of functional interactions. These findings may be key mechanisms through which spindle nesting supports memory consolidation.
SIGNIFICANCE STATEMENT Our analysis revealed changes in cortical spiking structure that followed the waxing and waning of spindles; firing rates increased, spikes were more phase-locked to spindle-band local field potential, and synchrony across units peaked during spindles. Moreover, we showed that the degree of nesting between spindles and slow oscillations modified the correlation structure across units by narrowing the distribution of pairwise correlations. Finally, we demonstrated that engaging in a novel motor task increased pairwise correlations during nested spindles. These phenomena suggest key mechanisms through which the interaction of spindles and slow oscillations may support sensorimotor learning. More broadly, this work helps link large-scale measures of population activity to changes in spiking structure, a critical step in understanding neuroplasticity across multiple scales.
- correlation
- sleep
- spiking
- spindle
- slow waves
- slow oscillations
Introduction
Sleep-dependent offline processing is required for the consolidation of new memories and skills (Rasch and Born, 2013; Miyamoto et al., 2016; Gulati et al., 2017; Latchoumane et al., 2017; Kim et al., 2019). Thalamocortical spindles, 10–16 Hz bursts of activity that appear in EEG signals and local field potentials (LFP) (Steriade et al., 1993b; Steriade, 2000; Rasch and Born, 2013), in particular, have been linked to offline processing across a variety of paradigms ranging from declarative memory tasks (Gais et al., 2002; Clemens et al., 2005, 2006; Eschenko et al., 2006; Mölle et al., 2009; Logothetis et al., 2012) to motor learning paradigms (Walker et al., 2002; Fogel and Smith, 2006; Nishida and Walker, 2007; Barakat et al., 2011; Johnson et al., 2012; Ramanathan et al., 2015). Moreover, slow oscillations (SOs; <1 Hz deflections in EEG or LFP) during NREM sleep appear to be essential for offline processing of awake experiences during sleep (Steriade and Timofeev, 2003; Molle et al., 2004; Marshall et al., 2006; Gulati et al., 2014, 2017; Ramanathan et al., 2015; Miyamoto et al., 2016; Kim et al., 2019).
There is growing evidence that “nesting” of SO with spindles may be particularly important for offline processing. For putative hippocampus-dependent tasks, the coordination of thalamocortical spindles, SO, and sharp-wave ripples appears to promote consolidation through hierarchical nesting, in which higher-frequency oscillations are embedded (“nested”) within lower-frequency oscillations (Steriade et al., 1993a; Mölle et al., 2002, 2009; Ji and Wilson, 2007; Cox et al., 2014; Niknazar et al., 2015). Interestingly, a recent study selectively induced either nested or un-nested sleep spindles within SO during a contextual fear conditioning task and found concordant changes in behavior (Latchoumane et al., 2017), indicating that nesting plays a causal role in learning. In motor learning paradigms, both spindles and SOs are correlated with the reactivation of awake experiences and offline performance gains (Ramanathan et al., 2015; Kim et al., 2019).
Despite the extensive work linking sleep spindles, SOs, and the phenomenon of nesting to memory consolidation, relatively little is understood about the relationship between these oscillations and spiking activity. In general, the temporal precision of neural spiking is central in regulating changes in synaptic efficacy (Hebb, 1949; Bi and Poo, 1998), and network correlation structure is predictive of large-scale functional reorganization (Merzenich et al., 1984; Recanzone et al., 1992; Yazdan-Shahmorad et al., 2018). A few studies have found that neurons in PFC are phase-locked to sleep spindles (Peyrache et al., 2011; Gardner et al., 2013; Sela et al., 2016). However, despite the importance of neural correlations for driving synaptic plasticity, the effect of spindles on the correlation structure of neural firing remains largely unexplored.
To that end, we simultaneously recorded LFPs and spiking activity from electrode arrays in the primary motor cortex (M1) of sleeping rats. This allowed us to examine the precise relationship between spike timing relative to ongoing spindles and SO. By parsing spindles into their component cycles, we were able to analyze the dynamics of spiking during the evolution of spindles. This analysis revealed a waxing and waning of fine-scale structure, which featured increased spiking, increased phase-locking, and increased pairwise correlations that reached a maximum at the peak of spindles. This analysis also revealed that the interaction of spindles and SO modulate spiking structure: the distribution of spindle-induced correlations narrowed when spindles were in closer temporal proximity (i.e., nested) to an SO. Finally, we found that, following engagement in a novel motor task, there was an increase in pairwise correlations during nested spindles. By understanding the connection between spindles, SO, and spiking correlation structure, we gained insight into the neurophysiological basis of offline processing modulated by spindle-SO interactions.
Materials and Methods
Electrophysiology
We recorded extracellular neural activity using tungsten microwire electrode arrays (n = 2 rats, Tucker-Davis Technologies), tetrodes (n = 1 rat, NeuroNexus), and custom probes (n = 1 rat) (Egert et al., 2018). We implanted arrays targeted to layer 5 of (∼1.5 mm) the caudal forelimb area of the M1, centered at 3–4 mm lateral, 0.5 mm anterior to bregma.
We recorded spike and LFP activity using a 128- and 256-channel Tucker-Davis Technologies RZ2 system. Spike data were sampled at 24,414 Hz and high-pass filtered at 300 Hz. Broadband LFP data were sampled at 1018 Hz, and bandpass filtered between 0.1 and 300 Hz. We used unity gain, high-impedance (∼1 GΩ) headstages; for 3 animals, we used Tucker-Davis Technologies analog headstages; and for 1 animal, we used two 128-channel custom boards with two RHD 128-channel chips (Intan Technologies, product #C3316). Microwire electrode array recordings were sorted offline using PCA-based algorithms followed by manual cluster-cutting using Tucker-Davis Technologies' OpenSorter software. Tetrodes were sorted using the UltraMegaSort toolbox (https://physics.ucsd.edu/neurophysics/software.php), a set of MATLAB (The MathWorks) based scripts for tetrode sorting described in detail previously (Gulati et al., 2014; Ramanathan et al., 2015). Sorting on the 256-channel custom probes was done using MountainSort (Chung et al., 2017). Briefly, MountainSort is spike-sorting software that uses an automatic algorithm, which compares clusters of data using one-dimensional projections. If data along these projections are statistically bimodal, then the clusters are considered distinct. We used a consolidation factor of 0.9 and a noise overlap threshold of 0.03 to identify clusters as single units. We performed a minimal amount of post hoc manual merging and rejection of clusters to correct for drift during long recordings.
We recorded 40, 35, 11, and 13 units from each probe (and rat), respectively. For all first-order statistical analyses, we combined units together for a total 99 units. Pairwise analyses used all units within an animal. In total, 1508 pairs (780, 595, 55, and 78 pairs, respectively) were analyzed.
Experimental design and statistical analyses
This study was performed in strict accordance with guidelines from the USDA Animal Welfare Act and United States Public Health Science Policy. The protocol was approved by the San Francisco Veterans Administration Medical Center Institutional Animal Care and Use Committee (Protocol #13-006). We used 4 adult Long–Evans male rats (∼12–16 weeks old). We collected new data from 1 animal for this study and reanalyzed data from 3 animals in a previously published study (Ramanathan et al., 2015). Animals were kept under controlled temperature and a 12 h light/dark cycle with lights on at 06:00 A.M. Probes were implanted during a recovery surgery performed under isoflurane (1%-3%) anesthesia. The postoperative recovery regimen included administration of buprenorphine at 0.02 mg/kg BW and meloxicam at 0.2 mg/kg BW. Dexamethasone at 0.5 mg/kg BW and trimethoprim sulfadiazine at 15 mg/kg BW were also administered postoperatively for 5 d. All animals were allowed to recover for 5 d before the start of experiments.
As in Ramanathan et al. (2015), we recorded neural activity and monitored all rats in this study during sleep blocks before and after being exposed to a novel motor task (Whishaw forelimb reach-to-grasp task) (Whishaw et al., 2008). During this task, rats learned to reach, grasp, and retrieve a sugar pellet (Ramanathan et al., 2015). In this study, sleep blocks before and after motor practice were combined for analyses, except where we have explicitly analyzed the effect of practice on a novel motor task (see Fig. 6).
Data preprocessing and statistical analyses were performed in MATLAB using a combination of built-in statistics functions, custom scripts, and available third-party neural data analysis Toolboxes. Across all analyses, disconnected/high-impedance LFP channels were removed from the analysis. For each statistical comparison, we reported the statistical test, effect sizes, and p values in the text; p values <0.05 were considered significant. When using custom statistical methods (e.g., shuffling procedures), the detailed procedure is outlined in Materials and Methods.
Sleep classification
Each LFP channel was segmented into nonoverlapping 6 s windows. In each window, the power spectral density was computed and averaged over the δ/SO (0.1–4 Hz) and γ (30–60 Hz) frequency bands (Kim et al., 2019). Then a k-means classifier was used to cluster epochs into two clusters, NREM sleep and REM/awake (see Fig. 1B). Only long (>30 s, 5 consecutive windows) epochs of sleep were analyzed. The identified NREM sleep epochs were verified by post hoc visual inspection of the LFP activity.
Spindle detection
The spindle detection applied here is similar to the algorithm used previously (Sela et al., 2016; Kim et al., 2019). Channels without obvious artifacts were first z-scored and averaged to form a virtual LFP channel. This signal was filtered in the spindle band (10-16 Hz) using a zero-phase shifted, third-order Butterworth filter. A smoothed envelope was calculated by computing the magnitude of the Hilbert transform of this signal and then convolving it with a Gaussian window (α = 2.5). Next, we determined two thresholds for spindle detection (Ramanathan et al., 2015; Kim et al., 2019) based on the mean and SD of the spindle band envelope during NREM sleep (lower: 1.5 SD; upper: 2.5 SD). Epochs in which the spindle envelope exceeded the upper threshold for at least one sample and the spindle power exceeded the lower threshold for at least 500 ms were considered spindles (see Fig. 1C). Finally, spindles that were sufficiently close in time (<300 ms) were combined. For each spindle epoch, the peak of the spindle band LFP was identified. Spindles were aligned to this peak for generating average spindle waveforms, spectrograms, and spike rasters (see Figs. 1, 2).
Control spindle epochs
There is a certain degree of spiking, phase-locking, and synchrony between neurons that is expected, even if neurons are not modulated by spindles. To account for such effects, we generated a control spindle distribution that had similar statistics to the true spindle epoch distribution. Briefly, for each spindle epoch, a random offset, T, was computed 5-10 s back from the true spindle peak, that is, T ∼ U (–10, –5). The nearest peak in the spindle band LFP to that offset was taken as the peak of the control spindle epoch (see Fig. 3A, examples). Each analysis was jointly computed for the true spindle epochs (see Figs. 3, 4, blue) and the control spindle epochs (see Figs. 3, 4, black).
SO detection
The SO detection is similar to algorithms used previously (Sela et al., 2016; Kim et al., 2019). To detect the <1 Hz SO, a virtual LFP channel was constructed by averaging the LFP across all recording channels (see Fig. 1C). Next, this virtual signal was filtered in a low-frequency band (second-order, zero phase-shifted, high-pass Butterworth filter with a cutoff at 0.1 Hz followed by a fifth-order, zero phase-shifted, low-pass Butterworth filter with a cutoff at 4 Hz). Next, all positive-to-negative zero crossings during NREM sleep were identified, along with the previous peaks, the following troughs, and the surrounding negative-to-positive zero crossings. Each identified epoch was considered an SO if the peak was in the top 85% of peaks, the trough was in the top 40% of troughs, and the time between the negative-to-positive zero crossings was >300 ms but did not exceed 1 s (see Fig. 1C, middle).
Spectrogram generation
To generate spectrograms, we analyzed a window from −4 to 4 s around each spindle peak. Then we used the MATLAB spectrogram function to compute the spectrogram across the entire window (500 ms Hamming window, 350 ms overlap) during each spindle. Next, we subdivided this window into two 1 s epochs: (1) baseline: −2.5 to −1.5 s (see Fig. 1D, dashed line); and (2) spindle: −0.5 to 0.5 s (see Fig. 1D, solid line). During each spindle, we computed the power across frequency during the baseline and spindle epochs. Average power across the baseline and spindle epochs is plotted in Figure 1D (left). Then we calculated the % Power Change from the baseline epoch for each frequency band as follows:

The % Power Change is shown in Figure 1D (right). To avoid edge effects, we limited this plot to −3 to 2 s around the spindle peak.
Spike phase extraction
Similar methods for spike phase extraction were used to assess the spiking structure within a spindle cycle and across spindles. For both analyses, we first computed the same virtual signal used in spindle detection (see Fig. 1C) and then filtered the data in the spindle band (10–16 Hz; see Fig. 2C). Next, we applied the Hilbert transform and took the angle at each sample to get a continuous representation of the relative spindle phase (within cycles; see Fig. 2C, Phase Plot). To assess the absolute phase across a spindle epoch, the relative phase was unwrapped and centered such that the phase was 0 at the peak of the spindle and 10π at the fifth cycle after the peak (see Figs. 3B, 4C). For each spindle epoch and each neuron, the nearest phase was collected at each spike event.
Phase-locking value and preferred spindle phase
We calculated the phase-locking value to assess the degree of phase consistency of spiking within spindle cycles. Briefly, for a given neuron, across all spindle epochs, the phase of the spindle band LFP signal (see Fig. 2C, Phase Plot) was collected for each detected action potential (see Fig. 2C, Spikes) within a given cycle (e.g., [0, 2π]) yielding a distribution of spike phases (see Fig. 2D). Each phase value in this distribution was treated as a vector of magnitude 1 and angle equal to the phase as follows:

The average phase vector was computed according to the above equation (see Fig. 2D, red arrow). From this vector, we attained the phase-locking value (vector magnitude) and the preferred spindle phase (vector angle). We calculated these measures for each neuron and each spindle cycle.
Cross-correlation histogram (CCH) and pairwise synchrony
For each spindle epoch, we segmented the LFP into its individual cycles. Next, we collected all spike times in each of these cycles. To compute the CCH for a pair of neurons, we adapted previously reported methods (Engelhard et al., 2013). Briefly, both spike trains were binned into 1 ms time bins, and one neuron was initially treated as the reference neuron. For each spike from the reference neuron, we generated a count vector of the other neuron's spiking (t) relative to the reference spikes, where t ϵ (–50 ms, 50 ms). Each count vector was concatenated into a matrix. Next, we swapped reference neurons and built a similar count vector matrix but flipped each count vector (matrix row) to reflect the asymmetry in firing between the neurons. The resulting matrix of 0's and 1's had 101 columns (1 ms time bins from −50 to 50 ms) and rows equal to the total number of spikes from both neurons. A Gaussian kernel (5 ms) was used to smooth each row of this matrix, and then the average, smoothed count vector was computed. This count vector, or CCH (see Fig. 2B, raw CCH), represents the normalized frequency of cofiring between the two neurons. The raw pairwise correlation was taken to be the peak of this function.
Despite normalizing the CCH, an increase in pairwise correlations can arise from multiple sources, including true increases in pairwise correlations but also changes in excitability, firing rate, phase-locking to external events, etc. Since changes in these first-order statistics might influence second-order measures, such as correlations, we sought to find a method to isolate second-order changes (Palm et al., 1988; Brody, 1999). To accomplish this, we first used a shuffling procedure to isolate the effects of changes to first-order statistics on correlations, and then we subtracted them off. As when we were computing the raw CCH, we collected all spikes within each individual spindle cycle and selected one neuron in each neuron-pair to be the reference neuron. However, we then shuffled the second unit with respect to the spindle in which it fired. In this approach, both units maintain all of their first-order relationships with spindles and spindle cycles; for example, the number of spikes, phase-locking values, and phase preferences of individual units do not change after shuffling. However, the shuffling breaks the statistical relationship between the two neurons under examination. We repeated this shuffling 25 times and then computed the same normalized, smoothed count vector for the shuffled condition. This count vector represents the expected normalized frequency of the cofiring given both neurons' first-order statistics. Finally, we subtract this expected count vector (shuffled) from the unshuffled (raw) count vector, resulting in a corrected CCH (see Fig. 4B). It is important to note that the first-order statistics change as the spindle progresses (see Results; Fig. 3), but this shuffling is done within each cycle and accounts for these changes across the spindle. The correlation for each pair of neurons was then taken to be the peak of the corrected CCH.
Analysis of SO effects on spindle-induced correlations
Each spindle was binned according to its timing relative to SO. For each spindle, the preceding SO was collected. If there were successive SOs, only the final SO (i.e., the SO that was closest to the spindle) was collected. The time delay between the down state (i.e., the peak of the δ-band LFP) and the spindle (peak spindle-band LFP) was binned in 1.5 s bins with a 1 s overlap between bins (see Fig. 5A,B). Since this distribution of time delays is skewed, there are more spindles in the bins closer to SO than in subsequent bins. In order to accurately compare the distribution of pairwise correlations across these bins, we used a subsampling procedure in which we randomly sampled the nested and un-nested spindles using the minimum number of spindles across all bins. We repeated this sampling 100 times to generate a bootstrapped distribution of pairwise correlations and then used the mean of this distribution for each pair of neurons.
Two methods were used to analyze differences in the distributions of pairwise correlations across bins. The first method was designed to analyze trends across bins. We computed the mean and SD of the pairwise correlations for each spindle bin. Then we performed linear regression, where the mean or SD was a function of the time bins (see Fig. 5C, insets). The second method was designed to detect whether the distributions significantly changed. We focused on the differences between distributions in the first bin (0, 1.5 s) and the last bin (4.5, 6 s). To detect broad differences between the distributions, we used a Kolmogorov–Smirnov (KS) test. If the KS test was significant, we followed up with a Shift test (Rousselet et al., 2017) to assess how the distributions differed (see Fig. 5D). Briefly, the sextiles of each distribution are computed using the Harrell–Davis quantile estimator. Then differences in sextiles between the two distributions are computed with a bootstrapped estimate of CIs for each sextile difference. A multiple comparisons correction was then used to account for the five different estimators.
Analysis of novel motor engagement effects on spindle-induced correlations
To measure changes in spindle and nested spindle rates, we performed a slightly different procedure to detect spindles. Rather than creating an averaged, virtual LFP channel, we identified spindles for each individual electrode. We then followed the exact same procedure described in Spindle detection. For each spindle, the preceding SO was collected; the time delay between the previous down state (the peak δ-band LFP) and the spindle (peak spindle-band LFP) was computed, and spindles were considered nested if this time delay was <1.5 s (see Fig. 5B, dark blue). By detecting spindles individually on each electrode, we were able to collect and analyze more data for each animal; however, it should be noted that LFP channels are correlated within each rat. To determine whether there was a change in the rate and proportion of nested spindles, we used a full linear mixed-effects model as follows:

Briefly, this model computes the general effect of the SleepBlock (i.e., pretask vs post-task sleep) on changes to nested spindle rates or the proportion of spindles that are nested while accounting for rat-dependent effects, such as correlated LFP channels. The 1's in the above equation represent constant effects that are independent of the SleepBlock and the rat-dependent (SleepBlock|Rat) terms.
To measure the impact of novel motor task engagement on spindle-induced correlations, we analyzed the distributions of peak cofiring probabilities during the middle of spindles (–2π, 2π); we compared the distribution computed from spindles during the sleep block before motor engagement with the distribution computed from spindles during the sleep block after motor engagement. To detect broad differences between the distributions, we used a KS test. If the KS test was significant, we followed up with a Shift test (Rousselet et al., 2017) to assess how the distributions differed.
Results
Neural oscillation detection
We recorded extracellular LFP and spiking activity from M1 in 4 rats (for description of electrophysiology and recording probe details, see Materials and Methods; Fig. 1A). We recorded activity during Sleep Blocks in which animals were given the opportunity to sleep for ∼2 h. On average, rats were in NREM sleep for 65.2 min in total. During NREM sleep, we identified ongoing spindles (∼618 per rat) and SOs (∼701.25 per rat) using standard algorithms for automatic detection (Sela et al., 2016). Briefly, LFP channels were z-scored to standardize activity levels. The averaged signal was filtered in the spindle band (10–16 Hz) and a lower-frequency band (0.1–4 Hz). Periods in which spindle power exceeded an upper threshold for at least one sample and a lower threshold for at least 500 ms were identified as spindles (see Materials and Methods; Fig. 1C). Indeed, the average spectrogram of identified spindles (aligned to the spindle peak) revealed a time-frequency specific bump in spindle power compared with baseline epochs (Fig. 1D). Notably, this spectrogram also showed a bump in low-frequency power, which preceded spindles, in line with previous research on the close timing of SOs and spindles (Steriade et al., 1993a; Mölle et al., 2002; Cox et al., 2014). To detect SO, we identified all positive-to-negative zero crossings in the lower-frequency band along with the previous peaks and following troughs. The positive-to-negative zero crossings in which the time from the peak to the trough was at least 300 ms were considered SO. To minimize false detections, we focused on high amplitude SO with large peaks and troughs (see Materials and Methods; Fig. 1C).

Recording setup and sleep oscillation detection. A, Sleeping rat along with anatomic location of multielectrode arrays and example LFP and spiking data from one recording channel. B, Example of sleep classification in both power spectral density (PSD; top) and temporal spaces. Each dot represents the PSD in the δ (0.1-4 Hz) and γ (30-60 Hz) frequency bands during 6 s windows. A k-means classifier was used to cluster epochs into two clusters: Awake/REM (blue) and NREM (orange). The average LFP trace is plotted across a 2 h sleep session (blue). Identified sleep epochs are highlighted with orange boxes. C, Examples of detected sleep oscillations, highlighting the automatic methods used for detection. The broadband LFP (top) is decomposed into a lower-frequency band (middle) and spindle band (bottom) components. SOs must have had sufficient positive and negative amplitudes (black lines; middle) and sufficiently long durations (highlighted blue; middle). The spindle band envelope (purple line; bottom) must have exceeded an upper threshold (solid black line; bottom) for one sample and a lower threshold (dashed black line; bottom) for at least 500 ms. Purple represents the detected spindle duration. D, Average spindle-triggered waveform (black line; right) and spectrogram (heat map; right). Average spindle-triggered power spectrum (black line; left) and baseline power spectrum (dashed line; left). Solid and dashed boxes on the heat map represent the timing of the spindle and baseline periods used to calculate the power spectra.
Spindles modulate single-unit spiking
To observe spindle-neuron interactions, we aligned spike rasters to the peak of identified spindles. We noted the average oscillatory firing rate of the example unit in Figure 2A, B, which closely matched (with a phase shift) the average spindle waveform. The similarity of firing rate and LFP during spindles suggested that spike timing is modulated during ongoing spindles. To quantify spindle modulation of neural spiking, we extracted the spindle phase at each recorded action potential (Fig. 2C). To compute the spindle phase, we calculated the angle of the Hilbert-transformed, spindle band LFP (Fig. 2C, Phase Plot). Then we collected the phase triggered on each spike occurring within one cycle of the spindle peak (Fig. 2C, highlighted blue portion). This yielded a spike phase distribution (Fig. 2D, top), which was used to calculate the degree of phase-locking for each single unit. Briefly, each spike-triggered phase was converted to a vector of unit magnitude and in the direction of the triggered phase. Then the average vector was computed and the magnitude of this vector was taken as the phase-locking value, whereas the direction of this vector was taken as the preferred spindle phase (Fig. 2D, bottom). Most units had a preferred spindle phase between π/2 and π; that is, during the second half of the downward component of the spindle cycle (Fig. 2D, top). We found that neurons were significantly more phase-locked to spindles compared with control epochs (KS = 0.566, p = 1.02e-14; Fig. 2D, bottom).

Spindle modulation of spiking. A, An example of the average waveform for a single unit recorded across many channels using a custom polytrode probe. Inset, Spike waveforms (gray) on one channel of many spiking events along with the average waveform (red). This example unit is used for all panels in this figure. B, Spindle-triggered spiking for the example unit. The average spindle waveform (blue) is plotted with the average normalized firing rate (orange). A raster of spike times is displayed below. C, Phase extraction methods. Spindle band (10-16 Hz) LFP is plotted during a detected spindle (top) and is replotted immediately below (second from the top) with a finer time resolution. The Hilbert phase of the spindle activity is plotted below (second from the bottom) and fluctuates between –π and π. The spiking activity is displayed on the bottom (bars) and as dots in the spindle band and phase subplots. The highlighted portion of these plots extends from –2π to 2π and shows spikes that are used to compute the phase-locking value (C,D). D, The spike phase distribution for the example unit, plotted as a circular histogram (blue). The average phase vector is overlaid in red and copied below for clarity. The magnitude and direction of this vector are defined as the phase-locking value and preferred spindle phase, which are collected for all units. E, Summary of the phase-locking value (bottom) and preferred spindle direction (top) for all units. Gray bars (bottom) represent the phase-locking to the spindle band during control epochs. *Significant difference between the distributions.
Spindles increase single-unit phase-locking
We next quantified changes in phase-locking dynamically across spindles. We segmented spindles (Fig. 3A, right) and control epochs (Fig. 3A, left) into their component cycles and separately generated a spike phase distribution for each cycle. This process is presented for an example unit in Figure 3A, in which spike phase distributions were generated and displayed for two different spindle cycles: one at the peak of spindles (–2π, 0; Fig. 3A) and one at the tail of spindles (8π, 10π; Fig. 3A). The average preferred phase across neurons did not change during spindles, but the average spike count and phase-locking increased near the spindle peaks (Fig. 3B,C). We quantified these dynamics by grouping cycles into three categories as follows: (1) CTRL, the two cycles at the center of the control epochs; (2) TAIL, the two cycles farthest from the spindle peaks; and (3) PEAK, the two cycles nearest the spindle peaks (Fig. 3C). A repeated-measures ANOVA confirmed that these categories were significantly different for spike counts (F(2,196) = 15.372, p = 6.283e-07) and phase-locking (F(2,196) = 164.21, p = 1.298e-42), and a circular Watson-Williams test confirmed that the preferred phase was not significantly different across these groups (F(2,196) = 0.399, p = 0.671). Post hoc, paired t tests confirmed that spike counts were significantly increased near the peak of spindles (PEAK vs TAIL, t(98) = 3.154, p = 2.136e-03); spike counts were also increased at the spindle tails relative to during control epochs (TAIL vs CTRL, t(98) = 4.169, p = 6.611e-05). Likewise, phase-locking increased near spindle peaks (PEAK vs TAIL, t(98) = 13.990, p = 4.299e-25) and was significantly larger than control epochs, even 5 cycles away from the spindle peaks (TAIL vs CTRL, t(98) = 3.520, p = 6.574e-04).

Spindle cycle analysis of phase-locking. A, Generation of the spike phase distribution across spindle cycles. Spike-triggered phases are extracted from single-unit spiking during specific spindle cycles. Phases are aggregated across actual spindle epochs (right) or control epochs (left). Blue represents analyses of actual spindles. Black represents analyses of control spindle. B, Summary of all neurons' spike phase distribution statistics across spindle cycles. The average spindle band waveform for each spindle cycle (top) is plotted along with the average spike rate (second from top), preferred spindle direction (second from bottom), and phase-locking value (bottom). Blue lines indicate averages during actual spindle epochs. Black/gray lines indicate averages during control epochs. Error bars indicate SEM. C, Summary of spiking dynamics. Spike rates, preferred spindle directions, and phase-locking values are combined into three categories: (1) CTRL, the two cycles at the center of the control epochs; (2) TAIL, the two cycles farthest from the spindle peaks; and (3) PEAK, the two cycles nearest the spindle peaks. Bar plots represent the newly categorized data. *Significant differences between the categories. D, Relationship between phase-locking and spike count across neurons. Each neuron's phase-locking value and spiking rate in the PEAK are shown as a scatter plot (left) along with each neuron's change in phase-locking value and spiking rate (PEAK – TAIL; scatter plot, right). Regression lines are superimposed on the scatter plots along with Pearson correlation coefficients and associated p values.
We wondered whether the neurons that increased their firing rates during spindles also increased their phase-locking. To address this question, we ran a correlation analysis and found that there was a significant correlation between the change (PEAK – TAIL) in spike count and the change in phase-locking value (Pearson's r = 0.351, p = 3.632e-04; Fig. 3D, right). This implied that there was significant overlap in the populations of neurons that modulated their firing rates and spike timing during spindles. Importantly, there was no correlation between the raw spike count and the raw phase-locking value of neurons (Pearson's r = 0.0121, p = 0.905; Fig. 3D, left), assuaging anyconcerns that this finding is driven by higher estimation of phase-locking value for higher firing neurons, which is known to happen with small sample sizes (Vinck et al., 2010).
Spindles increase pairwise synchrony
To quantify pairwise synchrony changes as spindles evolved, we followed a similar procedure of segmenting spindles into their component cycles, then independently generated a CCH for every pair of neurons in each spindle cycle (see Materials and Methods; Fig. 4A, left). Each bin in the CCH represents the probability of the two neurons under examination cofiring with a specific time difference; the peak of the raw CCH (Fig. 4B, left) is a normalized measure of the degree of cofiring for a pair of neurons. Given the increase in phase-locking near the peak of spindles, one would expect a corresponding increase in the raw pairwise cofiring probability, which is what we observed (data not shown). However, changes in firing rate or phase-locking of the individual neurons can influence this measure, and we wanted to know whether spindles modulate any additional correlation structure across neurons beyond what is expected from the first-order changes. We isolated changes in pairwise correlations during spindles by using a shuffling procedure, which maintained firing rates and phase-locking within spindle cycles but broke correlation structure across neurons (see Materials and Methods; Fig. 4A, right). This procedure yielded a shuffled CCH (Fig. 4B, middle), which reflected the expected pairwise correlations in a spindle cycle given the firing rates and spindle phase relationships of the two neurons being examined. We then subtracted the shuffled CCH from the raw CCH, to construct a corrected CCH. The peak of this corrected CCH measured the degree of cofiring that exclusively resulted from pairwise correlations (Fig. 4B, right).

Spindle cycle analysis of synchrony. A, Generation of the CCH. For a pair of units, relative spike times are extracted during each spindle cycle. Spike times are then aggregated across spindles relative to one another. Additionally, a shuffled CCH is constructed using a similar procedure. Relative spike times are extracted during specific spindle cycles, but one neuron's spikes are shuffled across spindle epochs. B, CCH correction. Within each spindle cycle, the shuffled CCH is subtracted from the raw CCH to generate a corrected CCH. The peak, and time of peak (red arrows) are collected for each pair of neurons in each spindle cycle. C, Summary of all neurons' corrected CCH statistics across spindle cycles. The average spindle band waveform for each spindle cycle (top) is plotted along with the average corrected CCH peak (middle) and time of peak (bottom). Blue lines indicate averages during actual spindle epochs. Black/gray lines indicate averages during control epochs. Error bars indicate SEM. D, The distribution of peak cofiring probability for controls (black) and spindles (purple) plotted as a CDF (top). Gray lines divide the distributions into sextiles (top). The difference in sextile dividers is plotted with 95% CIs as error bars (bottom). E, The peak and time of peak are reproduced for the same categories as in Figure 3D. *Significant difference between the distributions.
Interestingly, the corrected pairwise correlations revealed similar dynamics during spindles. As before, we compared three groups: (1) CTRL, the two cycles at the center of the control epochs; (2) TAIL, the two cycles farthest from the spindle peaks; and (3) PEAK, the two cycles nearest the spindle peaks (Fig. 4C,E). We used a repeated-measures ANOVA to determine that there were differences in the peak of the CCH (F(2,3014) = 49.118, p = 1.020e-21) and the time of this peak (F(2,3014) = 52.137, p = 5.617e-23) across the three categories. From the TAIL to the PEAK of spindles, the cofiring probability increased (paired t test, t(1507) = 7.574, p = 6.302e-14) and the absolute time of peak cofiring decreased (paired t test, t(1507) = 7.086, p = 2.130e-12). Likewise, both measures were significantly different from control epochs (CTRL), even at the spindle TAILs (paired t tests, peak cofiring: t(1507) = 2.144, p = 0.0320; time of peak cofiring: t(1507) = 2.783, p = 0.0055). Together, these dynamics reflected an increase in pairwise synchrony during spindles that is greater than expected from independent neuron changes. Notably, the increase in neuron synchrony was not limited to only highly correlated neuron pairs; rather, all pairwise correlations increase during spindles (Fig. 4D).
SOs narrow the distribution of spindle-induced correlations
A large body of work has focused on the relationship between spindles and SOs, suggesting that nested spindles, which occur during the up state of SOs, are particularly important for learning and plasticity (Mölle et al., 2009; Niknazar et al., 2015; Latchoumane et al., 2017). This work led us to hypothesize that the spiking correlation structure might be different for nested and un-nested spindles. To investigate the role of nesting, we binned spindles (bin width: 1.5 s; step size: 500 ms) based on their timing relative to SO (Fig. 5A,B). The first bin (0-1.5 s) included precisely nested spindles, with subsequent bins containing spindles with increasing temporal distance from an SO. Next, we examined the distribution of pairwise correlations (peak cofiring probabilities of the corrected CCH) during the spindle peak (–2π, 2π) in each time bin; these distributions are plotted as cumulative density functions (CDFs) in Figure 5C.

Effect of nesting. A, Timing of spindles relative to SOs. B, Example of binning spindles based on timing relative to SO in 1 animal. Bar graph represents the distribution of time delays. Windows representing the spindle bin closest to (dark blue rectangle), and farthest from (light blue rectangle) SOs, are overlaid. Blue dotes represent intermediate window starts. The color gets lighter as the window start gets farther from the SOs. C, The distribution of spindle-induced pairwise correlations for each bin. Colors match the window colors in B. The average pairwise correlation across bins is plotted with a linear fit (left inset), and the SD of pairwise correlations across bins in plotted with a linear fit (right inset). D, The distributions of spindle-induced pairwise correlations are reproduced for the bins closest to SOs (0, 1.5) and farthest from SOs (4.5, 6) (top). Gray lines divide the distributions into sextiles (top). The difference in sextile dividers is plotted with 95% CIs as error bars (bottom). *Significant difference between the distributions.
Qualitatively, the distributions appear to “narrow” for spindles closer to SO (Fig. 5C). To quantify trends in the distributions, we performed linear regression on the mean and SD of the pairwise correlations across time bins: the average pairwise correlation did not change linearly across time bins (Fig. 5C, left inset; linear regression model, r2 = 0.35, p = 0.070), but the SD of the pairwise correlations decreased across time bins (Fig. 5C, right inset; linear regression model, SD + 0.00041 × time from SO + 0.0065, r2 = 0.928, p = 7.52E-08).
Additionally, we used nonparametric statistics to detect differences in the distributions of pairwise correlations between the bin closest to an SO (dark blue, [0,1.5 s]) and the bin farthest from SO (light blue [4.5,6 s]). The CDFs for these distributions are reproduced in Figure 5D for clarity. A KS test revealed a significant difference between these distributions (KS = 0.084, p = 3.98e-05). We then split the distributions of pairwise correlations into sextiles (Fig. 5D, top, gray lines) and computed the difference in the sextile dividers (Fig. 5D, bottom). This revealed a pattern in which the lowest pairwise correlations significantly increased during spindles near SO, but the highest pairwise correlations significantly decreased during spindles near SO.
Notably, nesting did not affect other spindle-induced changes; we compared the distributions of spike counts, preferred phases, and phase-locking values during the peak of spindles closest to[0, 1.5 s] and farthest from [4.5, 6 s] SOs. KS tests did not identify any significant differences between spindles near and far from SO (KS = 0.061, p = 0.9916; KS = 0.111, p = 0.5493; KS = 0.094, p = 0.754, respectively).
Novel motor task engagement increases nested spindle-induced correlations
We next sought to explicitly test whether engaging in a novel motor task might affect the correlation structure during spindles. Given the large body of work linking spindle and SO interactions to learning and plasticity (Mölle et al., 2009; Niknazar et al., 2015; Latchoumane et al., 2017), we focused our analysis on those spindles closest to SO (i.e., precisely nested spindles within 1.5 s of an SO). To measure the impact of novel motor practice on nested spindle-induced correlations, we separately analyzed sleep blocks before and after each rat performed a skilled forelimb reach-to-grasp task (see Materials and Methods).
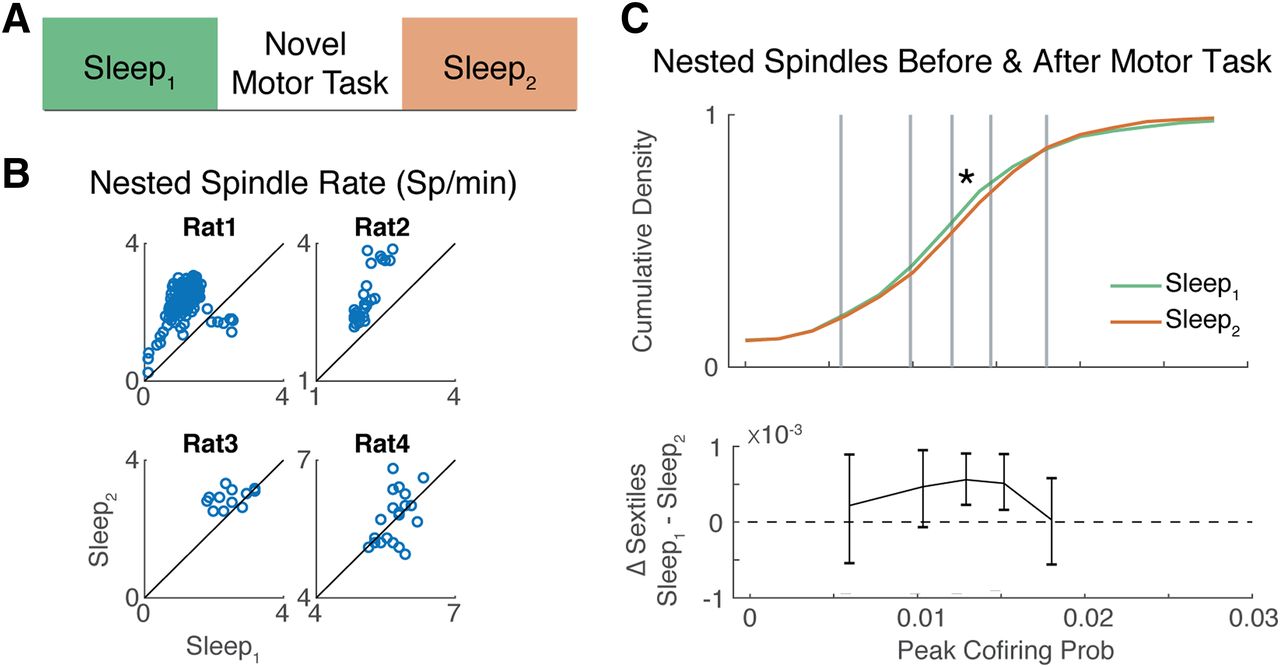
We first used a linear mixed-effects model to determine whether there was a significant change in the rates of nested spindles (and proportion of nested spindles) after practicing a novel motor task while controlling for individual animal differences (for details, see Materials and Methods). Notably, we observed an increase in the nested spindle rate (t(566) = 2.90, p = 3.38e-03) from Sleep1 to Sleep2 (Fig. 6B) and an increase in the proportion of spindles that were nested (t(566) = 6.57, p = 1.15e-10). We then examined the distribution of pairwise correlations (i.e., peak cofiring probability of the corrected CCH) during the spindle peak ([−2π, +2π]); these distributions were plotted as CDFs in Figure 6C. A KS test revealed that there was a significant difference between these distributions (KS = 0.052, p = 0.031); we then segmented the distributions of pairwise correlations into sextiles (Fig. 6C, top, gray lines) and computed differences in the sextile dividers computed during Sleep1 and Sleep2 (Fig. 6C, bottom). This revealed a rightward shift in the distribution of pairwise correlations in Sleep2 relative to Sleep1. However, this increase in pairwise correlations was not equal across the distribution; it had a skewed effect where the increase was limited to the middle of the distribution of pairwise correlations. These analyses revealed both large-scale changes in the structure of sleep oscillations and targeted changes in the correlation structure of nested spindles after practicing a novel motor task.

Effect of novel motor task engagement on nested spindles. A, Description of timeline. Each rat's sleep was monitored before (Sleep1, green) and after (Sleep2, orange) engaging in a novel motor task. B, Nested spindle rates for each rat plotted as a function of Sleep1 and Sleep2. Each dot indicates spindles detected on a different electrode. Dots above the diagonal indicate an increase in the nested spindle rate. C, The distribution of nested spindle-induced pairwise correlations for Sleep1 and Sleep2 (top). Gray lines divide the distributions into sextiles (top). The difference in sextile dividers is plotted with 95% CIs as error bars (bottom). *Significant difference between the distributions.
Discussion
In this study, we investigated the relationship between M1 neural firing and LFP oscillations during sleep. We focused on the structure of neural spiking during spindles, which are thought to be important for consolidation and for promoting neural plasticity after learning a new skill (Fogel and Smith, 2006; Nishida and Walker, 2007; Barakat et al., 2011; Johnson et al., 2012; Ramanathan et al., 2015; Kim et al., 2019). We found that neurons in M1 fired at a preferred phase of the spindle; by segmenting spindles into their component cycles, we determined that such phase-locking was more pronounced at spindle peaks. Moreover, neural synchrony shared similar dynamics during spindles; the distribution of pairwise correlations reached its maximum at the peak of a spindle event. Interestingly, this correlation structure was modified by a spindle's temporal proximity to an SO. Spindles that were nested within SOs exhibited a narrower distribution of correlations. In contrast, the distribution of pairwise correlations was broader during spindles that were temporally far from SOs. Notably, after animals engaged in a novel motor task, pairwise correlations during nested spindles increased, suggesting that changes in correlated firing during nested spindles may play an important role in offline motor learning.
Spindles and changes in neural synchrony
One of our key results was that there were changes in both the phase-locking and the correlation structure of spiking during spindle cycle dynamics. We found that spiking activity in M1 became significantly more structured with each spindle cycle, leading to maximum changes at spindle peaks. Spike correlations have long been thought to drive neuroplasticity (Hebb, 1949); and more recently, spike timing-dependent plasticity models (Bi and Poo, 1998, 2001; Shulz and Jacob, 2010; Feldman, 2012) have been developed, which emphasize the role of precise spike timing in neuroplasticity. Importantly, pairs of spikes occurring within a spike timing-dependent plasticity learning window (∼50 ms) lead to direct, predictable changes in synaptic efficacy, but additional factors, such as firing rates and network activity, also modify this learning window. In this study, we demonstrated that spindles increased firing rates (Fig. 3B,C) and modulated the precise (∼5 ms) timing of spiking activity relative to ongoing spindles (Fig. 3B,C) and relative to other M1 neurons (Figs. 4C-E, 7A). The reported changes in neural synchrony at spindle peaks are also consistent with previous findings in which reactivations of task-related neural activity patterns are time- and phase-locked to spindles (Ramanathan et al., 2015; Kim et al., 2019), and suggest that reactivation events likely occur near spindle peaks. The increase across the distribution of pairwise correlations suggests that spindles trigger a general increase in local functional connectivity.

Summary of spindle-induced correlations and interactions with SO and novel motor engagement. A, Idealized distributions of pairwise correlations during control epochs (black) and spindle epochs (blue). Gray lines indicate sextile dividers. Blue arrows indicate a rightward shift in the distribution of correlations across all sextiles during spindles. B, Idealized distributions of spindle-induced pairwise correlations near SO (dark blue) and far from SO (light blue). Gray lines indicate sextile dividers. Dark blue arrows indicate a tightening of the distribution of correlations for spindles nearer to SO. C, Idealized distributions of spindle-induced pairwise correlations pre-engagement (green) and post-engagement (orange) in a novel motor task. Gray lines indicate sextile dividers. Orange arrows indicate a rightward shift in the middle of the distribution of correlations.
Sources of spindle-induced synchrony
Correlation measurements are notoriously sensitive to a variety of factors, including firing rates, excitability, sample sizes, and other first-order effects, such as spike timing relative to external stimuli or internal LFP oscillations (Brody, 1999; Tchumatchenko et al., 2011; Engelhard et al., 2013; Barreiro and Ly, 2017). It can be difficult to fully disentangle second-order correlations from the impact of first-order changes, but we took several steps to do just that. First, we compared correlations for the same neuron pairs across conditions (i.e., during control epochs and across spindle cycles). Second, we used a shuffling procedure that preserved first-order statistics, including spike counts and phase-locking values of individual neurons while specifically breaking second-order correlations across neuron pairs. This shuffling procedure allowed us to analyze the following: (1) raw correlations, which are influenced by both first- and second-order statistics; (2) shuffled correlations, which reflect the expected correlations given the first-order statistics; and (3) corrected correlations, which reflect the pure second-order statistics.
These three correlation measures give us insight into the sources of spindle-induced correlations. The raw correlations increased during spindles; importantly, these raw values reflected the true activity correlations that neurons experience and likely influence neuroplasticity. Predictably, the shuffled correlations also increased during spindles. This suggested that first-order changes, such as the increase in firing rates and phase-locking (Fig. 3B,C), underlie some of the increases in correlations during spindles. Importantly, the corrected correlations also increase during spindles. This suggested that, in addition to the impact of first-order changes, there were also second-order effects that increase pairwise correlations. These likely reflect increases in shared input to the M1 neurons during spindles (Destexhe et al., 1997; Steriade, 2000; Tchumatchenko et al., 2011), but could also reflect broad changes in brain state or synaptic efficacy during spindles (Tchumatchenko et al., 2011).
Interaction between SOs, spindles, and behavior
SOs are one of the most prominent signals during sleep, and several theories have been put forth about their functional roles (Rasch and Born, 2013; Genzel et al., 2014). One framework that connects learning, SOs, spindles, and their interaction is the active system consolidation hypothesis. This theory posits that a functional role for sleep oscillations is to coordinate and organize spiking activity across different brain regions (for a comprehensive review, see Rasch and Born, 2013). This has mostly been studied in the declarative memory system, where cortical SOs nest thalamocortical spindles, which nest hippocampal sharp-wave ripples. Such hierarchical nesting is proposed to coordinate activity across brain regions, thereby enabling the transfer of stereotyped spiking patterns from short-term memory in the hippocampus to long-term memory storage in the PFC (Rasch and Born, 2013; Latchoumane et al., 2017). A possible parallel to this memory transfer system has been found in the motor system, where SOs and spindles have been shown to be time-locked to reactivated activity patterns from recently learned motor tasks (Barakat et al., 2011; Ramanathan et al., 2015; Laventure et al., 2016; Boutin et al., 2018; Kim et al., 2019).
We found that the temporal proximity of SO and spindles modified the distribution of neural correlations (Fig. 5C,D). When spindles were temporally distant from an SO, the distribution of pairwise correlations contained both larger and smaller values. In contrast, when spindles were temporally close to an SO, the distribution of pairwise correlations transiently narrowed. Interestingly, there appeared to be a linear relationship between the exact temporal proximity and the extent of distribution tightening. To understand the functional role of this narrowing, it is helpful to focus on the tails of the correlation distribution. Neurons that were rarely active together (the lowest correlation pairs) began to cofire more often, whereas more stereotyped neural activity (the highest correlation pairs) decreased. The effect of narrowing the correlation distribution is consistent with the exploration of neural activity patterns. This novel exploration function is in line with research that demonstrates a link between sleep and improvements in generalization and insight (Fenn et al., 2003; Wagner et al., 2004; Ellenbogen et al., 2007; Djonlagic et al., 2009). Mechanistically, SOs are known to reflect a depolarizing current that causes a brief increase in neural firing (Luczak et al., 2007). It is possible that this transient depolarization modifies the correlation structure by adding entropy to the network, causing an increase in new cofiring patterns. In contrast, the spiking correlation structure during independent spindles likely reflects the “baseline” cortical connectivity (Niethard et al., 2018).
In this study, we were able to explicitly link changes in pairwise correlations during nested spindles to behavior (Fig. 6). We found that there was a large increase in the rate and proportion of nested spindles after novel motor engagement; this finding is consistent with several studies that have observed an increase in spindle rates after motor engagement and learning (Barakat et al., 2011; Ramanathan et al., 2015; Laventure et al., 2016; Boutin et al., 2018; Kim et al., 2019). Moreover, we found that there was an increase in pairwise correlations during nested spindles after novel motor task engagement. In addition to inducing novel correlation patterns, nested spindles may support motor learning by altering the precise correlation structure after motor engagement, thereby altering functional connectivity in M1. These results suggest a possible mechanism through which nested spindles might aid consolidation after motor learning.
Interestingly, the active system consolidation framework proposes that spindles nested within SOs are a distinct phenomenon from nonoverlapping SO or spindles. Several studies have accordingly categorized SO and spindles as either nested or un-nested and observed significant differences between these groups (Latchoumane et al., 2017; Niethard et al., 2018). In this study, we compared spindles across a range of time delays after SO and, using this approach, we observed a linear progression where the distribution of pairwise correlations appears to become more narrow as spindles occur closer to SO. This suggests that there may not be a stark nonlinear difference between nested and un-nested spindles.
In conclusion, our results demonstrate that the fine-scale structure of neural activity in M1 is modulated by the interaction of spindles and SOs, as well as by engagement in a novel motor task. These findings help build a framework to study the relationship between changes in precisely structured spiking activity and the interaction of spindles and SOs; they also suggest candidate offline processing mechanisms that may drive synaptic plasticity following motor learning.
Footnotes
- Received November 12, 2019.
- Revision received April 26, 2020.
- Accepted April 27, 2020.
This work was supported by Department of Veterans Affairs, Veterans Health Administration, Rehabilitation Research and Development Service Award 1I01RX001640-01A1, National Institute of Neurological Disorders and Stroke of the National Institutes of Health Award K02NS093014, National Institutes of Health BRAIN Initiative Award NS094375, National Science Foundation Graduate Research Fellowship, and American Heart Association Predoctoral Fellowship. The reported content is solely the responsibility of the authors and does not necessarily represent the official views of these agencies or organizations. We thank Dhakshin Ramanathan for help with data collection and data transfer; Jaekyung Kim for help spike sorting; and Jaekyung Kim, Nikhilesh Natraj, and Tanuj Gulati for insightful feedback during analysis.
The authors declare no competing financial interests.
- Correspondence should be addressed to Karunesh Ganguly at karunesh.ganguly{at}ucsf.edu
- Copyright © 2020 the authors