


Abstract
Aims: The purpose of the present study was to examine the effects of stress on alcohol drinking behaviour in male and female mice with a genetic predisposition toward high alcohol preference (HAP2 line). Methods: Alcohol-naïve male (n = 22) and female (n = 23) HAP2 mice were assigned to a restraint stress or no stress control group. Stress was initially applied for 2 h per day on 10 consecutive days. All mice were then given daily 2 h limited-access to a 10% v/v alcohol solution or water, with food freely available, for 21 days. Over the next 20 days, 2 h restraint stress was applied every other day immediately prior to 2 h access to alcohol and water. On intervening days, all mice received 2 h access to alcohol and water in the absence of stress. Following this phase of the study, the effects of restraint stress on acoustic startle reactivity was assessed in all mice. Finally, all mice were given continuous access to alcohol and water for 8 days. Results: Ten days of prior stress exposure did not significantly alter the acquisition of limited-access alcohol drinking. Subsequent exposures to intermittent restraint stress produced subtle but consistent effects on alcohol intake that differed in males vs females: stress increased alcohol intake in males and decreased alcohol intake in females. Restraint stress did not alter acoustic startle reactivity. Under continuous-access conditions after stress termination, the stress-induced increase in alcohol intake in males became more robust; however, in females, alcohol intake returned to the control group level. Conclusions: These findings suggest that the effects of stress on alcohol drinking in mice with a genetic predisposition toward high alcohol preference depend on sex.
(Received 18 August 2005; first review notified 27 September 2005; in final revised form 20 October 2005; accepted 21 October 2005)
INTRODUCTION
It is generally acknowledged that both genetic and environmental factors contribute to the propensity to drink alcohol (George, 1987; Shuster, 1990; Pohorecky, 1991; Phillips et al., 1994; Reich et al., 1998; Adams et al., 2000; Oroszi and Goldman, 2004). Exposure to stress is one environmental factor that has long been thought to increase alcohol drinking behaviour and predispose people toward the development of alcoholism (Horton, 1943; Conger, 1956; Pohorecky, 1981, 1991; Volpicelli et al., 1999). One popular theory is that stress increases alcohol consumption because alcohol relieves the psychological and physiological consequences of stress, such as tension, anxiety, or physical pain (Conger, 1956; Volpicelli, 1987). However, a direct link between stress and alcohol drinking has not been established in humans, in part, due to the complexity in controlling for variables such as genetics, history of alcohol drinking, and history of stress exposure (Pohorecky, 1991).
Animal models have been used to study various factors under controlled conditions that may influence the consumption of alcohol. Although much progress has been made over the last few decades in understanding interactions between stress and alcohol consumption (see reviews by Pohorecky, 1981; Sillaber and Henniger, 2004), there are many inconsistent findings in the animal literature with regard to stress effects on alcohol drinking. For instance, in the rat, stress has been shown to increase (e.g. Volpicelli et al., 1990; Lynch et al., 1999), decrease (e.g. Champagne and Kirouac, 1987), or have no effect (e.g. Myers and Holman, 1967) on alcohol drinking. Evidence in rodents suggests that the way in which stress influences alcohol drinking may depend on many factors such as the type of stress (Myers and Holman, 1967; Anisman and Waller, 1974; Roske et al., 1994), timing of alcohol availability in relation to stress application (Casey, 1960; Nash and Maickel, 1985; Bowers et al., 1997), and subject's initial preference for alcohol prior to stress application (Bond, 1978; Rockman et al., 1986; Volpicelli et al., 1990).
Many of the equivocal aspects of stress effects on alcohol drinking are possibly due to interactions between genetic and environmental factors. Evidence in both humans and animals suggests that genetic variation in the response to stress, to alcohol, or the interaction between the two may increase alcohol consumption and the risk for alcoholism (Waltman et al., 1994; Roberts et al., 1995; Gianoulakis et al., 1996; Phillips et al., 1997; Wand et al., 1999, 2001; Wust et al., 2000; Dai et al., 2002; O'Callaghan et al., 2002; Zimmermann et al., 2004; van der Kam et al., 2005). For instance, a stress-induced increase in alcohol drinking has been shown in mice with genetic disruption of the type 1 receptor for corticotropin releasing hormone (CRH), one of the primary hormones that drives the hypothalamic–pituitary–adrenal (HPA) axis response (Sillaber et al., 2002). However, the increase in alcohol drinking in these mice lacking a functional CRH1 receptor was seen only after repeated exposures to stress and had a delayed onset.
Some of the most exciting tools for studying genetic factors that underlie alcoholism are rodent lines that have been selectively bred for differences in innate alcohol preference (see reviews by Phillips et al., 1989; Dudek and Underwood, 1993; Li and McBride, 1995). Selective breeding takes advantage of the fact that there are individual differences in the genetic propensity to consume alcohol; some animals will voluntarily consume large amounts of alcohol, whereas others will consume little or no alcohol. Selectively bred rodent lines model both social drinkers/teetotallers and heavy drinkers/alcoholics and are useful for studying the genetic and biological factors that may contribute to alcohol drinking behaviour in humans. Furthermore, selectively bred rodent lines are extremely valuable in elucidating the ways in which environmental factors such as stress may interact with a genetic predisposition toward alcohol drinking behaviour.
In one prior study, the effects of stress on alcohol drinking were examined in two pairs of rat lines selectively bred for differences in alcohol preference (Chester et al., 2004). The alcohol-preferring (P) and alcohol-non-preferring (NP) lines were derived from a foundation stock of outbred Wistar rats, whereas the high-alcohol-drinking (HAD1) and low-alcohol-drinking (LAD1) lines were selected from a foundation stock of outbred N/NIH rats. Male rats from the P/NP and HAD1/LAD1 lines were exposed to 10 consecutive days of unpredictable restraint stress and alcohol intake was examined both during and following the period of restraint stress. The results indicated that alcohol intake was moderately reduced in the P and HAD1 rats and unchanged in the NP and LAD1 rats during stress application. Following termination of stress, P but not HAD1 rats showed an immediate, transient increase in alcohol intake and the NP but not LAD1 rats showed a delayed increase in alcohol intake. These findings suggested that a stress-induced change in alcohol intake is dependent on both genetic propensity toward alcohol drinking and time in relation to stress application.
The purpose of the present study was to examine the effects of restraint stress on alcohol drinking behaviour under various conditions in a mouse line selectively bred for high alcohol preference (HAP2 line). The HAP2 mouse line was selected for high alcohol preference under continuous alcohol access conditions similar to that used to derive the selectively bred P and HAD1 rat lines (Grahame et al., 1999a). HAP mice drink significantly more alcohol under limited-access conditions relative to their low-alcohol-preferring (LAP) counterparts, a finding that indicates the genetic propensity toward high alcohol intake in the HAP line is robust under various alcohol-access situations (Grahame et al., 1999b). In the current study, we investigated the effect of prior restraint stress on the initiation of limited-access alcohol drinking and then examined the immediate and delayed effects of subsequent exposures to restraint stress on established limited-access alcohol drinking. The effect of the prior history of stress on continuous-access alcohol drinking was also examined. Another primary goal of the present study was to determine if the effects of stress differed in male vs female HAP2 mice. There is abundant evidence that males and females respond differently to stress (e.g. Kennett et al., 1986; Haleem et al., 1988; Jones et al., 1998; Faraday, 2002; Chadda and Devaud, 2005) and to alcohol (see review by Devaud et al., 2003). However, there have been only a few contradictory reports of sex differences in stress-induced alcohol drinking behaviour in adult rats (Clay, 1964; Adams, 1995) and no reports in mice.
METHOD
Subjects
Subjects were adult, alcohol-naïve male (n = 22) and female (n = 23) mice from the 19th generation of selection for high alcohol preference (HAP2). Mice arrived from the Veterans Administration Medical Center in Indianapolis at ∼8 weeks of age and were between 12 and 20 weeks old at the beginning of the study. The selectively bred HAP2 mouse line was derived from a foundation of outbred Hs/Ibg mice (Boulder, CO) at the Indiana Alcohol Research Center. In every generation of selection, high alcohol preference was established during a 4 week, 24 h, free-choice preference test (Grahame et al., 1999a). During the preference test, mice were given free access to food and two 25-ml graduated cylinders, one that contained 10% alcohol (v/v) in distilled water and the other that contained distilled water. Mice that drank >5.0 g/kg alcohol per day (averaged over the 4 week test period) were selected to be breeders for the next generation of HAP2 mice (Grahame et al., 1999a).
Procedure
Mice were housed in polycarbonate cages (11.5 × 7.5 × 5 in.) with aspen wood shavings in groups of three to four per cage. At 7–10 days prior to the start of the experiment, animals were singly-housed in the polycarbonate cages, with free access to water and lab chow (Rodent Lab Diet 5001, Purina Mills Inc.). Experimental procedures were conducted during the light phase of a 12:12 light/dark cycle (lights on at 07:00/off at 19:00).
The experimental protocol consisted of five consecutive phases: 10 days of restraint stress, 21 days of 2 h limited-access drinking, 20 days of 2 h limited-access drinking with stress applied every other day, 1 day of acoustic startle testing, and 8 days of 24 h, continuous-access drinking.
Restraint stress
Male and female HAP2 mice were counterbalanced based on family (litter) so that an equal number of animals from a particular family would be assigned to either the experimental (Stress) or control (No Stress) groups. Mice in the Stress group were moved to an adjacent room during the period of stress application to avoid disrupting the No Stress group. The No Stress group remained undisturbed in their home cages during this phase of the experiment except for routine handling. The stressor consisted of removing mice from their home cage and placing them in a Plexiglas restraint tube (diameter: 25.4 mm; length: 83 mm) for 2 h. Restraint stress was applied at the same time each day (between 09:00 and 11:00) for 10 consecutive days. At the end of each 2 h restraint period, mice in the Stress group were weighed and returned to the colony room with free-access to food and water in their home cages.
Two hour free-choice drinking—acquisition
On the last day of stress application, standard water bottles were removed and replaced with a single 25-ml plastic graduated cylinder, fitted with a steel sipper tube, filled with tap water in order to acclimate mice to drinking from graduated cylinders. Each water cylinder was alternately placed in either the left or right position in the cage top. The following day, mice in both the Stress and No Stress groups were presented with a 10% alcohol solution and tap water for 2 h (between 09:00 and 11:00) each day for 21 days. At the end of each 2 h drinking period, alcohol and water intakes were measured by weighing the cylinders, mice were weighed, and fluids were replaced. Water-filled cylinders were returned to the cage top and placed in the alternate left/right position to control for a potential positional preference. Two cylinders filled with alcohol and water were placed on an empty cage and manipulated and weighed daily in the same fashion as those on the experimental cages to account for evaporation and leakage. The amount of fluid lost from these cylinders was subtracted from the amount of fluid consumed by each mouse.
Two hour free-choice drinking—intermittent stress application
Following the 21 days of limited-access drinking, 2 h restraint stress was applied (between 09:00 and 11:00) to mice in the Stress group every other day for 20 days (10 restraint sessions). Water tubes were removed from mice in the No Stress group to control for the lack of water access in the Stress group during restraint. Immediately following the 2 h restraint period, both the Stress and No Stress groups were given free choice between alcohol and water in a 2 h drinking session. On intervening days, no stress was applied and all mice received a 2 h free-choice drinking session between 09:00 and 11:00.
Acoustic startle test
Prior studies in rats have shown that the acoustic startle response is a sensitive index of increased arousal produced by anxiety or stress (Davis, 1990; Garrick et al., 2001, Faraday, 2002; Conti and Printz, 2003). The purpose of this phase of the study was to determine if mice in the Stress groups showed increased startle reactivity immediately following 2 h restraint stress. It was hypothesized that stress-induced changes in startle reactivity might be related to alcohol drinking behaviour, particularly on the days in which the 2 h drinking session immediately followed restraint stress. One day after the final 2 h drinking session during the intermittent stress phase, mice in the Stress groups received one additional 2 h restraint session and acoustic startle reactivity was assessed immediately following restraint in balanced groups of mice from the Stress and No Stress control groups. No clear group differences in startle reactivity were seen in either male or female HAP2 mice. Consequently, these data are not presented.
Continuous-access free-choice drinking
One day following acoustic startle testing, mice in both the Stress and No Stress groups received continuous-access free-choice between alcohol and water for 8 days. Alcohol and water intake was measured between 09:00 and 11:00.
Data analyses
Alcohol intake was expressed as grams of 10% alcohol per kilogram of body weight (g/kg/BW) and as percent alcohol preference (ml 10% alcohol solution/ml total fluid consumed). Alcohol and water intakes were averaged across 2- or 3-day blocks to reduce day-to-day variability in drinking patterns. Prior to averaging data across days, alcohol and water drinking scores on individual days were examined for outliers. These outliers were always on the high end of the normal distribution curve and were most likely due to accidental fluid loss from mouse activity in the cage (e.g. playing with the plastic tubes). A score was considered an outlier if it passed several conservative criteria. The score first had to exceed by two standard deviations the mean drinking score for that animal and the mean drinking score for the group (means were calculated separately for each phase of the study). If the score passed these criteria, it was then subjected to the Dixon Extreme Score Test (Dixon, 1950). Scores that passed all criteria were replaced with an average intake score, which was calculated by averaging fluid intake on the day before and the day after the outlier occurred. In a few cases it was necessary to replace the outlier with the mean of the group because the outlier occurred on the first or last day of a particular phase of the study. In males, valid outliers occurred 7 times during the first 21 day drinking phase (alcohol: 2 Stress, 1 No Stress; water: 1 Stress, 3 No Stress) and 2 times during the continuous-access drinking phase (alcohol: 1 Stress, 1 No Stress). In females, valid outliers occurred 9 times during the first 21 day drinking phase (alcohol: 3 Stress; water: 4 Stress, 2 No Stress), 2 times on no stress days during the intermittent stress phase (water: 1 Stress, 1 No Stress), and 1 time during the continuous-access phase (alcohol: 1 Stress). The number of alcohol and water outliers comprised 0.4 and 0.5% of the total dataset for males and females, respectively.
Male and female data were separately analysed because males and females were tested in separate experiments. Data for each phase of the experiment were analysed separately within males and females. The between-group factor was Group (Stress vs No Stress) and the within-group factor was Blocks (each block represented fluid intake averaged across 2- or 3-day periods). Significant Group × Blocks interactions were followed by one-way ANOVAs of Blocks within each group and post hoc unpaired t-tests of Group at each block to determine the source of the interaction (modified Bonferroni corrected; Keppel, 1991). Probability values ≤0.05 were considered significant.
RESULTS
Mean (±SEM) body weight at the beginning of the 2 h free-choice drinking phase was 28.3 ± 0.7 g and 29.1 ± 0.8 g in the male Stress and No Stress groups, respectively and 26.5 ± 0.4 g and 26.8 ± 0.4 g in the female Stress and No Stress groups, respectively. No significant group differences in body weight in either male or female HAP2 mice were indicated in t-tests.
Two hour free-choice drinking—acquisition
Figure 1 shows mean (±SEM) alcohol intake in g/kg/BW and percent alcohol preference (insets) in male (left panel) and female (right panel) HAP2 mice averaged across 3-day blocks during the 21-day acquisition period. In male mice, only 1 day of drinking (day 3) is represented in the first block due to a procedural error on days 1 and 2. Day 3 was removed from all statistical analyses in male mice.
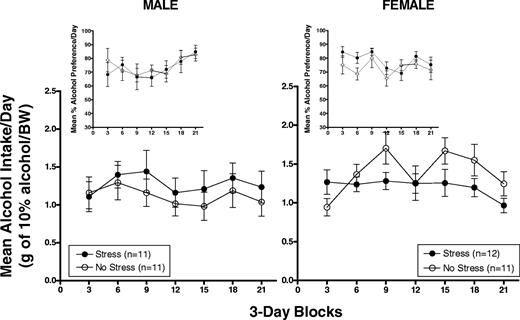
Mean (±SEM) alcohol intake in g/kg/BW and percent alcohol preference (insets) in male (left panel) and female (right panel) HAP2 mice averaged across 3-day blocks during the 21-day acquisition period.
Alcohol intake
Males
The Stress group showed overall slightly higher g/kg alcohol intake relative to the No Stress group. However, two-way ANOVAs [Group × Block (6)] of g/kg alcohol intake and alcohol preference yielded only a Block effect for alcohol preference [F(5,100) = 4.3, P < 0.01] which appeared to be due to an increase in alcohol preference over days in both groups during the acquisition period.
Females
The Stress group initially showed higher, followed by lower, g/kg alcohol intake compared to the No Stress group. Two-way ANOVAs [Group × Block (7)] of alcohol intake in g/kg and alcohol preference yielded effects of Block [g/kg: F(6,126) = 4.0, P < 0.01; preference: F(6,126) = 2.3, P < 0.05] and a Group × Block interaction for g/kg alcohol intake [F(6,126) = 3.0, P < 0.01]. Follow-up one-way ANOVAs indicated that the interaction was due to an increase over days in g/kg alcohol intake in the No Stress group [F(6,60) = 6.3, P < 0.01] but not in the Stress group. However, post hoc t-tests showed no significant group differences in g/kg alcohol intake during any block.
Water and total fluid intake
Table 1 shows mean (±SEM) water and total fluid intake (ml/kg/BW) throughout the entire experiment in male and female HAP2 mice in the Stress and No Stress groups, averaged across the same time periods as alcohol intake data. Day 3 was removed from the analyses in male mice, as was done with the alcohol data.
Water and total fluid intake (ml/kg/BW) in HAP2 male and female mice during each phase of the study
| Male/Stress | Male/No Stress | Female/Stress | Female/No Stress | |||||||||||||
|---|---|---|---|---|---|---|---|---|---|---|---|---|---|---|---|---|
| Water | Total | Water | Total | Water | Total | Water | Total | |||||||||
| Acquisition | ||||||||||||||||
| 3 | 4.3 ± 1.1 | 18.3 ± 2.9 | 2.7 ± 0.7 | 17.4 ± 3.1 | 2.7 ± 0.6 | 18.8 ± 2.1 | 1.9 ± 0.5 | 13.9 ± 1.4 | ||||||||
| 6 | 4.6 ± 0.9 | 22.3 ± 2.2 | 4.4 ± 0.6 | 20.8 ± 2.7 | 3.6 ± 0.7 | 19.3 ± 1.1 | 6.4 ± 0.8 | 23.8 ± 1.9 | ||||||||
| 9 | 6.5 ± 1.4 | 24.7 ± 2.8 | 5.9 ± 1.0 | 20.6 ± 2.3 | 3.7 ± 0.6 | 19.9 ± 1.4 | 3.4 ± 0.6 | 25.0 ± 2.9 | ||||||||
| 12 | 8.0 ± 1.6 | 22.7 ± 1.9 | 4.2 ± 0.5 | 17.1 ± 2.1 | 4.1 ± 0.5 | 20.0 ± 1.7 | 6.0 ± 0.6 | 21.9 ± 3.0 | ||||||||
| 15 | 4.5 ± 0.5 | 19.8 ± 2.9 | 4.2 ± 0.7 | 16.6 ± 2.4 | 5.7 ± 0.3 | 21.6 ± 2.2 | 6.8 ± 0.9 | 28.0 ± 2.2 | ||||||||
| 18 | 3.2 ± 0.4 | 20.4 ± 2.6 | 3.6 ± 0.8 | 18.7 ± 2.6 | 2.3 ± 0.5 | 17.5 ± 1.7 | 4.8 ± 0.6 | 24.4 ± 2.8 | ||||||||
| 21 | 2.9 ± 0.8 | 18.5 ± 3.0 | 1.8 ± 0.5 | 14.9 ± 2.3 | 4.8 ± 1.2 | 17.0 ± 1.9 | 4.0 ± 0.5 | 19.8 ± 2.1 | ||||||||
| Stress days | ||||||||||||||||
| S2 | 16.8 ± 4.6 | 35.3 ± 5.4 | 3.6 ± 0.8 | 14.8 ± 1.6 | 14.5 ± 2.8 | 31.5 ± 2.1 | 3.5 ± 0.7 | 19.8 ± 2.4 | ||||||||
| S4 | 22.4 ± 4.2 | 41.9 ± 5.1 | 5.0 ± 1.4 | 19.9 ± 3.5 | 16.8 ± 2.7 | 35.0 ± 2.6 | 9.8 ± 1.3 | 29.1 ± 2.0 | ||||||||
| S6 | 19.9 ± 4.0 | 35.4 ± 4.2 | 8.5 ± 1.2 | 18.6 ± 3.2 | 14.1 ± 2.4 | 32.3 ± 2.2 | 8.4 ± 0.8 | 28.0 ± 2.5 | ||||||||
| S8 | 20.9 ± 5.9 | 43.6 ± 6.2 | 6.2 ± 1.0 | 19.3 ± 3.6 | 9.9 ± 1.4 | 28.5 ± 2.1 | 7.2 ± 0.6 | 27.8 ± 2.7 | ||||||||
| S10 | 18.6 ± 4.8 | 40.2 ± 5.3 | 10.2 ± 2.2 | 27.0 ± 3.9 | 12.2 ± 1.6 | 25.7 ± 1.7 | 3.8 ± 0.4 | 17.1 ± 1.9 | ||||||||
| No stress days | ||||||||||||||||
| NS2 | 3.1 ± 0.6 | 18.3 ± 2.7 | 4.0 ± 1.0 | 15.3 ± 2.2 | 5.4 ± 1.1 | 21.0 ± 1.5 | 5.6 ± 0.4 | 28.4 ± 1.4 | ||||||||
| NS4 | 3.6 ± 0.6 | 18.8 ± 2.6 | 3.5 ± 0.7 | 11.3 ± 1.6 | 5.1 ± 1.2 | 21.6 ± 2.7 | 4.3 ± 0.9 | 25.1 ± 2.2 | ||||||||
| NS6 | 5.0 ± 1.2 | 21.4 ± 1.6 | 5.3 ± 0.6 | 19.8 ± 2.6 | 2.6 ± 1.0 | 16.5 ± 2.5 | 3.4 ± 0.6 | 20.8 ± 2.7 | ||||||||
| NS8 | 5.3 ± 1.0 | 25.1 ± 3.2 | 3.9 ± 0.9 | 17.6 ± 2.9 | 5.7 ± 1.3 | 17.1 ± 2.6 | 6.3 ± 0.7 | 23.1 ± 2.1 | ||||||||
| NS10 | 7.1 ± 1.7 | 26.0 ± 2.2 | 5.9 ± 1.5 | 18.8 ± 3.3 | 6.8 ± 0.8 | 21.9 ± 2.1 | 6.4 ± 0.7 | 24.3 ± 1.4 | ||||||||
| Continuous-access | ||||||||||||||||
| 2 | 71.6 ± 12.8 | 218.5 ± 11.3 | 102.5 ± 17.9 | 232.3 ± 12.9 | 95.7 ± 12.1 | 260.0 ± 9.8 | 116.9 ± 15.5 | 284.9 ± 18.9 | ||||||||
| 4 | 77.6 ± 14.0 | 208.9 ± 9.3 | 134.6 ± 20.4 | 228.6 ± 9.6 | 104.8 ± 15.6 | 258.2 ± 14.8 | 109.2 ± 18.6 | 265.1 ± 9.4 | ||||||||
| 6 | 65.5 ± 11.4 | 191.1 ± 5.4 | 109.1 ± 18.1 | 211.9 ± 11.1 | 127.0 ± 15.9 | 245.3 ± 10.6 | 141.1 ± 18.0 | 262.4 ± 9.2 | ||||||||
| 8 | 75.0 ± 14.8 | 199.6 ± 8.1 | 118.5 ± 19.8 | 216.9 ± 10.7 | 134.5 ± 14.9 | 260.9 ± 10.8 | 140.1 ± 22.2 | 272.7 ± 12.2 | ||||||||
Mean (±SEM) water intake and total fluid intake (ml/kg/BW) throughout the entire experiment. Data for male and female HAP2 mice in the Stress and No Stress groups are averaged across the same time periods as alcohol intake data shown in the figures.
Males
The two-way ANOVAs indicated that water and total fluid intake varied over days in both groups [Block effects: water, F(5,100) = 8.2, P < 0.01]; total fluid, F(5,100) = 3.5, P < 0.01].
Females
Two-way ANOVA of water intake showed a significant effect of Group [F(1,21) = 5.8, P < 0.05], Block [F(6,126) = 7.8, P < 0.01], and a Group × Block interaction [F(6,126) = 2.7, P < 0.05]. Post hoc t-tests indicated that the interaction was due to lower water intake in the Stress group vs the No Stress group during the 2nd (P = 0.02, days 4–6), 4th (P = 0.02, days 10–12), and 6th block (P = 0.01, days 16–18). Two-way ANOVA of total fluid intake indicated a significant Block effect [F(6,126) = 5.7, P < 0.01] and a Group × Block interaction [F(6,126) = 2.7, P < 0.05]. Follow-up one-way ANOVAs indicated that the interaction was due to an increase over days in total fluid intake in the No Stress group [F(6,60) = 7.9, P < 0.01] but not in the Stress group. However, post hoc t-tests showed no significant group differences in total fluid intake.
Two hour free-choice drinking—intermittent stress application
Figures 2 and 3 show mean (±SEM) 2 h alcohol intake averaged across 2-day blocks in g/kg/BW and percent alcohol preference (insets) in male (left panel) and female (right panel) HAP2 mice on stress application days (Fig. 2) and no stress days (Fig. 3). Intake data on stress application days were analysed separately from intake data on no stress days.
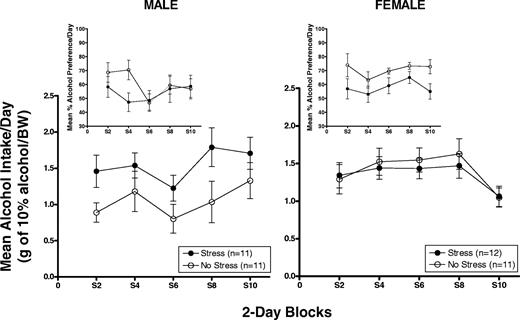
Mean (±SEM) 2 h alcohol intake averaged across 2-day blocks in g/kg/BW and percent alcohol preference (insets) in male (left panel) and female (right panel) HAP2 mice on stress application days.
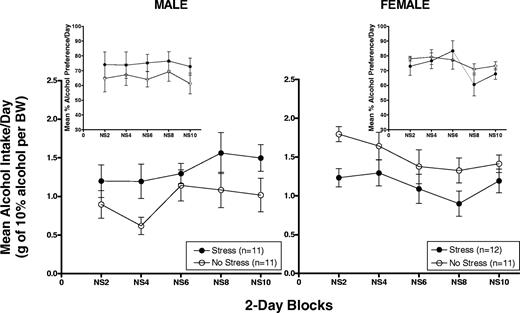
Mean (±SEM) 2 h alcohol intake averaged across 2-day blocks in g/kg/BW and percent alcohol preference (insets) in male (left panel) and female (right panel) HAP2 mice on no stress days.
Alcohol intake on stress days
Males
The Stress group showed overall higher alcohol intake in g/kg, and lower alcohol preference during the second block (which corresponds with days 5 and 7 during the intermittent stress phase), relative to the No Stress group during the 2 h drinking sessions that followed stress application (Fig. 2, left panel). Two-way ANOVAs [Group × Block (5)] of g/kg alcohol intake and alcohol preference yielded a Group effect close to significance for g/kg alcohol intake [F(1,20) = 3.3, P = 0.085]. The alcohol preference ANOVA showed a Block effect [F(4,80) = 3.0, P < 0.05] and a Group × Block interaction [F(4,80) = 2.5, P = 0.05]. Post hoc t-tests confirmed that the interaction was due to lower alcohol preference in the Stress group during the second block (P = 0.03).
Females
The Stress group showed overall lower alcohol preference, but not g/kg alcohol intake, compared to the No Stress group during the 2 h drinking sessions that followed stress application (Fig. 2, right panel). Two-way ANOVAs [Group × Block (5)] indicated a significant effect of Block for g/kg alcohol intake [F(4,84) = 6.2, P < 0.01] due to a drop in g/kg alcohol intake in both groups during the last 2-day block. The overall lower alcohol preference in the Stress group was supported by a significant effect of Group [F(1,21) = 5.4, P < 0.05].
Water and total fluid intake on stress days
Males
The Stress group showed higher water intake relative to the No Stress group [Group effect: F(1,20) = 8.9, P < 0.01]. Total fluid intake varied in both groups over stress days [Block effect: F(4,80) = 5.6, P < 0.01] and was higher in the Stress group during the 2 h drinking sessions that followed stress application [Group effect: F(1,20) = 11.9, P < 0.01].
Females
Water intake varied over days in both groups [Block effect: F(4,84) = 4.2, P < 0.01] and was higher in the Stress group [Group effect: F(1,21) = 18.7, P < 0.01]. The total fluid intake ANOVA showed significant effects of Block [F(4,84) = 12.3, P < 0.01], Group [F(1,21) = 7.1, P = 0.01], and a Group × Block interaction [F(4,84) = 3.2, P < 0.05]. Post hoc t-tests indicated that the interaction was due to higher total fluid intake (due primarily to higher water intake) in the Stress group on the 1st (P = 0.002, days 1 and 3) and the 5th (P = 0.003, days 17 and 19) block.
Alcohol intake on no stress days
Males
The Stress group showed higher g/kg alcohol intake and alcohol preference relative to No Stress controls during the 2 h drinking sessions on no stress days (Fig. 3, left panel). The ANOVAs [Group × Block (5)] indicated that g/kg alcohol intake varied over days in both groups [Block effect: F(4, 80) = 4.4, P < 0.01] but the Group effect did not reach significance [F(1,20) = 2.7, P = 0.1]. The Group effect for alcohol preference was [F(1,20) = 1.4, P = 0.25].
Females
The Stress group showed lower g/kg alcohol intake, but not alcohol preference, compared to the No Stress group during the 2 h drinking sessions on no stress days (Fig. 3, right panel). The ANOVAs [Group × Block (5)] indicated a Group effect close to significance for g/kg alcohol intake [F(1,21) = 3.9, P = 0.06] and that alcohol preference varied over days in both groups [Block effect: F(4,84) = 2.7, P < 0.05].
Water and total fluid intake on no stress days
Males
The ANOVAs indicated that water and total fluid intake varied over days in both groups [Block effects: water, F(4,80) = 3.7, P < 0.01; total fluid, F(4,80) = 7.3, P < 0.01].
Females
The ANOVAs indicated that water and total fluid intake varied over days in both groups [Block effects: water, F(4,84) = 5.5, P < 0.01; total fluid, F(4,84) = 5.9, P < 0.01].
Continuous-access free-choice drinking
Figure 4 shows mean (±SEM) alcohol intake in g/kg/BW and percent alcohol preference (insets) in male (left panel) and female (right panel) HAP2 mice averaged across 2 day blocks during the 8 days of continuous-access free-choice drinking.
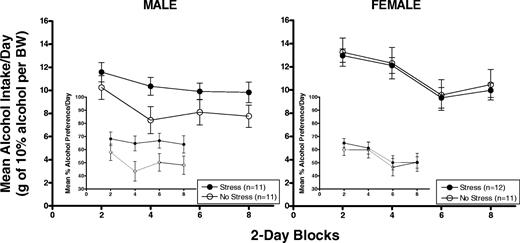
Mean (±SEM) alcohol intake in g/kg/BW and percent alcohol preference (insets) in male (left panel) and female (right panel) HAP2 mice averaged across 2-day blocks during the 8 days of continuous-access free-choice drinking.
Alcohol intake
Males
The Stress group showed higher alcohol intake in both g/kg and alcohol preference compared to the No Stress group. The ANOVAs indicated that g/kg alcohol intake and alcohol preference varied over days in both groups [Block effects: g/kg, F(3,60) = 20.9, P < 0.01; preference, F(3,60) = 9.5, P < 0.01]. The Group × Block interaction for g/kg alcohol intake was close to significance [F(3,60) = 2.3, P = 0.09]. The Group × Block interaction for alcohol preference was significant [F(3,60) = 3.2, P < 0.05]. Post hoc t-tests indicated that the interaction for alcohol preference was due to higher alcohol preference in the Stress group during the 2nd block (P = 0.035, days 3 and 4).
Females
No differences were seen between the Stress and No Stress group in g/kg alcohol intake or alcohol preference. The ANOVAs indicated that g/kg alcohol intake and alcohol preference varied over days in both groups [Block effects: g/kg, F(3,63) = 14.2, P < 0.01; preference, F(3,63) = 13.3, P < 0.01].
Water and total fluid intake
Males
The ANOVAs indicated that water and total fluid intake varied over days in both groups [Block effects: water, F(3,60) = 6.1, P < 0.01; total fluid, F(3,60) = 9.8, P < 0.01].
Females
The ANOVAs indicated that water intake varied over days in both groups [Block effect: F(3,63) = 6.4, P < 0.01].
DISCUSSION
There were two primary goals of the present study: to examine the effects of restraint stress on the initiation and maintenance of alcohol drinking behaviour in mice with a genetic predisposition toward high alcohol preference (selectively bred HAP2 line), and to determine whether the effects of stress in HAP2 mice differed as a function of sex. Ten days of prior restraint stress did not significantly influence the acquisition of limited-access alcohol drinking behaviour in either male or female mice. However, subsequent exposures to restraint stress produced subtle but consistent effects on alcohol intake that differed in males vs females; in general, stress increased alcohol intake in males and decreased or did not change alcohol intake in females. These findings suggest that the effects of stress on alcohol drinking in mice with a genetic predisposition toward high alcohol preference depend on sex.
A number of studies in rodents indicate that a prior history of stress exposure may facilitate the acquisition of drug- and alcohol-seeking behaviour (see review by Piazza and Le Moal, 1998). The present study is the first to examine the effects of stress on the acquisition of alcohol drinking behaviour in mice selectively bred for high alcohol preference. It was hypothesized that a prior history of stress exposure might facilitate the acquisition of limited-access alcohol drinking in the HAP2 line. The current findings do not support this hypothesis. Although overall alcohol intake during the 21 days following termination of the restraint stress was slightly higher in male and lower in female HAP2 mice, these effects were not robust. However, it is interesting that the lower alcohol intake in female mice exposed to stress was due to a significant increase in alcohol intake in the No Stress control group but not in the Stress group. This finding suggests that prior restraint stress suppressed a normal increase in alcohol intake in female mice during the acquisition period.
A further aim of the present study was to determine whether subsequent exposures to stress would increase alcohol intake in alcohol-experienced mice with a prior history of stress. An intermittent stress exposure procedure was used to examine alcohol drinking on days immediately following termination of stress and on intervening days in the absence of stress. During the 2h drinking sessions that immediately followed restraint stress, males showed moderately higher g/kg alcohol intake and females showed moderately lower alcohol preference. These effects of stress did not seem selective for alcohol intake because water intake increased during these sessions in both males and females. In the absence of stress, however, similar effects of stress on alcohol intake were evident in males and females without concomitant changes in water intake. Specifically, males showed moderately higher g/kg alcohol intake and higher alcohol preference and females showed moderately lower g/kg alcohol intake.
One reason for the modest effects of stress on limited-access alcohol drinking could be that the drinking sessions occurred during the light period of the light:dark cycle. Limited-access alcohol drinking was assessed during the light based on the fact that rodents generally drink less alcohol during the light period (see review by Hiller-Sturmhofel and Kulkosky, 2001) and, therefore, we had hoped to increase our ability to detect a stress-induced increase in alcohol intake during limited-access periods. Although both male and female HAP2 mice showed a clear preference for alcohol over water (∼70–90%), the average intake in both males and females during the first 21 days of 2 h limited-access drinking was between 1.0 and 1.5 g/kg alcohol. As expected, this amount of alcohol intake was lower than that reported by Grahame et al. (1999b) in male and female mice from the HAP1 line during 2 h drinking sessions in the dark (between ∼2.5 and 3.5 g/kg). It will be interesting to examine the effects of stress on limited-access drinking behaviour in HAP mice when access to alcohol is given only during the dark period.
Under continuous-access conditions after stress termination, the stress-induced increase in alcohol intake in males became more robust, particularly for alcohol preference. However, in females, alcohol intake returned to the level in the No Stress control group. These results suggest that a prior history of stress may produce a long-lasting change in alcohol drinking behaviour only in male HAP2 mice. This finding contrasts with prior findings in male rats selectively bred for high alcohol consumption (P and HAD1 lines) in which 10 consecutive days of unpredictable restraint stress reduced continuous-access alcohol intake in the P and HAD1 lines during the period of stress application and transiently increased alcohol intake after stress termination in the P line (Chester et al., 2004). The persistent increase in alcohol intake seen in HAP2 males in the present study suggests that the predictable, intermittent nature of the restraint stress may be important in contributing to a sustained increase in alcohol intake in male rodents with a genetic propensity toward high alcohol drinking. This result agrees with prior findings in male Wistar rats where predictable, intermittent restraint stress produced a prolonged increase in alcohol consumption after stress exposures were terminated (Lynch et al., 1999). However, interpretation of the effects of intermittent stress on alcohol drinking in the present study must be tempered by the fact that HAP2 mice had prior experience with stress and alcohol drinking. It is also possible that the additional restraint session and acoustic startle test influenced subsequent alcohol intake during the 8 days of continuous-access alcohol drinking. Additional studies are needed to determine whether having a previous history of stress and/or alcohol exposure is necessary in order to see a sustained increase in alcohol drinking in response to predictable, intermittent stress. Further, it will be important to assess the effects of intermittent stress on alcohol drinking behaviour in male and female mice that show average or low alcohol preference in order to determine whether the present findings are unique to mice with a genetic propensity for high alcohol preference.
To our knowledge, this is the first study to demonstrate differential effects of stress on alcohol drinking behaviour in male vs female mice. The mechanisms underlying sex differences in a stress-induced change in alcohol intake are not known, although the HPA axis is a likely candidate for consideration. Restraint stress activates the HPA axis resulting in the release of CRH, adrenocorticotropin hormone (ACTH), and corticosterone (Livezey et al., 1985; Hauger et al., 1988; Jones et al., 1998). Rodent studies have indicated sex-related differences in the secretion of HPA axis hormones in response to stress or to alcohol that depend on genotype (Jones et al., 1998), type of stressor (Rivier, 1999), and stage of the estrous cycle (Rivier, 1993). In addition, repeated restraint stress produces biological adaptations related to HPA axis regulation (Hauger et al., 1990) that differ in males vs females (Jones et al., 1998). The stress-induced suppression in alcohol intake seen in female HAP2 mice in the present study encourages further investigation of the biological mechanisms that may protect against stress-related increases in alcohol intake. It is important to consider the possibility that repeated stress and/or alcohol may have disrupted estrous cycles which may be related to the current results in HAP2 females. It should also be noted that environmental variables may have influenced the results of this study because, although experimental conditions were matched, males and females were not tested at the same time. Future studies are planned to address these issues and examine the role of the HPA axis and the stage of estrous cycle in mediating the effects of stress on alcohol drinking behaviour in male and female mice.
Results of several studies indicate that individuals with increased genetic risk for alcoholism show altered HPA axis responses to stress, to alcohol, or to pharmacological challenge (Waltman et al., 1994; Gianoulakis et al., 1996; Wand et al., 1999, 2001; Dai et al., 2002; Zimmermann et al., 2004). Variations in HPA axis function have been suggested to represent a potential biological marker for alcohol addiction vulnerability. HPA axis function has not been characterized in the HAP lines or in their LAP counterparts. However, it was recently reported that the HAP/LAP lines differ in urocortin immunoreactivity in the Edinger–Westphal nucleus, a brain area suggested to regulate voluntary alcohol consumption in mice (Bachtell et al., 2003). In this study, HAP2 mice showed higher urocortin expression and a greater number of urocortin positive cells relative to LAP2 mice. These findings are interesting given that urocortin is a peptide that is structurally and functionally related to CRH (Vaughan et al., 1995), which drives the HPA axis response by stimulating the secretion of ACTH and corticosterone. In addition, restraint stress upregulates the expression of urocortin mRNA in the Edinger–Westphal nucleus in mouse brain (Weninger et al., 2000). We plan to investigate whether differences in HPA axis function in the HAP/LAP selected mouse lines may be related to their genetic propensity for alcohol drinking behaviour as well as to stress-induced changes in alcohol intake.
In summary, the present study revealed that an intermittent restraint stress procedure increases alcohol drinking in male but not female mice selectively bred for high alcohol preference. The results in male HAP2 mice support the long-standing theory proposed by Conger (1956) that suggests stress may reinforce alcohol drinking behaviour because alcohol relieves psychological or physiological consequences of stress. However, the biological mechanisms that influence stress-induced changes in alcohol intake remain to be determined. Mouse lines selectively bred for high alcohol preference should serve as a useful model to investigate genetic and environmental factors that influence alcohol drinking behaviour in males and females.
Supported by the Purdue Research Foundation. We gratefully acknowledge Dr. Nicholas J. Grahame for providing us with mice from the selectively bred HAP2 line and AA P60 07611 to Dr. David Crabb.
REFERENCES
Adams, N. (
Adams, N., Hannah, J. A. and Henry, W. (
Anisman, H. and Waller, T. G. (
Bachtell, R. K., Weitemier, A. Z., Galvan-Rosas, A. et al. (
Bond, N. W. (
Bowers, W. J., Sabongui, A. G. and Amit, Z. (
Casey, A. (
Chadda, R. and Devaud, L. L. (
Champagne, F. and Kirouac, G. (
Chester, J. A., Blose, A. M., Zweifel, M. et al. (
Clay, M. L. (
Conger, J. J. (
Conti, L. H. and Printz, M. P. (
Dai, X., Thavundayil, J. and Gianoulakis, C. (
Davis, M. (
Devaud, L. L., Alele, P. and Ritu, C. (
Dudek, B. C. and Underwood, K. A. (
Faraday, M. M. (
Garrick, T., Morrow, N., Shalev, A. Y. et al. (
George, F. R. (
Gianoulakis, C., Krishnan, B. and Thavundayil, J. (
Grahame, N. J., Li, T.-K. and Lumeng, L. (
Grahame, N. J., Li, T.-K. and Lumeng, L. (
Haleem, D. J., Kennett, G. and Curzon, G. (
Hauger, R. L., Millan, M. A., Lorang, M. et al. (
Hauger, R. L., Lorang, M., Irwin, M. et al. (
Hiller-Sturmhofel, S. and Kulkosky, P. (
Horton, D. J. (
Jones, B. C., Sarrieau, A., Reed, C. L. et al. (
Kennett, G. A., Chaouloff, F., Marcou, M. et al. (
Keppel, G. (
Li, T.-K. and McBride, W. J. (
Livezey, G. T., Miller, J. M. and Vogel, W. H. (
Lynch, W. J., Kushner, M. G., Rawleigh, J. M. et al. (
Myers, R. D. and Holman, R. B. (
Nash, J. F., Jr. and Maickel, R. P. (
O'Callaghan, M. J., Croft, A. P., Watson, W. P. et al. (
Phillips, T. J., Feller, D. J. and Crabbe, J. C. (
Phillips, T. J., Crabbe, J. C., Metten, P. et al. (
Phillips, T. J., Roberts, A. J. and Lessov, C. N. (
Piazza, P. V. and Le Moal, M. (
Pohorecky, L. A. (
Pohorecky, L. A. (
Reich, T., Edenberg, H. J., Goate, A. et al. (
Rivier, C. (
Rivier, C. (
Roberts, A. J., Phillips, T. J., Belknap, J. K. et al. (
Rockman, G. E., Hall, A. and Glavin, G. B. (
Roske, I., Baeger, I., Frenzel, R. et al. (
Shuster, L. (
Sillaber, I. and Henniger, M. S. (
Sillaber, I., Rammes, G., Zimmermann, S. et al. (
van der Kam, E. L., Coolen, J. C., Ellenbroek, B. A. et al. (
Vaughan, J., Donaldson, C., Bittencourt, J. et al. (
Volpicelli, J. R. (
Volpicelli, J. R., Ulm, R. R. and Hopson, N. (
Volpicelli, J., Balaraman, G., Hahn, J. et al. (
Waltman, C., McCaul, M. E. and Wand, G. S. (
Wand, G. S., Mangold, D., Ali, M. et al. (
Wand, G., McCaul, M. E., Gotjen, D. et al. (
Weninger, S. C., Peters, L. L. and Majzoub, J. A. (
Wust, S., Federenko, I., Hellhammer, D. H. et al. (
