


Abstract
Auditory pattern changes have been shown to elicit increases in magnetoencephalographic gamma-band activity (GBA) over left inferior frontal cortex, forming part of the putative auditory ventral ‘what’ processing stream. The present study employed a McGurk-type paradigm to assess whether GBA would be associated with subjectively perceived changes even when auditory stimuli remain unchanged. Magnetoencephalograms were recorded in 16 human subjects during audiovisual mismatch perception. Both infrequent visual (auditory /ta/ + visual /pa/) and acoustic deviants (auditory/pa/ + visual /ta/) were compared with frequent audiovisual standards (auditory /ta/ and visual /ta/). Statistical probability mapping revealed spectral amplitude increases at ∼75 and ∼78 Hz to visual deviants. GBA to visual deviants peaked 160 ms after auditory stimulus onset over posterior parietal cortex, at 270 ms over occipital areas and at 320 ms over left inferior frontal cortex. The latter GBA enhancement was consistent with the increase observed previously to pure acoustic mismatch, supporting a role of left inferior frontal cortex for the representation of perceived auditory pattern change. The preceding gamma-band changes over posterior areas may reflect processing of incongruent lip movements in visual motion areas and backprojections to earlier visual cortex.
Introduction
Perception of the external world is based on the integration of inputs from different sensory modalities. During speech perception, seeing a speaker's face enhances the intelligibility of a noisy auditory signal (Sumby and Pollack, 1954). Conversely, incongruent visual information can alter the perception of auditory speech sounds. This interaction is impressively demonstrated by the McGurk effect (McGurk and MacDonald, 1976), where, for example, the simultaneous presentation of an auditory /ba/ and a visual /ga/ robustly produces the illusory percept of /da/. So far the brain mechanisms subserving the integration of conflicting audiovisual information remain to be clarified.
The first evidence for a visual modulation of auditory cortex activity was provided by Sams et al. (1991), who showed that infrequent deviations in the visual component of combined audiovisual syllable presentations interspersed in a sequence of congruent events gave rise to magnetic mismatch fields at the level of the supratemporal region. Mismatch paradigms (Näätänen, 1992) have also been employed in more recent studies. Colin et al. (2002) found mismatch negativities in electroencephalograms (EEGs) both for unimodal auditory and audiovisual deviants but not for unimodal visual deviant changes. In contrast, Möttönen et al. (2002) reported mismatch activations at the level of the bilateral supratemporal planes in magnetoencephalograms (MEGs) both for audiovisual and unimodal visual deviants. However, responses to purely visual deviants were delayed by ∼100 ms in comparison with bimodal presentations. Results from these mismatch studies have been interpreted as evidence for a fast integration of auditory and visual information preceding phonetic classification.
Hemodynamic brain imaging studies have also demonstrated activations of superior temporal regions during processing of conflicting audiovisual inputs. During the identification of bimodal audiovisual syllables, functional magnetic resonance imaging (fMRI) and positron emission tomography revealed an involvement of posterior parts of the left superior temporal sulcus (STS) that was particularly pronounced under noisy listening conditions (Sekiyama et al., 2003). This region was located in between areas of enhanced activation during unimodal auditory and visual processing (temporal cortex and V5/MT in inferior parietal cortex respectively). A further fMRI study also found bilateral superior temporal gyrus to be involved in the processing of incongruent audiovisual stimuli (Jones and Callan, 2003), and additional activations were identified in inferior frontal, premotor and posterior parietal cortex.
In the present study a mismatch paradigm was employed to assess fast oscillatory activity during the processing of conflicting audiovisual information. Induced gamma-band activity (GBA) in human EEG has been related to the perception of coherent or gestalt-like visual stimuli (Lutzenberger et al., 1995; Müller et al., 1996; Tallon-Baudry et al., 1996; Keil et al., 1999). Enhanced GBA has also been observed during various higher cognitive processes like language perception (Lutzenberger et al., 1994; Pulvermüller et al., 1997), selective attention (Gruber et al., 1999; Müller et al., 2000; Gobbelé et al., 2002), learning (Miltner et al., 1999; Gruber et al., 2001, 2002) or short-term memory (Tallon-Baudry et al., 1998); for reviews, see Tallon-Baudry and Bertrand (1999) and Keil et al. (2001).
Typically GBA in EEGs was found to be most pronounced in the frequency range 30–60 Hz and topographically rather widespread across the scalp. In contrast, MEGs revealed highly focal GBA increases in higher-frequency bands between 50 and 90 Hz, reflecting higher auditory functions at a good spatial and high temporal resolution (Kaiser and Lutzenberger, 2003). In a series of studies on oscillatory activity during the processing of auditory spatial and auditory pattern information, we have demonstrated GBA over the putative auditory dorsal ‘where’ and ventral ‘what’ pathways respectively (Rauschecker, 1998). These findings were replicable across different paradigms like passive listening (Kaiser et al., 2000a, 2002a,b) auditory–motor integration (Kaiser and Lutzenberger, 2001) and auditory working memory (Lutzenberger et al., 2002; Kaiser et al., 2003), and showed a high topographical consistency with results from hemodynamic imaging studies. The rationale for focusing on GBA in the present study was twofold. First the use of oscillatory activity in MEG would enable the analysis of the temporal dynamics of activations, thus overcoming the limited time resolution of the functional imaging studies summarized above. Second, assessing induced GBA without topographical a priori restrictions can be expected to allow for an analysis of regions beyond the early auditory areas that previous evoked potential/evoked field EEG/MEG studies have focused on.
In a previous (unimodal auditory) phonetic mismatch study, magnetoencephalographic GBA at ∼84–88 Hz was increased over left inferior frontal cortex (Kaiser et al., 2002b), supporting the hypothesized involvement of this area in auditory pattern processing (Maeder et al., 2001; Romanski and Goldman-Rakic, 2002). The fact that this activation followed the evoked mismatch response by ∼130 ms as well as its localization over putative auditory association cortex suggested this response to be generated by networks producing higher-order representations of the relevant (deviant) stimulus feature.
This audiovisual oddball study aimed at assessing the dynamics of network activations along the putative auditory ventral stream during audiovisual integration. It focused on fast oscillatory activity during perceived alterations of a heard syllable which were induced by changes in the articulatory gestures of a visually presented speaker. Based on the notion that GBA in higher sensory association cortex may reflect the representation of perceived changes rather than the physical auditory stimulus input, we hypothesized increased left inferior frontal GBA during McGurk-type mismatch processing. An involvement of inferior frontal cortex in the processing of visually induced changes in the auditory percept would suggest that networks in this putative auditory ventral stream area are involved not only in unimodal auditory processing but also in illusory perception caused by audiovisual integration.
Methods and Materials
Subjects
Twenty healthy adults gave their informed and written consent to participate in the present study. Four subjects had to be excluded from the analysis because of excessive electromyographic activity at posterior sensors (n = 3) or strong electrocardiogram artifacts (n = 1), leaving n = 16 participants for further analysis (7 females, 9 males, age range: 20–40 years). The study was approved by the ethics committee of the University of Tübingen Medical Faculty.
Stimuli
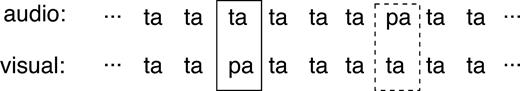
Synthesized consonant-vowel syllables /ta/ and /pa/ served as auditory stimuli (duration of both events: 165 ms, voice onset time: 60 ms). The fundamental frequency was 110 Hz and decreased to 90 Hz at the end of the syllables, giving the impression of a male voice. The formant frequencies of the steady-state part of the vowel /a/ were 800, 1240, 2300, 3800 and 4500 Hz for F1–F5 respectively. The two syllables predominantly differed in the consonant bursts at the onset of the sounds which contained more high-frequency components for /ta/ than for /pa/. Digital versions of both sounds were sampled at 22 050 Hz and may be obtained on request from the authors. Visual stimuli were generated by video-recording (frame rate: 25 images per second) a male German speaker uttering the same syllables /ta/ and /pa/. Movement sequences lasted for 11 images (duration: 440 ms). The onset of mouth movements preceded the onset of the acoustic stimulus by ∼150 ms. As a consequence, the decisive cue differentiating between both syllables (bilabial closure with the /p/) preceded the auditory syllable onset by ∼100 ms. The stimuli subtended a visual angle of ∼30° and were presented on a white background. Altogether, the experiment included three stimuli: standard stimulus (auditory /ta/ + visual /ta/), acoustic deviant (auditory /pa/ + visual /ta/) and visual deviant (auditory /ta/ + visual /pa/). The audiovisual stimulus combinations are depicted in Figure 1.
Audiovisual stimulus combinations. Infrequent visual and acoustic deviants (solid and hatched boxes respectively) were interspersed in a series of frequent congruent audiovisual stimulus presentations.
Subjective ratings of the visually induced auditory percept were obtained in an independent sample of n = 20 healthy adults (13 females, 7 males, age range: 20–42 years). Sequences of 12 stimuli each of audiovisually congruent stimuli (acoustic + visual /ta/) and visual deviants (acoustic /ta/ + visual /pa/) were displayed and subjects were asked to write down the syllable they heard. In case of congruent stimuli, 13 participants indicated that they had perceived ‘ta’, five heard ‘ta’ with an additional consonant at the end (‘tak’, ‘tap’ or ‘tat’), and one subject each reported having perceived ‘tra’ and ‘aha’ respectively. For the visual deviant, 16 subjects had perceived ‘pa’, three heard ‘pa’ with an additional consonant at the end (‘pat’), and one reported to have perceived ‘pra’. Thus the illusory initial consonant (/p/) in the visual deviants was perceived by all of the tested subjects. These findings imply that for the present stimuli, the visual information dominated the percept, whereas the original McGurk effect refered to a fusion of auditory and visual information without any dominance of either modality (McGurk and MacDonald, 1976).
Procedure
Subjects were seated upright in a magnetically shielded room (Vakuum-Schmelze, Hanau, Germany). Auditory stimuli were presented binaurally via air-conducting plastic tubes (E-A-Rtone 3A, Cabot Safety Corporation, Indianapolis, IN). These tubes lead to distortions of higher frequencies above 2 kHz (about −6 dB at 3 kHz, −20 dB at 4 kHz and −30 dB at 5 kHz). As a consequence, the upper two formant frequencies of the present stimuli were subject to some attenuation. Visual stimuli were presented on a screen ∼2 m in front of the subjects, who were instructed to respond by pressing buttons with both index fingers whenever they heard a change from the standard syllable. Responses were recorded within 1 s time windows starting from the onset of the auditory stimulus. Two blocks of 400 trials each were presented. Out of the total of 800 trials, 600 (75%) were standard trials, and there were 100 (12.5%) trials each with auditory and visual deviants. Standards and deviants were presented in randomized order with a minimum of two and a maximum of six standards preceding a deviant. The stimulus onset asynchrony amounted to 750 ms. The still face was presented in the interstimulus interval (the last frame of the visual movement sequence).
Data Recordings
MEGs were recorded using a whole-head system (CTF Inc., Vancouver, Canada) comprising 151 first-order magnetic gradiometers with an average distance between sensors of ∼2.5 cm. The amplitude resolution of the CTF system amounts to 0.3 fT, enabling the detection of low-amplitude signal changes. The signals were sampled at a rate of 250 Hz. Recording epochs lasted from 150 ms prior to the onset of the acoustic stimulus to 600 ms after onset of the acoustic stimulus. The subject's head position was determined with localization coils fixed at the nasion and the preauricular points at the beginning and the end of each recording to ensure that head movements did not exceed 0.5 cm. To reduce eye movement and blink artifacts we rejected trials containing signals exceeding 2.5 pT in fronto-temporal sensors.
Data Analysis
Data analysis was based on the direct statistical comparison of responses to either type of deviant with standard stimuli. First, spectral analysis served to identify the frequency range with the most robust difference between two stimulus types. Here all trials with deviant stimuli were included in the analysis (regardless of whether the subjects responded to the deviants or not), whereas only those standard trials were included that did not directly follow a deviant. Significance of the observed spectral power values for each frequency bin and MEG sensor was tested using a statistical probability mapping procedure described in detail in the next paragraph. Based on our previous studies where GBA effects over putative auditory stream areas were found in frequencies >50 Hz (Kaiser et al., 2000a, 2002a,b, 2003; Lutzenberger et al., 2002), the present statistical probability mapping was performed for the frequency range of 53–90 Hz. Second, time-courses across the entire recording epoch and topography of these effects were assessed after filtering in the frequency range with the most pronounced difference between deviants and standards. The latency ranges with the most significant spectral amplitude differences were then identified using statistical probability mapping.
Statistical Probability Mapping
The present statistical probability mapping included corrections both for multiple comparisons and for possible correlations between data either from neighboring frequency bins (for spectral analysis) or time points (for time-course analysis). Significance criteria were determined on the basis of permutation tests (Noreen, 1989; Blair and Karniski, 1993). Permutation tests identify the probability of observing a difference of a certain size between two conditions on the basis of the distribution obtained by randomly assigning the recorded data to the conditions. This method is akin to approaches to the analysis of fMRI data (Nichols and Holmes, 2002) and has been applied in previous studies on oscillatory activity in MEGs (Lutzenberger et al., 2002; Kaiser et al., 2003). In general, the significance criteria obtained from the present procedure correspond to approximately P < 0.003 for two neighboring frequency bins. If the neighboring bins were considered independent, the probability of 0.003 × 0.003 = 9 × 10⁻⁶ would correspond to a criterion of P < 0.05 Bonferroni-corrected for the number of sensors × frequency bins: 0.05/(151 × 40) = 8.28 × 10⁻⁶.
The starting point was the comparison of group average spectral amplitude values for deviants and standards at each sensor and each frequency bin between 53 and 90 Hz. This step of the analysis relied on the computation of t-tests for the spectral amplitude differences between visual deviants and standards and between acoustic deviants and standards for each sensor and each frequency bin. We thus obtained the observed distributions of the t-values for both comparisons for all frequency bins i × sensors j.
The same procedure that was described here for the analysis of spectral amplitudes across frequency bands was subsequently applied to the filtered data. Here amplitude values for the different time points in the analyzed period were entered in the analysis instead of values for different frequency bands. The algorithms may be obtained on request from the authors.
Spectral Analysis
Spectral analysis was conducted on single trial basis for a 600 ms time window starting 50 ms before to 550 ms after the onset of the auditory stimulus. To reduce the frequency leakage for the different frequency bins, the records were multiplied by Welch windows. Selecting a time window of 600 ms resulted in records of 150 points which were zero-padded to obtain 256 points. A fast Fourier transform was then conducted. Square roots of the power values were computed to obtain more normally distributed spectral amplitude values. These values were averaged across epochs to obtain measures of the total spectral activity for deviants and standards. Spectral activity was compared between deviants and standards applying the statistical probability mapping method described in the previous paragraph.
Exploration of Source Structure
In previous studies we have always found only single areas of spectral amplitude enhancement at the surface (Kaiser et al., 2000a, 2003; Lutzenberger et al., 2002). This suggested that the generator was not a dipole which in MEGs would produce two areas of surface activation corresponding to the dipole's in- and outflowing flux wells. Dual activation areas at the surface would lead to the conclusion that the source dipole was located in an area in between the two surface areas. In contrast, as we have shown and discussed in detail previously (Kaiser et al., 2000a), coupled or multiple dipoles elicit a strong field over the area circumscribed by the dipoles but much weaker outer fields which would not be detectable with our statistical probability mapping method. This would imply that the sources should be located close to the area below the sensor with the highest GBA. Narrowly localized single areas of GBA enhancements at the surface could only be generated by single dipoles in extremely ventral cortical regions because their second maximum would not be covered by the sensor helmet. However, to exclude the possibility that our significance criterion was too strict to find a second maximum generated by a single dipole source, we explored the observed spectral amplitude enhancements by repeating the statistical probability mapping with an uncorrected criterion of P < 0.1 for two adjacent frequency bins.
Time-course and Topographical Localization
To assess the time-course and the topographical localization of the observed spectral amplitude differences between stimulus types, the signals across the entire recording interval were multiplied with cosine windows at their beginnings and ends and filtered in the frequency range in which the statistical probability mapping had yielded significant effects. Non-causal, Gaussian curve-shaped Gabor filters in the frequency domain were applied to the signals on a single-epoch basis for each stimulus type. The filtered data were amplitude-demodulated by means of a Hilbert transformation (Clochon et al., 1996) and then averaged across epochs for separately for standards and deviants. After downsampling by a factor of five to reduce the number of highly correlated data points, differences in amplitude between stimulus types in the filtered frequency band were assessed with the statistical mapping procedure described above.
To depict the topographical localization of the observed differential spectral amplitude enhancements, we assigned the sensor positions with significant spectral amplitude effects of each subject to common spatial coordinates (‘common coil system’). Sensor positions with respect to the underlying cortical areas were determined using a volumetric magnetic resonance image of one representative subject. The error that is introduced by not using individual sensor locations was estimated in previous studies by using a single dipole localization of the first auditory evoked component (N1m) and somatosensory evoked fields (Kaiser et al., 2000a,b). The comparison of individual sensor locations and the ‘common coil system’ revealed differences ranging below the spatial resolution determined by the sensor spacing of 2.5 cm. This justified the application of a ‘common coil system’ for the purpose of the present study where no exact source localization was attempted.
Results
Behavioral Data
Acoustic deviants were identified more frequently than visual deviants. The average percentage of responses to deviants within 1 s after sound onset was 80.6% (SD = 3.6) for acoustic deviants and 56.6% (SD = 6.1) for visual deviants [F(1,15) = 7.2, P = 0.017]. In contrast, there was no difference in reaction times to acoustic versus visual deviants [acoustic: 500 ms (SD = 18); visual: 497 ms (SD = 20), t(15) = 0.26].
Visual Deviant
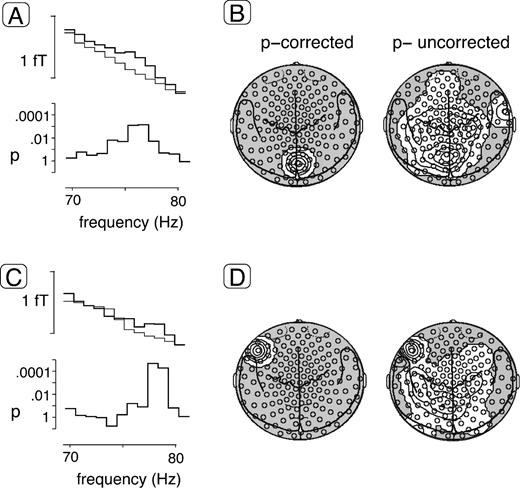
Figure 2a,c depicts the frequency spectrum between 70 and 80 Hz at single sensors for which significant effects were identified. The following effects met the corrected t-value of tcorr = 4.03. Higher GBA for the visual deviants compared with congruent audiovisual standards was found in two narrow frequency ranges centered at ∼75 and ∼78 Hz. Spectral amplitude at ∼75 Hz was increased in a sensor over midline occipital cortex (Fig. 2b), and the enhancements at ∼78 Hz were localized over left inferior frontal cortex (Fig. 2d).
Statistical probability mapping of spectral amplitude differences between visual deviants and standards. (A) Frequency spectrum in a sensor showing significant differences at ∼75 Hz between deviants and standards for the entire sample of n = 16 subjects. The top graph depicts spectral amplitude absolute values in fT between 70 and 80 Hz for the visual deviants and the congruent audiovisual standards (bold and thin lines respectively). The bottom graph shows the results (P-values) of t-tests comparing spectral amplitudes between deviants and standards. (B) Statistical probability mapping of spectral amplitude differences between visual deviants and standards. Topographies are shown for the entire group at ∼75 Hz projected onto two-dimensional MEG sensor maps including anatomical landmarks (seen from above, nose up). The left map depicts isocontour plots of significant spectral amplitude increases (white areas) meeting the corrected t-value derived from the permutation test-based method correcting for multiple comparisons described in the Materials and Methods. Relative amplitude enhancements for the visual deviant were found over midline occipital cortex. The right map shows the results after application of an uncorrected significance criterion of P = 0.1. (C) Frequency spectrum in a sensor showing significant differences at ∼78 Hz between deviants and standards as in part (A). (D) Topographies of spectral amplitude differences between visual deviants and standards at ∼78 Hz are shown as in part (B). Applying the corrected P-value of 0.05, significant spectral amplitude enhancements for the visual deviant were located in a sensor over the left inferior frontal cortex.
The question of the possible source structure underlying the observed effects was explored by repeating the statistical probability mapping with a more liberal, uncorrected criterion of P < 0.1 for two adjacent frequency bins (Figure 2b,d). Visual inspection of the results of this analysis showed that areas of additional spectral amplitude increases were widespread over frontal, central and parietal sensors without suggesting a focal second activation maximum. This made it unlikely that the midline occipital and left inferior frontal GBA enhancements were part of dipolar surface patterns generated by sources located in areas far distant from the sensors. We interpret these findings as support for the notion that the observed activations were most probably generated by more complex sources in the vicinity of the areas over which the GBA maxima were observed.
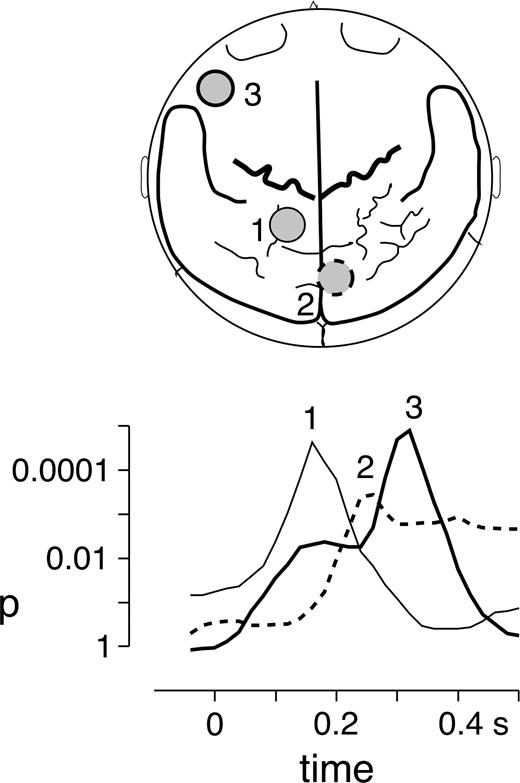
To assess time-course and topography of the spectral amplitude differences, the signals were Gabor filtered at center frequencies of 75 (width ±2.5 Hz) and 77.5 Hz (width ±2 Hz). The following spectral amplitude enhancement for the visual deviants compared to audiovisually congruent standards met the criterion of tcorr = 4.51 for signals filtered at 75 ± 2.5 Hz between 200 and 400 ms after auditory stimulus onset. The GBA increase was localized in a midline occipital sensor peaking at ∼270 ms after stimulus onset (Fig. 3). The average difference between visual deviants and standards in the time interval of 250–350 ms amounted to 0.60 fT(SD = 0.14), t(15) = 4.47, P < 0.001.
Topographies and time courses of GBA enhancements in response to visual deviants. Top: Locations of sensors showing spectral amplitude increases at 77.5 ± 2 Hz (sensors 1 and 3) and 75 ± 2.5 Hz (sensor 2) for the visual deviants compared with congruent audiovisual standards. GBA increases were localized in sensors over left posterior parietal cortex (1), midline occipital cortex (2) and over left inferior frontal cortex (3). Bottom: Time-courses of spectral amplitude differences for the three sensors that showed GBA enhancements. The curves depict the results of t-test comparisons between visual deviants and standards, i.e. P-values for time points between 50 ms before to 500 ms after stimulus onset. The thin line shows the dynamics of the posterior parietal activation at sensor 1, the dotted line represents the activation of the midline occipital sensor 2, and the bold line shows the activation at the left inferior frontal sensor 3.
At 77.5 ± 2 Hz, two sensors showed spectral amplitude effects meeting the criterion of tcorr = 4.88 between 100 and 500 ms after auditory stimulus onset (Fig. 3). An early GBA increase was identified in a left posterior parietal sensor peaking at ∼160 ms. Here the average difference between deviants and standards in the time interval of 150–250 ms amounted to 0.39 fT (SD = 0.06), t(15) = 6.01, P < 0.001. This was followed by significant spectral amplitude enhancements in a left inferior frontal sensor peaking at ∼320 ms after auditory stimulus onset. The average difference between visual deviants and standards in the latency interval of 300–400 ms amounted to 0.36 fT (SD = 0.06), t(15) = 5.97, P < 0.001. Figure 3 shows the sequence of activations starting over left posterior parietal cortex, then involving occipital early visual areas and finally reaching left inferior frontal cortex.
The left inferior frontal activation showed a striking resemblance to the GBA enhancement found previously in a syllable mismatch study with acoustic deviants (deviant: /ba/, standard: /da/) (Kaiser et al., 2002b). As shown in Figure 4, the spectral amplitude changes in response to illusory (visually induced) and real (acoustic) deviants were highly comparable both in terms of topography and time-course of activation.
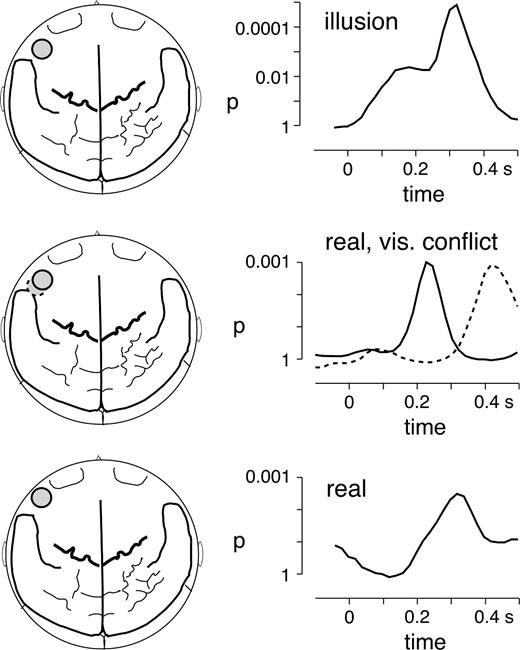
Comparison of GBA to illusory acoustic mismatch caused by an incongruent visual stimulus (top), to acoustic deviance in the presence of an incongruent visual stimulus (middle) and to purely auditory phonetic mismatch (bottom). The top left image shows the topography of the left inferior frontal sensor on a two-dimensional brain map with the major anatomical landmarks (seen from above, nose up), the top right graph depicts the time-course of the statistical difference in GBA at 77.5 ± 2 Hz between visual deviants and congruent audiovisual standards in the present study. The middle row depicts the topography and time-courses of GBA differences in the range of 75 ± 2 Hz between acoustic deviants and audiovisually congruent standards in the present study. The solid circle and line represent the activation during the first recording block, whereas the dashed circle and line depict the results during the second recording block. The bottom row shows topography and time course of activation in the frequency range of 86 ± 2.5 Hz for the processing of purely acoustic mismatch (deviant /ba/ versus standard /da/) in a previous study (Kaiser et al., 2002b).
Acoustic Deviant
For the comparison of acoustic deviants with congruent audiovisual standards, no spectral amplitude differences were identified that met the corrected t-value of tcorr = 4.05. However, when the significance criterion was lowered, a tendency was observed for GBA increases in two sensors over left inferior frontal cortex. Apparently the failure to detect these activities in the present statistical probability mapping method was attributable to the fact that the activations in response to acoustic deviants showed some spatiotemporal variability between the two recording blocks. When only the narrow frequency range between 75 and 78 Hz was considered and when both recording blocks were analyzed separately, a GBA increase at 75 Hz met the criterion of tcorr = 2.31. When the signals were filtered at 75 ± 2 Hz in the first recording block, a left inferior frontal sensor showed a spectral amplitude increase meeting the criterion of tcorr = 3.98 between 150 and 290 ms after auditory stimulus onset. The average difference between acoustic deviants and standards in the latency interval of 200–250 ms amounted to 0.52 fT (SD = 0.13), t(15) = 4.05, P = 0.001. In the second recording block, GBA at 75 ± 2 Hz was increased at a sensor located slightly more posteriorly than the one that showed the effect in the first recording block. Here the average difference between acoustic deviants and standards in the latency interval of 400–450 ms amounted to 0.59 fT (SD = 0.15), t(15) = 3.92, P = 0.001. The topography and time-courses of these effects are depicted in the middle row of Figure 4. In contrast to these inferior frontal effects, there were no posterior parietal GBA enhancements to acoustic deviants.
Discussion
Based on a McGurk-type paradigm, the present study investigated oscillatory activity in MEGs during the processing of visually induced auditory change perception. The statistical comparison of spectral responses to infrequent combinations of a visual /pa/ and an auditory /ta/ (visual deviants) with a standard stimulus characterized by congruent audiovisual /ta/ events yielded enhancements of GBA in frequency bands around 75 and 78 Hz. The analysis of topography and time-course of the filtered signals revealed the processing of incongruent audiovisual stimuli to be accompanied by enhanced GBA at single sensors over (i) posterior parietal cortex at around 160 ms after auditory stimulus onset, (ii) occipital areas (at around 270 ms) and, finally, (iii) left inferior frontal cortex (at ∼320 ms).
Increased GBA at a sensor over posterior parietal cortex during the processing of visual deviants accorded with the fMRI findings of Jones and Callan (2003) who reported more activation in both right supramarginal gyrus and left inferior parietal lobule for incongruent than congruent audiovisual stimuli. Functional imaging studies have already demonstrated that posterior biological motion processing areas including occipito-temporal and inferior parietal cortex (Bremmer et al., 2001) respond to faces performing speech movements (Calvert et al., 1997; Calvert and Campbell, 2003). Inferior parietal areas have also been implicated in the observation (and execution) of lip forms (Nishitani and Hari, 2002). Puce et al. (1998) observed activations of the posterior STS while watching both eye and mouth movements. Furthermore, temporo-parietal junction and posterior STS have been implicated both in the processing of multimodal changes in the sensory environment (Downar et al., 2000) and in multimodal integration (Beauchamp et al., 2004). The topography of the posterior parietal GBA enhancement could potentially also reflect networks involved in attentional processes (Lewis et al., 2000). However, the absence of this activation during the processing of acoustic deviants strongly supports a role in the processing of visual information rather than task-related attentional processes. Thus posterior temporo-parietal cortex may form part of a network including also superior temporal and inferior frontal cortex involved in the processing of visual speech-related movements.
Visual deviants gave rise to GBA at a sensor over occipital cortex which followed the posterior parietal activation by ∼100 ms. The detailed processing of incongruent audiovisual presentations may require attentional resources. A delayed activation of posterior areas by these stimuli may thus reflect the top-down driven modulation of earlier visual networks by higher posterior parietal motion processing regions. This interpretation would be in keeping with the notion that the attentional modulation of activity in primary visual cortex is based on delayed feedback from higher extrastriate areas suggested by combined EEG and fMRI studies (Martinez et al., 1999; Noesselt et al., 2002; Di Russo et al., 2003).
As the last step in the sequence of neuronal responses, visual deviants elicited enhanced GBA at a left inferior frontal sensor. This activation pattern was in line with previous findings of magnetoencephalographic GBA during purely auditory phonetic mismatch (Kaiser et al., 2002b). In this previous study, GBA over left anterior temporal/inferior frontal cortex was also elicited by changes in animal vocalizations or meaningless distorted noises. In contrast, auditory spatial deviations gave rise to GBA increases over posterior parietal cortex (Kaiser et al., 2000a, 2002a). These regions have been proposed to pertain to the putative auditory ventral and dorsal streams for the processing of auditory pattern versus spatial information respectively (Rauschecker, 1998). The oscillatory activities peaked ∼120 ms after the evoked mismatch fields generated at the level of the supratemporal plane. Thus both topography and time courses suggested that while evoked fields reflect a fast change detection performed by early auditory areas, GBA increases may represent a more detailed analysis of the relevant stimulus parameters in higher auditory association cortex (Kaiser and Lutzenberger, 2003).
So far, a host of animal and human studies using different methods have yielded evidence for a role of inferior frontal cortex in the processing of auditory patterns. Complex sounds including human and animal vocalizations have been demonstrated to evoke neuronal responses in macaque ventrolateral frontal cortex (Romanski and Goldman-Rakic, 2002; Poremba et al., 2003). An fMRI study in humans found left inferior frontal activation as part of a network responding more strongly to a task requiring the identification of environmental sounds than to sound localization (Maeder et al., 2001). Similarly, the analysis of phonetic and semantic properties of aurally presented words activated left prefrontal areas outside Broca's area (Binder et al., 1997). More recently, Jäncke and Shah (2002) reported activations of fronto-temporal networks including the inferior frontal gyrus during the detection of target syllables in a dichotic listening task. Noesselt et al. (2003) found activity in left inferior frontal gyrus to reflect the interaction of bottom-up (word presentation rate) and top-down driven effects in a semantic categorization task. Preattentive detection of changes in spoken words has been shown to be accompanied by magnetoencephalographic activity in left inferior frontal cortex (Pulvermüller et al., 2003). Frontal areas have also been found to be involved in a task requiring the phonological segmentation of the initial consonant from the rest of the word to perform same–different judgments (Burton et al., 2000). During working memory tasks, Alain et al. (2001) found enhanced activation of inferior frontal gyrus during pitch compared with location processing, and the short-term memorization of syllables was found to be accompanied by increased magnetoencephalographic GBA probably originating in left inferior frontal cortex (Kaiser et al., 2003). Comparing working memory for words versus voices in two-back tasks, Stevens (2004) found a predominance of left frontal cortex for verbal memory, whereas right frontal areas were more activated during voice processing. In summary, these findings provide support for an involvement of inferior frontal cortex in the putative auditory ‘what’ processing stream (Rauschecker, 1998).
In contrast to visual deviants, acoustic deviants did not elicit GBA that met the strict significance criterion of the present statistical probability mapping. This was unexpected given that a larger number of acoustic than visual deviants were detected by the subjects. However, when the significance criterion was lowered, a tendency towards GBA increases to acoustic deviants in sensors over left inferior frontal cortex was observed. A separate analysis of both recording blocks revealed that this activity varied in latency and topography between blocks with a faster, more anterior activation in the first block and a slower, more posterior increase in the second block. This variability caused the failure to detect these activations in the analysis of the average across both blocks. Considering our earlier findings of GBA to deviants in purely auditory mismatch paradigms (Kaiser et al., 2002b), this may suggest that the visual stimulus, which in the present study did not differ between audiovisually congruent standards and acoustic deviants, may have influenced the response to acoustic deviants. In addition, the spatiotemporal difference in the activation pattern between the two recording blocks suggested that the processing of acoustic deviants may have changed over time.
The GBA increases probably originating in left inferior frontal cortex in the present audiovisual mismatch study and in our previous auditory pattern mismatch experiment (Kaiser et al., 2002b) showed a high similarity both in terms of topography and time-course (Figure 4). The spatiotemporal consistency between both types of mismatch-related activations demonstrates that networks probably located in left inferior frontal cortex, which is thought of as a part of the putative auditory ventral pattern processing stream, are involved not only in the representation of purely acoustic pattern changes but also in the representation of illusory phonetic deviance even if it is caused by incongruent visual stimuli. This suggests that areas along the auditory ventral stream may be involved also in the integration of multimodal information. Synchronization of networks in this region may reflect the subjective perception of auditory pattern changes independent of physical changes in the auditory stimuli.
In contrast to passive acoustic mismatch studies, the present task required subjects to press a button in response to perceived acoustic deviance. Thus, any differences in activations between deviants and standards might be related to motor processing. This suggestion mainly concerns the parietal GBA enhancement associated with visual deviants, whereas left inferior frontal GBA increases also have been found previously during purely passive mismatch tasks (Kaiser et al., 2002b) and during the delay phase of a working-memory task lacking any motor response (Kaiser et al., 2003). Similarly it is extremely unlikely that the observed midline occipital GBA effect relates to motor activity. To test the possibility that the parietal GBA increase may be bound to response preparation, we compared the activation patterns associated with visual and acoustic deviants that both required a button-press response. GBA was significantly more pronounced to visual than to acoustic deviants [difference visual–acoustic deviants: 0.55 fT (SD = 0.16), t(15) = 3.37, P = 0.004] even though a higher percentage of acoustic deviants elicited a response. Conversely, parietal GBA did not differ between acoustic deviants and audiovisual standards. We interpret this finding as strong evidence against a possible confounding of the parietal GBA enhancement with motor processes.
The present investigation failed to detect oscillatory activity differences over auditory cortex. This was in line with fMRI findings of silent visual speech activating areas of the superior temporal gyrus excluding the primary auditory cortex (Bernstein et al., 2002) but in contrast to suggestions of auditory cortex activation by silent seen speech (Calvert and Campbell, 2003). Also, other studies of speech perception have found heteromodal areas like the STS to be predominantly involved in audiovisual integration (Calvert and Campbell, 2003). On the other hand, the absence of GBA over primary auditory cortex may have had methodological reasons. Possibly primary auditory network synchronizations may be too transient (Palva et al., 2002) to be identifiable by the present statistical probability mapping procedure which is more sensitive to temporally sustained activations.
In summary, the present study revealed the processing of visually induced auditory phonetic mismatch perception to be accompanied by increased fast oscillatory activity probably generated by neural networks within posterior parietal, occipital and left inferior frontal regions. The GBA increase over left inferior frontal is highly consistent with previous findings during a purely auditory mismatch study, suggesting a role of networks in this area for the representation both of purely acoustic pattern information and of illusory auditory changes induced by the integration of audiovisual stimuli. Furthermore, the topography of GBA increases was comparable with findings from hemodynamic imaging studies. Finally, the analysis of oscillatory signals in MEGs yielded information about the temporal sequence of activations.
We thank Maike Borutta for technical assistance. Supported by Deutsche Forschungsgemeinschaft (SFB 550/B1 and C1).
References
Alain C, Arnott SR, Hevenor S, Graham S, Grady CL (
Beauchamp MS, Lee KE, Argall BD, Martin A (
Bernstein LE, Auer ET, Jr., Moore JK, Ponton CW, Don M, Singh M (
Binder JR, Frost JA, Hammeke TA, Cox RW, Rao SM, Prieto T (
Blair RC, Karniski W (
Bremmer F, Schlack A, Shah NJ, Zafiris O, Kubischik M, Hoffmann K, Zilles K, Fink GR (
Burton MW, Small SL, Blumstein SE (
Calvert GA, Campbell R (
Calvert GA, Bullmore ET, Brammer MJ, Campbell R, Williams SC, McGuire PK, Woodruff PW, Iversen SD, David AS (
Clochon P, Fontbonne J, Lebrun N, Etevenon P (
Colin C, Radeau M, Soquet A, Demolin D, Colin F, Deltenre P (
Di Russo F, Martinez A, Hillyard SA (
Downar J, Crawley AP, Mikulis DJ, Davis KD (
Gobbelé R, Waberski TD, Schmitz S, Sturm W, Buchner H (
Gruber T, Müller MM, Keil A, Elbert T (
Gruber T, Keil A, Müller MM (
Gruber T, Müller MM, Keil A (
Jäncke L, Shah NJ (
Jones JA, Callan DE (
Kaiser J, Lutzenberger W (
Kaiser J, Lutzenberger W (
Kaiser J, Lutzenberger W, Preissl H, Ackermann H, Birbaumer N (
Kaiser J, Lutzenberger W, Preissl H, Mosshammer D, Birbaumer N (
Kaiser J, Birbaumer N, Lutzenberger W (
Kaiser J, Lutzenberger W, Ackermann H, Birbaumer N (
Kaiser J, Ripper B, Birbaumer N, Lutzenberger W (
Keil A, Müller MM, Ray WJ, Gruber T, Elbert T (
Keil A, Gruber T, Müller MM (
Lewis JW, Beauchamp MS, DeYoe EA (
Lutzenberger W, Pulvermüller F, Birbaumer N (
Lutzenberger W, Pulvermüller F, Elbert T, Birbaumer N (
Lutzenberger W, Ripper B, Busse L, Birbaumer N, Kaiser J (
Maeder PP, Meuli RA, Adriani M, Bellmann A, Fornari E, Thiran JP, Pittet A, Clarke S (
Martinez A, Anllo-Vento L, Sereno MI, Frank LR, Buxton RB, Dubowitz DJ, Wong EC, Hinrichs H, Heinze HJ, Hillyard SA (
Miltner WH, Braun C, Arnold M, Witte H, Taub E (
Möttönen R, Krause CM, Tiippana K, Sams M (
Müller MM, Bosch J, Elbert T, Kreiter A, Sosa MV, Sosa PV, Rockstroh B (
Müller MM, Gruber T, Keil A (
Nichols TE, Holmes AP (
Noesselt T, Shah NJ, Jäncke L (
Noesselt T, Hillyard SA, Woldorff MG, Schoenfeld A, Hagner T, Jäncke L, Tempelmann C, Hinrichs H, Heinze HJ (
Noreen EW (
Palva S, Palva JM, Shtyrov Y, Kujala T, Ilmoniemi RJ, Kaila K, Näätänen R (
Poremba A, Saunders RC, Crane AM, Cook M, Sokoloff L, Mishkin M (
Puce A, Allison T, Bentin S, Gore JC, McCarthy G (
Pulvermüller F, Birbaumer N, Lutzenberger W, Mohr B (
Pulvermüller F, Shtyrov Y, Ilmoniemi R (
Romanski LM, Goldman-Rakic PS (
Sams M, Aulanko R, Hamalainen M, Hari R, Lounasmaa OV, Lu ST, Simola J (
Sekiyama K, Kanno I, Miura S, Sugita Y (
Stevens AA (
Sumby WH, Pollack I (
Tallon-Baudry C, Bertrand O (
Tallon-Baudry C, Bertrand O, Delpuech C, Pernier J (
Author notes
1MEG-Center, Institute of Medical Psychology and Behavioral Neurobiology, University of Tübingen, 72076 Tübingen, Germany and 2Department of Neurology, University of Tübingen, 72076 Tübingen, Germany