


Abstract
There is a long-standing debate as to whether visual mental imagery relies entirely on symbolic (language-like) representations or also relies on depictive (picture-like) representations. We sought to discover whether visual mental imagery could evoke cortical activity with precise visual field topography (retinotopy). Participants received three conditions: the perception condition consisted of a standard retinotopic mapping procedure, where two flickering checkerboard wedges rotated around a central fixation point. The imagery and attention conditions consisted of the same stimulus, but only the outer arcs of the wedges were visible. During imagery, participants mentally reproduced the stimulus wedges, using the stimulus arcs as a guide. The attention condition required either distributed attention or focused attention to where the stimulus wedges would have been. Event-related analysis revealed that the imagery (greater than either form of attention) retinotopic maps were similar to the perception maps. Moreover, blocked analysis revealed similar perception and imagery effects in human motion processing region MT+. These results support the depictive view of visual mental imagery.
Introduction
The nature of visual mental imagery has been the source of debate for centuries. The most recent incarnation of the debate has focused on two types of mental representations. One class of theories posits that visual mental imagery relies in part on depictive representations, akin to those used in the early phases of perceiving an object (Kosslyn, 1994). Another class of theories posits that visual imagery relies entirely on language-like symbolic representations (Pylyshyn, 1973, 2002). Only the class of theories that posits depictive representations predicts activation in early visual processing regions [i.e. striate and extrastriate cortex, including Brodmann areas (BA) 17 and 18], and thus human functional neuroimaging has weighed into the debate. In numerous studies, researchers have reported that visual imagery is associated with activity in striate and extrastriate cortex (for reviews, see Kosslyn et al., 2001; Kosslyn and Thompson, 2003). Moreover, the spatial extent of the visualized objects has been shown to map onto the known spatial organization of these early visual areas (as originally documented by Inouye, 1909; Holmes and Lister, 1916; Holmes, 1917, 1945; Horton and Hoyt, 1991a, b), with objects that subtend smaller visual angles producing activity near the occipital pole (the cortical representation of stimuli in the central visual field) and objects that subtend larger visual angles producing more anterior activity (the cortical representation of stimuli in the peripheral visual field; Kosslyn et al., 1993, 1995; Tootell et al., 1998).
However, none of the existing studies strongly implicates the retinotopic aspects of early visual areas in visual mental imagery. Moreover, the available findings do not conclusively implicate specific visual brain areas. Pylyshyn (2002), the major proponent of the symbolic theory of imagery, has set a stringent criterion for support of the depictive theory, saying ‘In order to support such a view, it is important not only that such topographically organized areas be involved in imagery, but also that their involvement be of the right sort — that the way their topographical organization is involved reflects the spatial properties of the image’ (P. 175). The primary aim of the present study was to determine whether visual mental imagery could in fact activate topographically organized cortex in such a way that this activation can be directly related to the spatial geometry of the imaged stimulus. To address this issue, we used event-related functional magnetic resonance imaging (fMRI) to construct retinotopic maps on an individual-participant basis in each of three conditions: perception, imagery and an attentional/perceptual control (hereafter referred to simply as the attention condition).
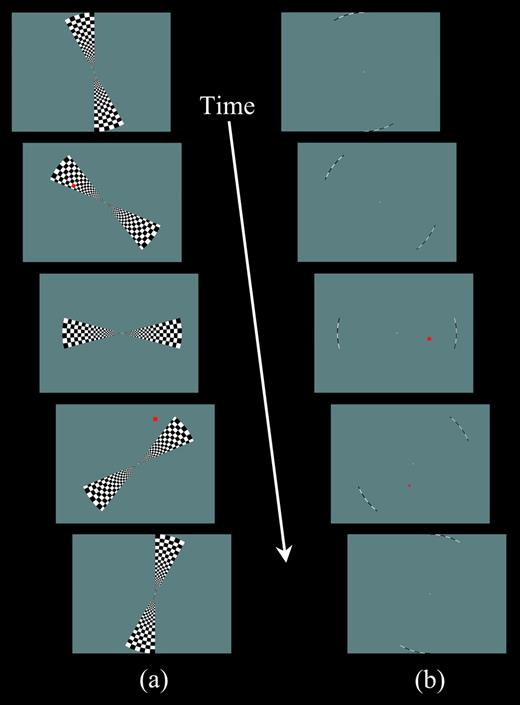
The perception condition employed rotating checkerboard stimulus wedges (Fig. 1a) to produce standard retinotopic maps in striate (V1) and extrastriate cortex (V1, V2, VP, V3, V4v, V3A; Sereno et al., 1995; DeYoe et al., 1996; Engel et al., 1997; Slotnick et al., 2002; Slotnick and Yantis, 2003; Slotnick and Moo, 2003). Participants were instructed to view the stimulus as it rotated about a central fixation point. Red target squares appeared on the screen at variable points in time, and participants indicated whether the square was inside or outside of the wedges. In the imagery condition, participants visualized in their ‘mind's eye’ the same wedges that they had observed during the perception condition, using the outer arcs of the rotating wedges as guides (Fig. 1b). The participants were asked to mentally reproduce the wedges as vividly and accurately as possible, keeping all details of their mental image as close as possible to the perceptual stimulus. As in the perception condition, red target squares appeared at variable points in time and the participants indicated whether the squares were inside or outside of the imagined wedges. Because it has been argued that imagery is essentially the same process as attention (see, for example, Pylyshyn, 2002), an attention condition was also administered to control for the effects of attention and perception (see detailed description and rationale in Materials and Methods). Although rotating arcs were presented, as during the imagery condition, participants attended to the display without visualizing the rotating wedges (they were explicitly instructed not to do so). As before, red target squares appeared, but in this case participants indicated whether they were on the left or right side of the screen. During this task, we expected the participants' attentional resources to be distributed across the visual display, such that the attention condition could serve as a control for general effects of attention. Moreover, because the attention condition was perceptually identical to the imagery condition and involved comparable responses, it could serve as a perceptual/motor control to which the effects of imagery could be compared. (As noted below, an additional attentional control was later added to consider the effects of attending specifically to the regions defined by the visual arcs.)
Snapshots of stimulus displays. (a) The bifield stimulus used in the perception condition. At the onset of each cycle, the two stimulus wedges began to ‘unfold’ from the upper and lower vertical meridia, achieving their full polar angle width of 30° at 6 s (top panel), then smoothly rotated counterclockwise until abutting the vertical meridia (bottom panel), and ‘folded’ into the vertical meridia. Each cycle lasted 54 s, including 42 s of stimulation by the rotating wedges with a trailing 12 s fixation period. A scan consisted of eight cycles. Participants were instructed to identify whether a briefly flashed red square was inside or outside the stimulus wedges (e.g. panels 2 and 4, respectively). (b) The bifield stimulus used in the imagery and attention conditions. The stimulus was identical to that used in the perception condition, except only the outermost arc (thickness 0.2° of visual angle) of the stimulus was shown. For the main experiment, in the imagery condition, participants received the same instructions as in the perception condition (e.g. panel 3 ‘inside’ and panel 4 ‘outside’), whereas in the attention condition, participants were instructed to identify whether the red square was in the right or left hemifield (as illustrated in panels 3 and 4). For the follow-up experiment in the attention condition, participants received the same judgment instructions as in the perception condition.
In order to obtain evidence that imagery does in fact activate retinotopically mapped areas, two requirements must be met: first, the imagery retinotopic maps must evince the appropriate topographic organization, similar to that obtained in the perception condition; second, this activation cannot be due to the physical stimulus or the act of attending to it — and thus it must be present even when activation evoked during the attention control task is removed. In addition to allowing us to discover whether these requirements are met, the present study allowed us to compare directly the cortical regions that have sustained activity during the epochs of perception, imagery and attention, which was possible given that the experimental protocol was both event-related (with respect to retinotopic organization) and blocked (with respect to the different conditions — attention, imagery and perception).
Materials and Methods
Participants
Six participants took part in the main experiment (3 females and 3 males, mean age ± SD = 21 ± 1.1 years) and six different participants took part in the follow-up experiment (4 females and 2 males, aged 22 ± 2.6 years). All participants had normal or corrected-to-normal visual acuity. The Harvard University Institutional Review Board and the Massachusetts General Hospital Institutional Review Board approved the protocol. For each participant, informed consent was obtained for both behavioral and fMRI aspects of the study.
Main Experiment
Stimulus and Tasks
We used two stimulus configurations, both with a central fixation point. The first stimulus consisted of two rotating checkerboard wedges (stimulus wedges) that spanned a maximum of 30° in polar angle width and extended 12.3° of visual angle from fixation. This stimulus consisted of elements that were scaled by the human cortical magnification factor (Slotnick et al., 2001), and flickered at 8.3 reversals/s (Fig. 1a). Each cycle lasted 54 s, including 42 s of stimulation with a trailing 12 s period of fixation; a scan included eight cycles. This stimulus configuration was designed to efficiently elicit robust retinotopic activity in early visual areas (Slotnick and Yantis, 2003). The second stimulus consisted of two rotating checkerboard arcs (stimulus arcs), identical to the wedge stimulus except that only the outermost edge of the stimulus was visible (with a thickness of 0.2° of visual angle; Fig. 1b).
In all three conditions, perception, imagery and attention, a red target square was presented every 2–8 s. This square was scaled by the cortical magnification factor (Slotnick et al., 2001), and appeared for 120 ms either inside or outside the spatial extent of the stimulus wedges — or, for the imagery and attention conditions, where the wedges would have been — and on either the left or right side of the display. The square appeared with equal probability inside/left, outside/left, inside/right and outside/right. Given that the onset time and location of the target were pseudorandom (occurring within the specified temporal and spatial constraints), target presentation was not identical in the three conditions; however, such non-retinotopic differences would not produce different retinotopic effects among the conditions. Prior to scanning, participants took part in a training session, during which they completed two eight-cycle sets of trials in the perception condition, followed by alternating four-cycle imagery and perception sets (five in total), and finally one full set of the perception, imagery and attention conditions.
The primary purpose of the training session was to allow participants to memorize the appearance of the stimulus wedges, so that they could form accurate visual images of this stimulus. In order to do so, the participants were asked to observe carefully and notice all aspects of the stimulus during perception. They were specifically directed to pay attention to the size of the squares, the rate of flicker, the rate of movement of the wedges and the general appearance of the stimulus. When they returned to a perception set after imagery, they were asked to compare the actual stimulus to the one that they visualized, and to correct any inaccuracies in their image. This procedure was designed to allow the participants to perfect their images over the course of training. The training session also allowed participants to practice the behavioral tasks associated with each condition (described below), for which manual responses were made with index and middle fingers of the right hand using the 1 and 2 keys on a standard keyboard.
After training, participants took part in the test conditions while being scanned. To help participants remember the perceptual properties of the rotating flicker checkerboard wedge during imagery (in an effort to maximize retinotopic imagery effects), imagery scans always followed perception scans. Labeling the perception–imagery pairs of scans as B and attention scans as A, the first six scans were equally often in the ABBA and BAAB configuration across participants (whereas the last three scans, if administered, were in the AB or BA configuration). In the perception condition, participants viewed the stimulus wedges and decided whether each red target was inside or outside of the stimulus wedges (Fig. 1a), pressing the appropriate button with the index or middle finger of the right hand to indicate their judgment. In this and the other two conditions, speed and accuracy were stressed as equally important, and participants were instructed to maintain central fixation throughout.
In the imagery condition, participants viewed the stimulus arcs, but no rotating checkerboard wedges were actually present. First and foremost, participants were instructed to visualize the rotating and flickering checkerboard wedges by mentally filling in the pattern from the arcs to the fixation point so that in their ‘mind's eye’ the flickering checkerboard wedges could be ‘seen’ in their entirety. We again presented the square probes, and the judgment was identical to that in the perception condition, except that participants now decided whether each red target was inside or outside of the visualized wedges (Fig. 1b). Participants were periodically reminded to visualize the stimulus as vividly and accurately as they could with the aim of generating an image such that they had the impression of seeing the stimulus in front of them.
In the attention condition, participants viewed the stimulus arcs (identical to those presented in the imagery condition), and now decided whether the red target was on the right or left side of the screen (Fig. 1b). We specifically told the participants not to visualize the stimulus wedges. This attention condition served as (i) a perceptual control task for the imagery condition (in the event-related analysis); and (ii) a sustained attention task to compare with the imagery condition (in the blocked analysis).
Because the attention condition, like the imagery condition, featured the perception of rotating arcs, the attention task controlled for the possibility that retinotopic effects observed in imagery were due to the perception of the arcs. In addition, because some researchers have claimed that imagery is essentially the same process as attention (see, for example, Pylyshyn, 2002), the act of attending to the visual display while waiting for the red squares to appear on the left or right side of the screen (in the attention condition) allowed us to distinguish imagery from this sort of attention. It is important to note, however, that in neither the imagery nor the attention conditions were the participants instructed to attend to the rotating arcs on the screen. In the imagery task, they were to visualize the checkerboards memorized in the perception condition; in the attention task, they were to identify the location of the red target squares (which could appear in a variety of positions, left, right, top or bottom, on the screen).
Behavioral Analysis
We used the following three measures to assess behavioral performance in the perception, imagery, and attention conditions: (i) detection: the probability that a response was made following a target (at any time before the subsequent target); (ii) identification: the probability that the correct response was made, given that a target had correctly been detected; and (iii) response time: the time required to evaluate a target.
For each of the three measures (detection, identification and response time), we first conducted a two-factor within-participant analysis of variance (ANOVA) with condition × target location as factors. Significant main effects were further examined by the appropriate paired contrasts (e.g. by collapsing over the non-significant factor), and significant interactions were further examined by paired contrasts. Paired contrasts were conducted using a paired t-test. A P-value of <0.05 was taken to be statistically significant, a P-value between 0.05 and 0.10 was considered to be marginally significant, and a P-value of >0.10 was taken to be non-significant.
Follow-up Experiment
The follow-up experiment controlled for the possible effects of focused attention. This experiment incorporated the same general protocol as the main experiment, with three differences: first, we administered only perception and attention conditions. All participants completed attention scans first to avoid perceptual experience with the rotating flickering checkerboard wedges, which may have led participants (voluntarily or involuntarily) to visualize the wedges during the attention condition. Second, instead of an extended training session days before scanning, we provided a brief training session immediately before scanning. Third, the perception and attention conditions both incorporated the same task, requiring the participants to indicate whether each target was inside or outside the stimulus wedges (for the perception condition) or the region of space in which they would have appeared (for the attention condition), which was defined to the participants as the region bounded by the arcs and lines extending from their endpoints to the central fixation point.
fMRI
The fMRI procedures for the main experiment and follow-up experiment were nearly identical; therefore, what follows is a single description with any differences noted as appropriate.
Data Acquisition and Pre-processing
Participants were supine and viewed the stimulus display through an angled mirror, which was situated at the end of the magnet bore. The stimulus display subtended 24.6° of visual angle in the vertical dimension (which dictated the outer diameter of the rotating stimuli). Similar to the training session, participants made manual responses with index and middle fingers of the right hand using a fiber optic response box.
All images were obtained using a 3 T Siemens Allegra MRI scanner with a standard head coil. T1-weighted anatomic images were acquired using a multiplanar rapidly acquired gradient echo (MP-RAGE) sequence (TR = 30 ms, TE = 3.3 ms, flip angle = 40°, field-of-view = 256 × 256 mm, acquisition matrix = 256 × 256, slices = 128, slice thickness = 1.33 mm, no gap — 1 × 1 × 1.33 mm resolution). T2*-weighted functional images were acquired using an echo planar imaging (EPI) sequence (acquisition time = 7 min 12 s, TR = 3000 ms, TE = 30 ms, flip angle = 90°, field-of-view = 192 × 192, acquisition matrix = 64 × 64, slices = 45, slice thickness = 3 mm, no gap — 3 mm isotropic resolution). Each participant completed one anatomic scan and either nine functional scans (i.e. three scans of each condition for participants 1–4) or six functional scans (two scans of each condition for participants 5 and 6) in the main experiment and four functional scans (two scans of each condition for all participants) in the follow-up experiment.
The first steps of pre-processing were conducted using SPM99 (Wellcome Department of Cognitive Neurology, London, UK). Functional data were first slice-time corrected and then motion corrected such that all scans for each participant were aligned to within ∼0.1 mm and ∼0.1° or less, thus eliminating potential differences in spatial alignment that might have been confounded with trial type. All subsequent pre-processing and data analysis were conducted using BrainVoyager (Brain Innovation, Maastricht, The Netherlands). Functional data were then spatially smoothed through convolution with a 6 mm Gaussian kernel, temporally smoothed through both linear trend removal and removal of temporal components below 3 cycles per scan, and transformed into Talairach space. After each anatomic volume was transformed into Talairach space (Talairach and Tournoux, 1988), it was segmented at the gray/white matter boundary of each hemisphere; the reconstructed surface of this boundary served as a three-dimensional representation of the cortical surface, which was used to display functional results.
Event-related Analysis
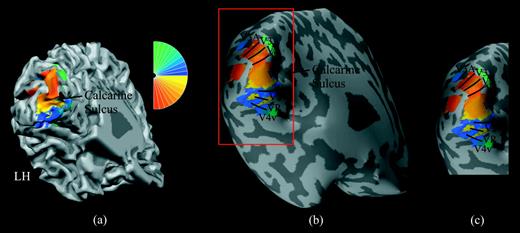
As has been conducted routinely (Sereno et al., 1995; DeYoe et al., 1996; Engel et al., 1997; Slotnick et al., 2002; Slotnick and Yantis, 2003; Slotnick and Moo, 2003), an event-related correlation analysis was used to obtain retinotopic maps associated with the perception condition. First, we generated multiple square wave protocols that were time-locked to different positions of the stimulus wedges (i.e. phases). For example, the square wave associated with stimulation of the upper and lower vertical meridian began with an amplitude of 1 at 0 s (indicating stimulation onset), and this amplitude remained constant until 6 s from onset, when it fell to 0 (indicating no stimulation), then rose again at 54 s from first onset (indicating the beginning of the second cycle), fell again at 60 s, and so on, for eight cycles. A square wave shifted 3 s in time (i.e. the first cycle amplitude increased at 3 s and decreased at 9 s) represented slightly later stimulation in each cycle. A series of 14 such square waves, successively shifted by 3 s, represented stimulation of the entire visual field (14 phases × 3 s/phase = 42 s), with a phase resolution of 3 s (or 15°). Each phase was paired with a color that indicated its association with stimulation of a unique position in the visual field (Fig. 2a, upper right). The hemodynamic response model associated with each of these phases was estimated through convolution with an impulse response function (see Cohen, 1997). For every voxel in the brain volume, these 14 hemodynamic response models were correlated with the activation time course, the maximum correlation of which dictated the color that was subsequently ‘painted’ on the cortical surface (see color wheel in Fig. 2a). Color/phase reversals demarcated the borders between early visual areas (Fig. 2b). We constructed retinotopic maps for the imagery and attention conditions with the identical protocol.
The left-hemisphere retinotopic map of one participant. (a) Cortical surface reconstruction of left hemisphere with gyri and sulci shown in light and dark gray, respectively (left is toward the left, superior is toward the top, with a −30° pitch and a +30° yaw). The phase of right visual field stimulation is color coded such that red and yellow represent the lower right quadrant and blue and green represent the upper right quadrant (see color wheel to upper right). The calcarine sulcus separates the dorsal and ventral visual areas, where the dorsal visual areas represent the lower right quadrant (i.e. red and yellow are represented dorsally) and ventral visual areas represent the upper right quadrant (i.e. blue and green are represented ventrally). The projection of these colors onto the cortical surface constitutes a retinotopic map. Reversals of color in the map demarcate borders between visual areas, although such borders are difficult to identify on this convoluted surface. Note that the right-hemisphere retinotopic map (not shown) has the opposite color scheme (with red/yellow dorsally and blue/green ventrally). (b) An inflated representation of the same left-hemisphere cortical surface and retinotopic map, where color reversals (i.e. visual area borders) can easily be identified. Borders between visual areas are demarcated with black curves, and striate (V1) and extrastriate (V2, VP, V3, V4v, V3A) cortical regions are labeled in black. The red rectangle delineates the cortical region that contains the retinotopic map. (c) Selected left-hemisphere cortical region with retinotopic map, as used in Figures 4 and 5.
For a given participant, there is often some degree of variability in the quality of the retinotopic maps; this variability is manifested in the level of noise in the maps (i.e. the ease of identifying early visual area borders, not the location of early visual borders themselves). Because of this variability in map quality, averaging across multiple mapping scans typically produces a worse result than selecting the single highest quality map. Therefore, in an effort to maximize the quality of data entered into the analysis, we implemented a fully automated procedure in MATLAB (The MathWorks Inc., Natick, MA) to select the highest quality perception map for each participant. We computed an average perception retinotopic map (after concatenating all scans) in addition to a map for each individual perception scan. The highest quality perception retinotopic map was selected using two quantitative measures: (i) we used a measure of phase overlap, that is, the phase–phase correspondence between active voxels in each perception map as compared to the average perception map. This measure was computed by plotting, for all active voxels, the phase of each perception map as a function of the corresponding phase of the average perception map (i.e. a phase–phase plot; see Brefczynski and DeYoe, 1999); the slope of the best-fit line represented phase–phase correspondence (where a slope of 0 = no correspondence and a slope of 1 = perfect correspondence). Values of >1, which rarely occurred, were converted into equivalent values of <1 (in terms of proximity to perfect correspondence; e.g. 1.1 was converted to 0.9), to enforce a maximum slope of 1 for reasons discussed immediately below. (ii) We also used a measure representing map spatial extent, the number of voxels active in each perception map divided by the total number of voxels active in the average perception map (i.e. fraction of voxels active, where a fraction of 0 = no activity and a fraction of 1 = the same degree of activity). Given that phase–phase correspondence and fraction of voxels active (which correspond to measures of retinotopic organization and spatial extent) could both be considered important aspects of map quality, and both have a similar range of 0–1, the individual map with the highest sum of these values was selected as the highest quality perception map.
After this, again for each participant, we subsequently generated retinotopic maps for all imagery and attention scans. The single scan of each type that most closely matched the participant's identified highest quality perception retinotopic map was selected using the identical automated procedure described above for both conditions (thus eliminating the possibility of selection bias). That is, phase–phase correspondence was calculated by comparing each imagery or attention map with the perception map identified as best, and the fraction of voxels active was computed by comparing each imagery or attention map with the selected perception map. As before, for each condition, the individual map with the highest sum of these values was selected as the highest quality imagery or attention map. In addition, we used phase–phase correspondence and the fraction of voxels active to compare the quality of the imagery map and the quality of the attention map (with paired one-tailed t-tests, given that we predicted that imagery effects would be greater than attention effects, a priori). We used the same procedure to compare the quality of the imagery map and the quality of the attention map in the follow-up experiment (with between-experiment one-tailed t-tests), as well as to compare the quality of the attention maps in the two experiments (with between-experiment two-tailed t-tests). We used between-hemisphere variability to estimate variance (Slotnick et al., 2003). The highest quality map associated with each of the three conditions for each participant was used in both the event-related analysis for the main experiment and the follow-up experiment, as well as in the blocked analyses for the main experiment (see below).
In the main experiment, to disentangle the effects of visual imagery with those of sensory stimulation (elicited by the rotating stimulus arcs), we needed to determine whether (and, if so, the degree to which) retinotopic activity associated with imagery was greater than that elicited by attention. Towards this end, we computed an imagery > attention contrast on a voxel-by-voxel basis whereby: (i) the imagery correlation had to exceed the statistical threshold (indicating imagery-related activity); (ii) the difference between the imagery and attention correlation had to exceed a statistical threshold (indicating significantly greater imagery-related activity than attention activity); and (iii) the attention correlation could not exceed the statistical threshold (indicating no significant attention-related activity). This method of contrasting the two retinotopic maps was designed to isolate imagery-specific activity from potentially confounding sensory or attention effects. We similarly performed an attention > imagery contrast to consider the possibility that attention activated early visual areas more strongly than did imagery.
Blocked Analysis
We conducted a blocked analysis only for the main experiment. For this analysis, we used a single hemodynamic response model (generated in a way similar to that described above) for each condition, which specified sustained activity during the eight stimulus epochs (42 s each) followed by a decrease in activity between the stimulus epochs (12 s each). For each participant, a general linear model was used; we fit the hemodynamic response model associated with the three conditions to the time course of activation of each voxel in all scans. This procedure yielded beta-weights corresponding to the perception, imagery, and attention conditions. We then entered these beta-weights into a second-level statistical analysis to discover which effects were consistent across participants. We used the method of cognitive conjunction (Friston et al., 1999; Caplan and Moo, 2004) to determine the common neural regions associated with two conditions (e.g. perception + imagery), whereas we used contrasts between conditions to determine the neural regions that were unique to a particular condition, relative to another condition (e.g. imagery > attention).
Event-related time courses were extracted from a spherical region-of-interest with a radius of 5 mm (for complete details, see Slotnick and Schacter, 2004). Each time course was baseline corrected such that the percentage signal change from 3 to 0 s preceding stimulus onset was equal to 0. In addition, event-related time courses were corrected for linear drift.
Statistical Thresholds
In an effort to minimize Type I error, a statistical threshold of P < 0.05, was selected a priori. To determine the appropriate correlation and difference-of-correlation values to enforce this threshold, we conducted simulations using MATLAB and BrainVoyager. Specifically, we generated artificial functional datasets in MATLAB, using a random noise generator with a uniform distribution, with the appropriate spatial dimensions (64 × 64 × 45) and intensity range (700–800 units) to match the actual functional datasets. Using BrainVoyager, these artificial datasets were then subjected to the identical spatial and temporal filtering pre-processing procedures (including spatial convolution with a 6 mm Gaussian kernel resulting in Gaussian distributed noise), and analyzed using the same phase correlation protocol as the actual datasets. This produced a set of noise generated ‘retinotopic maps’. To determine the threshold for the correlation maps, the correlation was steadily increased from 0 (in units of 0.01) until 5% of the voxels were deemed active (i.e. P = 0.05); this correlation threshold was determined to be r = 0.30.
To determine the threshold for the difference-of-correlation maps (i.e. imagery > attention and attention > imagery), we first subtracted the correlations associated with pairs of noise maps to produce difference maps. Voxels were deemed active if the first map had a correlation of >0.30, the second map had a correlation of <0.30 (in parallel with the actual difference-of-correlation procedure), and the difference-of-correlation was above a to-be-determined threshold value. The difference-of-correlation was steadily increased until 5% of the voxels were deemed active, yielding a difference-of-correlation threshold of 0.05. No simulations were needed for beta-weight analysis because the P-value could be set directly.
For the blocked analysis, an individual voxel threshold of P < 0.01 was enforced for all statistical comparisons, corrected for multiple comparisons to P < 0.05. To correct for multiple comparisons, we conducted a Monte Carlo simulation using MATLAB. Given an acquisition volume (i.e. 64 × 64 × 45), an assumed Gaussian spatial autocorrelation of 4.5 mm full-width-half-maximum (as has been reported empirically; Aguirre et al., 1997), an individual voxel threshold (i.e. P = 0.01) and a corrected threshold (i.e. P = 0.05), we used this simulation to generate activity in accordance with Type I error (by assuming it was equal to the voxel threshold) and then tallied the number of each set of contiguous voxels. Because clusters of systematically increasing size are less probable, a spatial extent threshold can be determined where clusters of a greater size occur less frequently than the corrected threshold; this is the cluster extent threshold (to correct for multiple comparisons). After averaging the results from 1000 simulations, we determined a cluster extent threshold of five contiguous voxels for an individual voxel threshold of P = 0.01. This converts to a threshold volume of 135 mm3. For cortical surface-based analysis, assuming a spherical volume of activity, the individual voxel threshold of P = 0.01 translated to threshold surface area of 41 mm2. Additional details regarding cluster extent threshold correction for multiple comparisons have been described elsewhere (Slotnick, 2004; Slotnick and Schacter, 2004).
Results
Behavioral Results
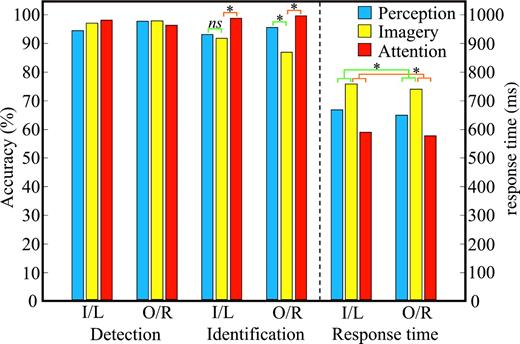
The behavioral results are shown in Figure 3. We did not find an effect of condition (when comparing perception, imagery and attention) or target location (inside/outside or left/right) on the probability of detecting targets [Fcondition(2,10) = 2.54, P > 0.10; Flocation(1,5) = 3.41, P > 0.10; Fcondition×location = 2.93, P > 0.10]. In contrast, we did find differences among the conditions in the probability of identifying the targets (with relatively greater accuracy for the attention condition), but no effect of target location and a marginally significant condition × location interaction [Fcondition(2,10) = 21.44, P < 0.001; Flocation(1,5) < 1; Fcondition×location = 3.71, P = 0.062]. To determine whether the marginally significant interaction could have been driven by the perception and imagery results, a post hoc ANOVA was conducted in which only these conditions and target location were included as factors. This restricted analysis revealed that the conditions differed (with relatively greater accuracy for the perception condition), again with no main effect of target location, but now with a significant condition × location interaction [Fcondition(1,5) = 15.17, P < 0.05; Flocation(1,5) < 1; Fcondition×location = 11.40, P < 0.05]. Paired contrasts between perception and imagery showed no difference in identification accuracy for targets inside the stimulus wedge (P > 0.10) but revealed that participants were less accurate during imagery than perception for targets outside the stimulus wedge (P < 0.01). This decreased accuracy for targets outside the imagined wedge may serve as a behavioral marker for visual imagery; more specifically, the cognitive resources employed to generate, maintain and rotate the image in the inner locations may come with a cost of misidentifying targets in the outer locations. The paired contrasts between imagery and attention indicated that participants identified probes more accurately during the attention condition, regardless of target location (P < 0.05 in both cases) — which suggests that imagery and attention, as defined here, rely on at least some distinct processes. More specifically, this result can be taken as evidence that imagery is not simply a more focused form of attention; if it were, it should have been easier to identify targets on the image than when attention was distributed. This was not the case.
Behavioral results from the perception, imagery and attention tasks of the main experiment. For each target location (for the perception and imagery conditions, I = inside stimulus wedge, O = outside stimulus wedge; for the attention condition L = left visual field, R = right visual field), accuracy of detection and identification (ranging from 0 to 100%) in addition to response time are shown for each condition (see key to upper right). The dashed line separates the accuracy panel from the response time panel. Planned comparisons (see text) between perception and imagery, in addition to imagery and attention, are indicated in green and orange, respectively. Asterisks demarcate significant results.
The response time results revealed only that the participants took different amounts of time across conditions, with no effect of location [Fcondition(2,10) = 12.22, P < 0.01; Flocation(1,5) = 1.30, P > 0.10; Fcondition×location < 1]. As such, paired contrasts were conducted after collapsing over target location. The participants required more time in the imagery condition than in the perception (P < 0.01) and attention (P < 0.001) conditions. Again, if imagery were a focused form of attention, we would not have expected this result — participants should have been faster when focusing on the wedges. The relatively slow response times in the imagery condition were not simply due to a speed accuracy trade-off: the participants also identified probes less accurately in the imagery condition as compared to the perception and attention conditions (albeit only for outer target locations in the perception condition).
Although this pattern of results allows us to argue that imagery is not simply a form of attention, it also raises the specter of a potential confound, namely between task effects and overall level of difficulty — the imagery task was more difficult than the attention task. We have two responses to this concern. First, ‘difficulty’ is an explanation that itself is in need of an explanation: why is one task more or less difficult than another? This must reflect differences in processing — which must be specified for this counter-explanation to have force. Second, a counter-explanation resting on differences in difficulty may account for a result by appealing to arousal or some other general factor. This possibility can be countered by the fact that the differences between the conditions were specific to particular brain regions (results which are discussed below). We see no mechanism by which task difficulty per se could give rise to highly specific retinotopic activity in early visual areas. Indeed, the imagery task was more difficult than the perception task, and yet the perception task produced much more robust retinotopic maps than those produced during the imagery task (as shown below). Similarly, the blocked analysis results revealed greater early visual area activity during perception than imagery (see below), further arguing against the possibility of difficulty-related effects (when comparing the imagery and attention conditions).
Event-related fMRI
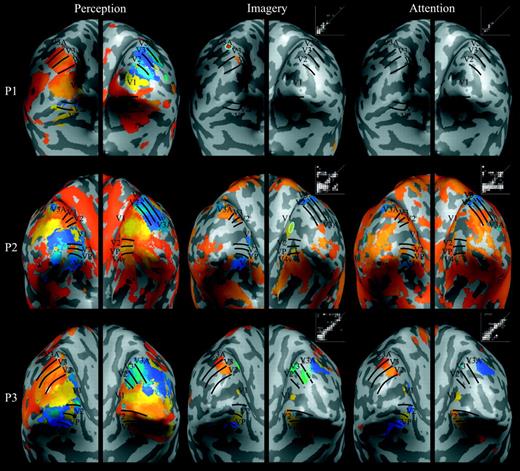
Figure 4 shows the retinotopic maps associated with the perception, imagery, and attention conditions for all six participants in the main experiment. As has been discussed previously (Slotnick and Moo, 2003), although certain phases appear to have greater spatial extent (e.g. yellow, which represents the spatial location just below the horizontal meridian; see the color wheel in Fig. 2a) while others have less spatial extent (e.g. green, which represents the vertical meridian), such differences appear to reflect non-classic but consistent retinotopic organization, such as the neural representation of the horizontal meridian being below the horizontal meridian of the visual field. Nevertheless, each early visual area has a unique quandrantic representation (Fig. 2), and thus borders between visual areas can be identified by reversals in phase/color. We were able to identify borders between early visual areas in all hemispheres using the perception retinotopic maps (Fig. 4, left column). Critically, the imagery retinotopic maps evidenced clear retinotopic organization (Fig. 4, middle column) within striate cortex (V1) in the majority of participants, and within extrastriate cortex (V2, VP, V3, V4v, V3A) in all participants, albeit not to the degree evident in the perception retinotopic maps (i.e. the imagery maps could not be used to identify visual area borders). For example, in Participant (P) 2, imagery-related activity of the appropriate phase was evident in the right hemisphere of V1 (using the perception map as a reference); in P5, note the largely intact imagery-generated border between right-hemisphere visual areas V2 and VP (also of the appropriate phase). The phase–phase plots in Figure 4 (middle column) also show that imagery maps were retinotopically organized, given that there was consistent activity along the diagonal (which represents perfect correspondence).
Retinotopic maps elicited during perception, imagery, and attention in the main experiment. For each of the six participants (P1–6), retinotopic maps were projected onto inflated cortical regions of the left and right hemispheres (see Fig. 2). Borders among early visual areas were identified from the perception maps (shown on the left) and transferred onto the imagery and attention maps (shown in the middle and on the right, respectively), which allowed assessment of retinotopically organized activation during imagery and attention in striate and extrastriate cortex. A phase–phase plot is shown to the upper right of each imagery or attention map — each white circle represents the phase of an active voxel in the imagery or attention map (y-axis) as a function of the corresponding phase in the perception map (x-axis). Circles that fall near the white diagonal line delineate retinotopically organized imagery- or attention-related activity, and the total number of circles represents the extent of activity. Cyan ovals demarcate regions in striate and extrastriate cortex where imagery-related retinotopic activity was significantly greater than attention-related retinotopic activity (imagery > attention contrast). There were no such retinotopically organized regions associated with the attention > imagery contrast.
However, we also observed some evidence for retinotopic organization in the maps for the attention condition (Fig. 4, right column). Qualitatively, these attention maps appear more restricted in their spatial extent, and in particular may be associated with more peripheral activity than the imagery maps (i.e. the approximate location of the stimulus arc, more anterior than the central visual field representation near the occipital pole). Even so, this pattern of activity in addition to the corresponding phase–phase plots (Fig. 4, right column) suggests that the small stimulus arcs may produce retinotopic activity, which in turn may imply that the retinotopic maps in the imagery condition also include effects of visual–perceptual processing.
To isolate the effects of imagery per se, we statistically contrasted the imagery and attention maps (see Materials and Methods). The imagery > attention contrast revealed a number of retinotopically organized regions within striate and extrastriate cortex, all of which are bounded by cyan ovals in Figure 4 (middle column), although this activity clearly had a smaller extent than that in the perception retinotopic maps. For example, observe the largely intact border between V2 and V3 in the right hemisphere of P6. Although the retinotopic organization of the imagery > attention regions can be observed directly through comparison with the corresponding perception map regions, we also computed phase–phase correspondence to quantify the similarity of phase between each imagery (versus attention) map and the corresponding perception map (where a value of 0 indicates no correspondence and 1 indicates perfect correspondence). The five participants for whom we found regions where there was greater activity during imagery than during attention had phase–phase correspondences ranging from 0.43 to 0.97, with a mean ± SE of 0.64 ± 0.11, indicating that the activity in these regions was retinotopically organized. The attention > imagery contrast revealed activity only for P2 — but this activity was not retinotopically organized, as shown by the phase–phase correspondence of 0.17 [a value significantly less than those associated with the imagery > attention regions; t(4) = 4.19, P < 0.01]. Indeed, the fact that this participant's attention map was relatively extensive, chaotic, and generally of the red/orange phase that was associated with the beginning of each stimulus cycle (see the color wheel in Fig. 2a) suggests that these effects were due to transient global state changes that were time-locked to the onset of each stimulus cycle. Overall, imagery > attention retinotopic effects were observed in striate cortex in 3/6 participants and in extrastriate cortex in 4/6 participants whereas retinotopic attention > imagery effects were not observed in any participant within striate or extrastriate cortex. (Additional quantitative analyses are conducted below.)
Focused Attention Control
The results suggest that visual mental imagery can elicit retinotopically organized activity in striate and extrastriate cortex; however, it is possible that these effects were not due to imagery per se but rather were due to the effects of focused attention (e.g. Hopfinger et al., 2000, 2001; Corbetta et al., 2002; Liu et al., 2003; Slotnick et al., 2003). That is, the inside/outside target identification task during the imagery condition may have required more focused attention to the region between the fixation point and the stimulus arc than was required in our attention control — and this focused attention could have produced retinotopically organized striate and extrastriate activity. The left/right target identification task controlled for distributed attention, not focused attention. To ensure that our imagery effects were not due to focused spatial attention, we conducted a follow-up experiment with six additional participants (see Materials and Methods). The follow-up experiment consisted of only the perception condition and an attention condition. During this new attention condition, we asked the participants to attend to the same region of space in which participants formed images during the main experiment, and to perform the same inside/outside judgment task — but now relative to the region being attended, not the stimulus itself. We did not include an imagery condition because we worried that participants, once familiar with the imagery task, would use imagery even in this focused attention condition (or, if we always presented imagery after attention, that we would only show effects of practice or fatigue that were confounded with task order). By including the same perceptual task in both the main experiment and this follow-up experiment, we were able to use this task as a baseline that would allow us to assess whether the two studies had comparable sensitivity. Thus, if comparable perception maps are found in both experiments, but greater retinotopic effects are observed during the imagery condition of the main experiment than during the attention condition of the follow-up experiment, the imagery effects can be considered due to imagery per se and not focused attention.
The behavioral performance on the perception and attention tasks (collapsing over target location and condition) in the follow-up experiment were comparable to performance in the main experiment on measures of target detection [F(1,10) < 1], identification [F(1,10) = 1.34, P > 0.10] and response time [F(1,10) = 3.08, P > 0.10]. Similar to the planned comparison results between attention and imagery of the main experiment, the attention condition in the follow-up experiment was associated with better target identification and faster response times than the imagery condition in the main experiment. Although these effects did not achieve statistical significance (identification P = 0.10 and response time P = 0.28), they provide convergent evidence that imagery is not merely a form of focused attention (which would predict the opposite pattern of results).
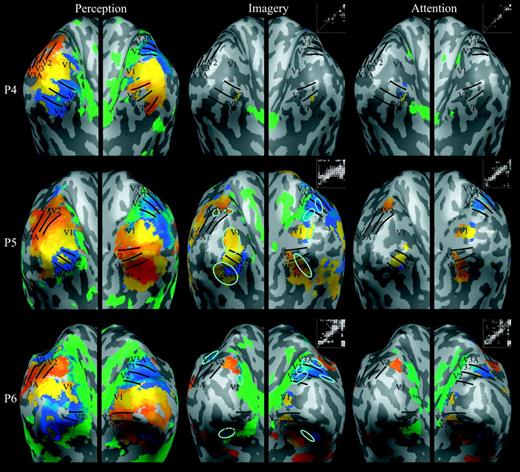
Furthermore, there were no significant differences between the number of active voxels in the perception maps we obtained in the main experiment and those we obtained in this follow-up experiment [t(22) < 1], which confirms that the studies had comparable sensitivity. Figure 5 illustrates the perception and attention maps for all participants (P7–12) in the follow-up experiment. Qualitatively, the perception and attention maps of the follow-up experiment appear to have a similar retinotopic organization and spatial extent as those obtained in the main experiment (compare Fig. 5 to Fig. 4). These effects were quantified using two measures: (i) phase–phase correspondence (as described above); and (ii) fraction of voxels active, which was the number of active voxels in each imagery or attention map divided by the number of active voxels in the corresponding perception map (where 0 indicates no activity and 1 indicates high spatial extent; see Event-related Analysis).
Retinotopic maps and phase–phase plots for six participants (P7–12) elicited during perception and focused attention in the follow-up experiment.
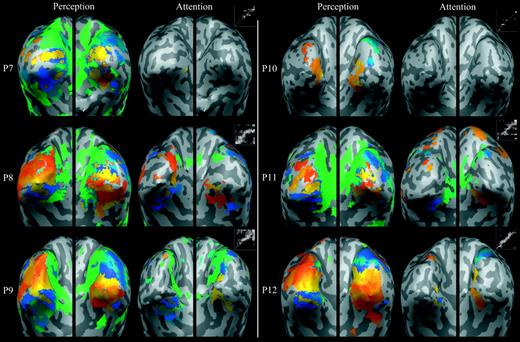
Figure 6 shows the values of these measures for the imagery and attention conditions in the main and follow-up experiments. There was no difference between the phase–phase correspondence between the imagery maps and the attention maps of the main experiment or the attention maps of the follow-up experiment (all t-values < 1), which indicates that these maps had comparable retinotopic organization. In contrast, a greater fraction of voxels were active in the imagery maps than in the attention maps in the main experiment [t(11) = 2.89, P < 0.01] and — crucially — a greater fraction of voxels were active in the imagery maps than in the attention maps in the follow-up experiment [t(22) = 2.01, P < 0.05]. Moreover, the fraction of voxels active in the attention maps for both experiments did not differ [t(22) < 1]. The fact that the imagery condition in the main experiment activated retinotopically mapped areas more strongly than did attention in the follow-up experiment testifies that our imagery effects are not due to focused spatial attention.
Quantitative comparison of imagery retinotopic maps and attention maps from the main experiment and follow-up experiment. For each participant, phase–phase correspondence was computed by plotting imagery or attention map phase as a function of perception map phase (for all significantly active voxels); phase–phase correspondence was defined as the slope of the best-fit line (where 0 represents no correspondence and 1.0 represents perfect correspondence). The fraction of voxels active was computed by dividing the number of active voxels in the imagery or attention maps by the number of active voxels in each participant's corresponding perception map (where 0 represents no activity and 1 represents the same degree of activity). The dashed line separates the phase–phase correspondence panel from the voxels active panel. Asterisks demarcate significant differences.
To allow comparison with studies that average across retinotopic mapping scans (rather than selecting the highest quality maps; see Event-related Analysis), we also computed the mean phase–phase correspondence and mean fraction of voxels active (for all scans). Specifically, each imagery map and attention map was compared to the average perception map and then the phase–phase correspondence values and fraction of voxels active values were averaged for imagery maps of the main experiment, attention maps in the main experiment, and attention maps in the follow-up experiment. The pattern of results was identical to that previously described. There were no significant differences in mean phase–phase correspondence between imagery maps (0.55) and attention maps (0.64 and 0.54 for main and follow-up experiments, respectively; all t-values < 1). Furthermore, the mean fraction of voxels active was significantly greater for imagery maps (0.28) than for the attention maps in the main experiment [0.18; t(11) = 4.99, P < 0.001] and also greater, to a non-significant degree, than for the attention maps in the follow-up experiment [0.24; t(22) <1]. This null finding is not surprising, given that the effect of including the additional data is to add noise to the analysis. In an effort to replicate our finding that more voxels were activated during imagery than during the follow-up attention condition, we considered the data that were least likely to reflect noise per se. Specifically, we performed a median split of the data from both the imagery maps and the follow-up attention maps, with the idea that activation above the median is less likely to reflect noise. In line with our previous results, the upper half fraction of voxels active during the imagery condition (0.41) was significantly greater than the upper half associated with the follow-up attention condition [0.34; t(10) = 2.02, P < 0.05]; as expected, there was no significant difference between the corresponding voxels for the lower half [0.16 and 0.15 for imagery and follow-up attention conditions, respectively; t(10) < 1]. For present purposes, it is enough to show that topographically organized visual cortex was in fact activated more during imagery than during the follow-up attention control for least some of the maps.
Blocked fMRI
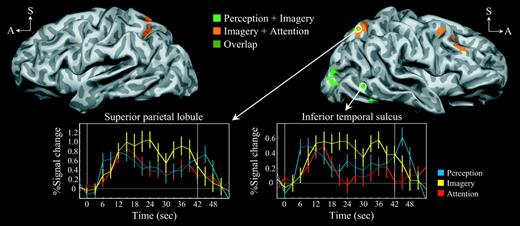
We next analyzed the results from the main experiment using a blocked design. Figure 7 and Table 1 show the cortical regions that had sustained activity during each stimulus cycle in the imagery condition (from stimulus onset at time = 0 s to stimulus offset at time = 42 s). Replicating previous findings (Kosslyn et al., 1997; Ganis et al., 2004), the conjunction of perception and imagery (perception + imagery) was associated with activity in the parietal lobe (BA7), temporal cortex (BA37) including the middle temporal gyrus and inferior temporal sulcus, and extrastriate cortex (BA18, BA19). The sensorimotor cortex activity (BA3) contralateral to the responding hand can be attributed to motor response. The anatomic location of the inferior temporal sulcus activity (at its posterior ascending limb; Fig. 7, upper right) is consistent with the representation of the human motion processing complex MT+ (Watson et al., 1993; Huk et al., 2002), a possibility that is evaluated more fully below.
Neural regions associated with imagery-related cognitive conjunctions. Lateral views of slightly inflated hemispheres (left hemisphere is on the left, A = anterior, S = superior). Activity associated with the conjunction of perception + imagery is shown in bright green, that of imagery + attention is shown in orange, with the overlapping activity in olive (see color key at upper-middle). The time courses of event-related activity were extracted from the superior parietal lobule (BA7) and the inferior temporal sulcus (BA37) (see event color key at lower-right). The vertical white lines demarcate the stimulus cycle onset (at time = 0 s) and offset (at time = 42 s).
Neural regions associated with imagery-related cognitive conjunctions
| Region | BA | x | y | z |
|---|---|---|---|---|
| Perception + imagery | ||||
| Superior parietal lobule (R) | 7 | 21 | 60 | 50 |
| Intraparietal sulcus (R) | 7 | 21 | 66 | 28 |
| Postcentral gyrus (L) | 3 | 42 | 28 | 43 |
| Middle temporal gyrus (R) | 37 | 46 | 65 | 9 |
| Inferior temporal sulcus (R) | 37 | 42 | 61 | 2 |
| Fusiform gyrus (R) | 37 | 37 | 54 | 11 |
| Fusiform gyrus (L) | 19 | 26 | 68 | 8 |
| Lateral occipital gyrus (R) | 19 | 38 | 80 | 5 |
| Lateral occipital gyrus (R) | 18 | 26 | 87 | 2 |
| Imagery + attention | ||||
| Superior parietal lobule (R) | 7 | 18 | 63 | 49 |
| Superior parietal lobule (L) | 7 | 19 | 60 | 48 |
| Intraparietal sulcus (R) | 7 | 32 | 45 | 39 |
| Intraparietal sulcus (L) | 7 | 26 | 55 | 38 |
| Insula (R) | 13 | 31 | 16 | 5 |
| Insula (L) | 13 | 39 | 7 | 3 |
| Cingulate gyrus (R) | 32 | 15 | 20 | 30 |
| Middle frontal gyrus (R) | 10 | 43 | 40 | 10 |
| Middle frontal gyrus (R) | 9 | 44 | 23 | 33 |
| Middle frontal gyrus (R) | 6 | 30 | 7 | 46 |
| Precentral gyrus (L) | 6 | 29 | 12 | 59 |
| Putamen (R) | – | 29 | 6 | 6 |
| Putamen (L) | – | 24 | 5 | 7 |
| Thalamus (R) | – | 13 | 17 | 8 |
| Thalamus (L) | – | 12 | 14 | 10 |
| Superior temporal gyrus (R) | 38 | 32 | 5 | 35 |
Regions, Brodmann areas (BAs) and Talairach coordinates (x, y, z) refer to the center of each contiguous cluster of activity (R = right, L = left).
The conjunction of imagery and attention (imagery + attention) was associated with activity in the parietal lobe (BA7) including the superior parietal lobule and intraparietal sulcus, the prefrontal cortex (BA9, BA10), and the cingulate cortex (BA32), in addition to motor processing regions (BA6 and the putamen), the insula, and the thalamus. Although the parietal and prefrontal regions are most typically considered to be involved in the control of spatial attention, all the regions listed have been associated with spatial attention tasks (Hopfinger et al., 2000, 2001; Corbetta et al., 2000, 2002).
We next compared the results of the two conjunctions, and found overlapping activity in the superior parietal lobule. To better characterize this activity, event-related activity was extracted from the right superior parietal lobule (Fig. 7, lower left; see Materials and Methods). As expected, all event types were associated with sustained superior parietal lobule activity throughout the epoch. Because the perception, imagery and attention tasks all required some degree of sustained attention, these results indicate the superior parietal lobule may serve a more general (task non-specific) role during this cognitive process.
However, in spite of the observed common activation, we found a striking difference in the patterns of activity associated with the two conjunctions: only the perception + imagery conjunction was associated with visual sensory activation in extrastriate cortex (BA18, BA19), in addition to activation of the inferior temporal sulcus (purported MT+). We also extracted event-related time courses from the inferior temporal sulcus region (Fig. 7, lower right). The event-related activity associated with perception and imagery was sustained throughout the epoch, whereas the activity associated with attention was not sustained (as illustrated by the attention time course error bars repeatedly overlapping 0% signal change after a transient increase). These results further suggest that there is greater sensory activity associated with imagery than with attention in this region.
The activity associated with the direct contrast between perception and imagery (perception > imagery) revealed a single locus of extrastriate activity within the lateral occipital gyrus (BA18; Talairach coordinates x = 29, y = −85, z = 4). This perception-specific activity probably reflects the perceptual processing differences between the stimulus wedge and the stimulus arc. Ganis et al. (2004) also found evidence for perception-specific regions of activation in early visual areas when very similar perception and imagery tasks were compared. The contrast between imagery and perception (imagery > perception) revealed a single locus of activity within the inferior temporal sulcus (BA37; Talairach coordinates x = 43, y = −60, z = −1), which is also consistent with the anatomic location of MT+. The contrast between imagery and attention and the reverse contrast revealed no significant activity.
The results of the imagery versus perception contrast indicate that imagery produces more activation in the right inferior temporal sulcus than does perception, and the two conjunction analyses (and event-related time courses) indicate that imagery and perception produce more activation in this region than does attention. If this region could be identified as MT+, such imagery-related activity could be taken to reflect the fact that the checkerboard wedges were flickering or moving/rotating. To investigate this possibility, we conducted a meta-analysis of eight studies to determine the typical Talairach coordinates of MT+ in the left and right hemispheres (Watson et al., 1993; Sunaert et al., 1999, 2000; Rees et al., 2000; Kourtzi et al., 2002; Muckli et al., 2002; Beauchamp et al., 2002; Liu et al., 2003). The range in the left hemisphere was remarkably narrow, with the following coordinates: x = −42 to −48, y = −64 to −70, z = −2 to 2 (mean x = −45, y = −67, z = 1). Similarly, the range in the right hemisphere was also remarkably well defined, with coordinates of: x = 40 to 50, y = −60 to −73, z = −1 to 6 (mean x = 45, y = −66, z = 1). The coordinates of the activity we found in the inferior temporal sulcus in the perception and imagery conjunction (x = 42, y = −61, z = −2) and the imagery greater than perception contrast (see above) both fall within the range of the region previously described as area MT+. This provides additional evidence that the inferior temporal sulcus activity we observed during imagery reflects the activation of area MT+.
To provide another test of this interpretation of our results, we compared the event-related time courses from our inferior temporal sulcus region with the event-related time courses extracted from MT+ regions-of-interest, as specified by the mean Talairach coordinates of the meta-analysis. The same pattern of event-related activity time courses was observed in all three regions. The mean magnitude of event-related activity from our inferior temporal sulcus region (from 6 s after stimulus onset, allowing the hemodynamic response to reach its maximum, to stimulus offset at 42 s) was greatest for the imagery condition (0.45), followed by the perception condition (0.30), which in turn was greater than the attention condition (0.18). Consistent with the conjunction analysis results (which showed sustained activity in both perception and imagery, but not attention), imagery engendered a comparable amount of activation as perception [t(5) = 1.45, P > 0.10], and engendered more activation than did attention [t(5) = 2.4, P < 0.05]. The right- and left-hemisphere MT+ regions-of-interest showed the same pattern of activity, with the greatest magnitude of activity for the imagery condition (0.63 and 0.70, respectively), followed by the perception condition (0.44 and 0.59, respectively) and then the attention condition (0.35 and 0.44, respectively). As in our inferior temporal sulcus region, imagery and perception engendered comparable amounts of activity [t(5) = 1.20, P > 0.10 and t(5) < 1, respectively], and imagery tended to engender more activity than did attention [t(5) = 1.62, P = 0.084 and t(5) = 1.63, P = 0.083, respectively]. Although these last increases in activity during imagery, compared to attention, were only marginally significant, the joint probability of observing two such effects was significant at P < 0.05 (calculated using the Fisher technique; Slotnick and Schacter, 2004). It is also noteworthy that if MT+ activity associated with imagery were greater than that associated with perception (as these results would suggest), this would indicate that more processing was required to represent motion or flicker during imagery. However, this interpretation must be considered speculative, given that these effects were not significant (P-values > 0.10).
These results provide convergent anatomic and functional evidence that our inferior temporal sulcus region corresponds to human motion processing area MT+. Furthermore, they provide complementary evidence to the retinotopic mapping results, demonstrating that imagery is associated not only with activity in retinotopically organized early visual areas but also with sensory reactivation of flicker- or motion-related activity in MT+ (in the inferior temporal sulcus).
Discussion
By directly contrasting the imagery retinotopic maps and the attention retinotopic maps, we have shown that visual mental imagery can evoke topographically organized activity in striate and extrastriate cortex (Fig. 4). These results replicate previous reports that visual imagery can induce activation in both striate and extrastriate cortex (Kosslyn et al., 1993, 1995, 1997, 1999; Le Bihan et al., 1993; Mellet et al., 1996). Such findings are consistent with a meta-analysis conducted by Kosslyn and Thompson (2003) of neuroimaging studies of visual mental imagery; they found that two task variables, in addition to use of a sensitive technique, predicted whether early visual areas are activated during visual mental imagery: (i) the imagery task must require interpreting shapes with high resolution, classifying details subtending 1° of visual angle or less; and (ii) the task must not rely on processing spatial relations. The small checks in our stimulus clearly required high-resolution imagery of shape; hence, it is not surprising that we observed activation in striate and extrastriate cortex during imagery. As in perception, we assume that such imagery-related activity in striate and extrastriate cortex (in addition to MT+) gives rise (directly or indirectly) to the subjective experience of a flickering and rotating checkerboard wedge.
When comparing the imagery condition with the baseline attention condition(s), we have assumed that processing during the imagery condition is composed of imagery-specific processes and more general attention processes. Thus, by comparing activation in the two conditions, we aimed to isolate the effects of imagery, using the logic of cognitive subtraction [(imagery + attention) − attention]. However, this logic rests on the assumption that imagery and attention do not interact; specifically, we assumed that attention was engaged to the same extent during the imagery condition and the attention conditions. In support of this assumption, Ishai et al. (2002) found that the amount of activation in striate and extrastriate cortex during imagery was independent of attention. Moreover, Craver-Lemley and Reeves (1992) have provided compelling evidence that there is no interaction between imagery and attention at peripheral target locations (as used in the present study). Furthermore, the fact that our two attention control conditions (in different experiments) produced the identical pattern of results in striate and extrastriate cortex suggests that there were not substantive between-condition attention-related differences within these regions. Thus, the previous and present results indicate that our use of cognitive subtraction was warranted, and we have documented effects of imagery per se by showing greater activation of retinotopic striate and extrastriate cortex during imagery than during attention.
How should we interpret the fact that imagery only activated striate cortex in half of our participants? First, we note that individual differences in imagery ability permeate the literature and are the norm in neuroimaging studies of imagery (see e.g. Kosslyn and Thompson, 2003). For example, in a study that is similar to the present one in spirit, although using a very different method, Klein et al. (2004) also found substantial individual differences. Nevertheless, when they asked participants to visualize a checkered bow-tie stimulus either vertically or horizontally, they found selective activation along the vertical and horizontal meridians of area V1 for most participants. Although Klein et al.'s method did not allow detailed retinotopic mapping, their results converge nicely with what we found in the present study. Why do such individual differences occur? Although we cannot rule out Type II statistical error, at least some of these individual differences in striate cortex activity are related to the efficacy of the underlying information processes. For example, Kosslyn et al. (1996) found that participants who had the least regional cerebral blood flow in BA17 also performed slowest on the imagery task, and Kosslyn et al. (2004) showed that such differences were specific to the type of imagery being used. Second, to address the issue of whether depictive representations can be used in human cognition, all we needed was a single participant who showed reliable retintopically organized activation in early visual areas. As William James famously pointed out, all one needs is a single white crow to rule out the claim that all crows are black. The present findings provide strong evidence that humans can in fact use depictive representations during visual mental imagery.
The fact that the phase of the activity (representing stimulus position) in the imagery retinotopic maps was similar to that in the perception retinotopic maps — which in both cases directly reflected geometric properties of the stimulus — is in accord with Pylyshyn's criterion for evidence of depictive representation: ‘that the way their topographical organization is involved reflects the spatial properties of the image’ (Pylyshyn, 2002). In addition, our findings from both the main experiment and follow-up experiment counter Pylyshyn's claim that visual mental imagery is accomplished primarily through attentional mechanisms. Moreover, the blocked results in the inferior temporal sulcus implicate motion processing region MT+ during imagery to a greater degree than attention (specifically, as indicated by the similarity of imagery and perception but not imagery and attention in the conjunction analysis and the significantly greater time course activity associated with imagery as compared to attention). This latter result suggests that participants were able to reproduce the flickering characteristic of the stimulus wedge in their imagery or were able to visualize the rotation motion of the stimulus. Taken together, these results indicate that participants can reproduce (at least to some degree) both the spatial specificity of the rotating stimulus wedge and its flicker and rotation during visual imagery.
It has been argued (Pylyshyn, 2002) that activation of early visual areas during visual mental imagery is epiphenomenal (i.e. it plays no functional role in information processing). However, when repetitive transcranial magnetic stimulation (rTMS), which can temporarily impair local cortical processing, was applied to occipital cortex in a previous study, it impaired performance on a visual imagery task (Kosslyn et al., 1999). These results show that the activity in occipital cortex is not epiphenomenal during visual mental imagery, but rather that its activation has real functional consequences. Given these results in combination with those reported in this article, the notion that visual imagery-induced activity in striate and extrastriate cortex in turn can result in the perception of an imagined stimulus is not surprising (nor is the fact that disruption of this activity has behavioral consequences). Indeed, such findings are consistent with the now-classic finding that electrical stimulation of neurons in the motion processing MT can affect the direction of perceived motion (Salzman et al., 1992). The sum total of the extant results, particularly when bolstered by the evidence we report here, provide compelling support for the claim that depictive representations are used in visual imagery.
We would like to thank Lauren Moo for her insightful comments on the manuscript. This research was supported in part by NIH grant 5 R01 MH60734-03, NSF ROLE Grant REC-0106760 and NIMA grant NMA201-01-C-0032.
References
Aguirre GK, Zarahn E, D'Esposito M (
Beauchamp MS, Lee KE, Haxby JV, Martin A (
Brefczynski JA, DeYoe EA (
Corbetta M, Kincade JM, Ollinger JM, McAvoy MP, Shulman GL (
Corbetta M, Kincade JM, Shulman GL (
DeYoe EA, Carman GJ, Bandettini P, Glickman S, Wieser J, Cox R, Miller D, Neitz J (
Engel SA, Glover GH, Wandell BA (
Friston K.J, Holmes AP, Price CJ, Buchel C, Worsley KJ (
Ganis G, Thompson WL, Kosslyn S M (
Holmes G, Lister WT (
Hopfinger JB, Buonocore MH, Mangun GR (
Hopfinger JB, Woldorff MG, Fletcher EM, Mangun GR (
Horton JC, Hoyt WF (
Huk AC, Dougherty RF, Heeger DJ (
Inouye T (
Ishai A, Haxby JV, Ungerleider LG (
Klein I, Dubois J, Mangin J-F, Kherif F, Flandin G, Poline J-B, Denis M, Kosslyn SM, Le Bihan D (
Kosslyn SM, Thompson WL (
Kosslyn SM, Alpert NM, Thompson WL, Maljkovic V, Weise SB, Chabris CF, Hamilton SE, Rausch SL, Buonanno FS (
Kosslyn SM, Thompson WL, Kim IJ, Alpert NM (
Kosslyn SM, Thompson WL, Kim IJ, Rauch SL, Alpert NM (
Kosslyn SM, Thompson WL, Alpert NM (
Kosslyn SM, Pascual-Leone A, Felician O, Camposano S, Keenan JP, Thompson WL, Ganis G, Sukel KE, Alpert NM (
Kosslyn SM, Thompson WL, Shephard JM, Ganis G, Bell D, Danovitch J, Wittenberg LA, Alpert NM (
Kourtzi Z, Bülthoff HH, Erb M, Grodd W (
Le Bihan D, Turner R, Zeffiro TA, Cuénod CA, Jezzard P, Bonnerot V (
Liu T, Slotnick SD, Serences JT, Yantis S (
Mellet E, Tzourio N, Crivello F, Joliot M, Denis M, Mazoyer B (
Muckli L, Kriegeskorte N, Lanfermann H, Zanella FE, Singer W, Goebel R (
Pylyshyn ZW (
Rees G, Friston K, Koch C (
Salzman CD, Murasugi CM, Britten KH, Newsome WT (
Sereno MI, Dale AM, Reppas JB, Kwong KK, Belliveau JW, Brady TJ, Rosen BR, Tootell RBH (
Slotnick SD (
Slotnick SD, Moo LR (
Slotnick SD, Schacter DL (
Slotnick SD, Yantis S (
Slotnick SD, Klein SA, Carney T, Sutter EE (
Slotnick SD, Moo LR, Krauss G, Hart J (
Slotnick SD, Schwarzbach J, Yantis S (
Sunaert S, Van Hecke P, Marchal G, Orban GA (
Sunaert S, Van Hecke P, Marchal G, Orban GA (
Tootell RBH, Hadjikhani NK, Mendola JD, Marrett S, Dale AM (
Author notes
1Department of Psychology, Boston College, McGuinn Hall, Chestnut Hill, MA 02467, USA and 2Department of Psychology, Harvard University, Cambridge, MA 02138, USA