Binocular interactions underlying the classic optomotor responses of flying flies
- Department of Physiological Science, Howard Hughes Medical Institute, University of California Los Angeles, Los Angeles, CA, USA
In response to imposed course deviations, the optomotor reactions of animals reduce motion blur and facilitate the maintenance of stable body posture. In flies, many anatomical and electrophysiological studies suggest that disparate motion cues stimulating the left and right eyes are not processed in isolation but rather are integrated in the brain to produce a cohesive panoramic percept. To investigate the strength of such inter-ocular interactions and their role in compensatory sensory–motor transformations, we utilize a virtual reality flight simulator to record wing and head optomotor reactions by tethered flying flies in response to imposed binocular rotation and monocular front-to-back and back-to-front motion. Within a narrow range of stimulus parameters that generates large contrast insensitive optomotor responses to binocular rotation, we find that responses to monocular front-to-back motion are larger than those to panoramic rotation, but are contrast sensitive. Conversely, responses to monocular back-to-front motion are slower than those to rotation and peak at the lowest tested contrast. Together our results suggest that optomotor responses to binocular rotation result from the influence of non-additive contralateral inhibitory as well as excitatory circuit interactions that serve to confer contrast insensitivity to flight behaviors influenced by rotatory optic flow.
Introduction
For seeing organisms, visual–motor behaviors rely on the neural decomposition of visual motion generated by self-motion. From humans to flies, distinguishing patterns of optic flow is essential to actively control body posture and stabilize gaze (Paulus et al., 1984; Schilstra and van Hateren, 1998; Lappe et al., 1999; Frye and Dickinson, 2001). Particularly, flying flies, like birds, are subjected to three dimensional chaotic perturbations imposed by the fluid medium in which they travel in addition to noise generated from within the flight control system. Furthermore, and also like birds, behaviorally induced motion cues stimulate disparate regions of the two eyes with comparatively little binocular overlap (Martin, 2009; Schnell et al., 2010). As such, fly brains must constantly and simultaneously integrate disparate motion cues from the two eyes and trigger appropriate compensatory and stabilizing rotations and translations (Zanker and Zeil, 2001; Theobald et al., 2010).
Flying flies travel along relatively straight trajectories, interspersed with rapid changes in direction called body “saccades” for their functional analogy to gaze stabilizations in vertebrates. To maintain stable trajectories between saccades, flies rely in large part upon lobula plate tangential cells (LPTCs) residing in the third optic ganglion (Heisenberg et al., 1978). The receptive fields of many of these cells function as “matched filters” for specific patterns of optic flow and presumably trigger appropriate optomotor flight maneuvers (Krapp, 1999; Egelhaaf et al., 2002). For example, within each of the right and left lobula plates, the three LPTCs of the Horizontal system (HS) respond to ipsilateral monocular motion generated by forward movement and horizontal rotation around the vertical, or yaw axis (Hausen, 1976). In fruit flies, these cells are excited and inhibited primarily by horizontal front-to-back (FTB) and back-to-front (BTF) motion, respectively, (Schnell et al., 2010) and in larger flies receive additional inputs from cells that respond to motion within the contralateral visual field (Hausen, 1981; Strausfeld et al., 1995; Krapp et al., 2001). With directional selectivity opposite that of HS, heterolateral H1 and H2 cells are excited by monocular horizontal BTF motion, inhibited by horizontal FTB motion, and when activated, excite HS cells in the contralateral lobula plate (Horstmann et al., 2000; Farrow et al., 2006). Owing to these heterolateral interactions embedded within a recurrent network, LPTC responses to binocular motion are as large or larger than the sum of the responses elicited by the individual monocular components alone (Egelhaaf et al., 1993; Gauck and Borst, 1999; Horstmann et al., 2000; Haag and Borst, 2001; Farrow et al., 2006). In free flight, the binocular encoding of visual rotation is thought to contribute to optomotor equilibrium at low forward velocities, during which BTF sensitive cells are not inhibited by FTB motion, in addition to playing a role in the suppression of saccades in response to motion during such turns (van Hateren et al., 2005). To examine how differing information from both eyes is integrated to encode pure, uncorrupted visual rotation, many efforts have utilized controlled tethered preparations to measure how steering behavior might be mediated by LPTC connectivity.
In response to panoramic visual rotation and to minimize motion across the retina, tethered flying flies actively steer in the direction of motion by asymmetrically modulating the amplitude of their left and right wings, a behavior in flies known as the “classic” optomotor response (Götz, 1968; Blondeau and Heisenberg, 1982; Mronz and Lehmann, 2008). In mutant flies with no LPTCs, optomotor responses are largely absent highlighting a significant dependence of these circuits for compensatory steering (Heisenberg et al., 1978). Pioneering attempts to determine the monocular contributions underlying optomotor responses to binocular rotation, that is, BTF motion on one eye and FTB motion on the other, revealed that both eyes of a flying fly are functionally equal and each mediates robust turning responses to either monocular motion component presented alone (Götz, 1968). Subsequent studies either support this result (Geiger and Poggio, 1975; Tammero et al., 2004; Rister et al., 2007) or demonstrate that responses to BTF motion are of much lower magnitudes than those to FTB motion (Heisenberg, 1972; Götz et al., 1979; Wehrhahn and Hausen, 1980; Geiger and Nässel, 1982; Hausen and Wehrhahn, 1990). Additional studies also indicate that for walking flies, responses to FTB and BTF motion are differently tuned to contrast frequency (Götz, 1975). Are lateral FTB and BTF motion equivalent in their capacity to elicit steering responses over a range of stimulus strengths? Further, are optomotor responses to binocular rotation, a stimulus known to activate specific networks of LPTCs (Egelhaaf et al., 1993; Haag and Borst, 2001), equal to the sum of responses to each monocular component presented alone? To examine these questions, we use an electronic virtual reality flight simulator capable of presenting visual stimuli in subsets of a fly’s visual field with the assumption that measurable flight behaviors will reflect the computational properties of well-studied LPTC circuits and thus enable informed speculation on the function of identified binocular neurons and their relevance in flight optomotor responses.
Materials and Methods
Animals, Preparation, and Flight Arena
We reared a Drosophila melanogaster colony on standard medium under a 12:12-h light:dark cycle. Female adult flies, 3–5 days post pupal eclosion, were selected for use in this study. Animals were cold-anesthetized and tethered at the thorax to a 0.1-mm diameter tungsten rod with UV-activated glue (Kemxert Corp., York, PA, USA). For part of the experiments in Figures 3 and 4, heads were immobilized using the same UV glue to fix the top of the head backward to the thorax and level, with respect to roll, to the horizon. After at least 1 h of recovery, individual animals were placed within a custom-built computer-controlled electronic flight simulator (Reiser and Dickinson, 2008) composed of a cylindrical array of green (λmax = 560 nm) light emitting diodes (LEDs) spanning 330° in azimuth and ±60° in elevation as seen by the animal (Figure 1A). Each individual LED pixel, with a maximum luminance of 72 cd m−2, subtended 3.75° on the retina and apparent motion was generated by stepping patterns of vertical stripes horizontally in 1-pixel increments across the LED display. The visual display refreshed at a rate of at least 372 Hz and a 30° gap in the LED array directly behind the fly was necessary to accommodate the fixed tether.
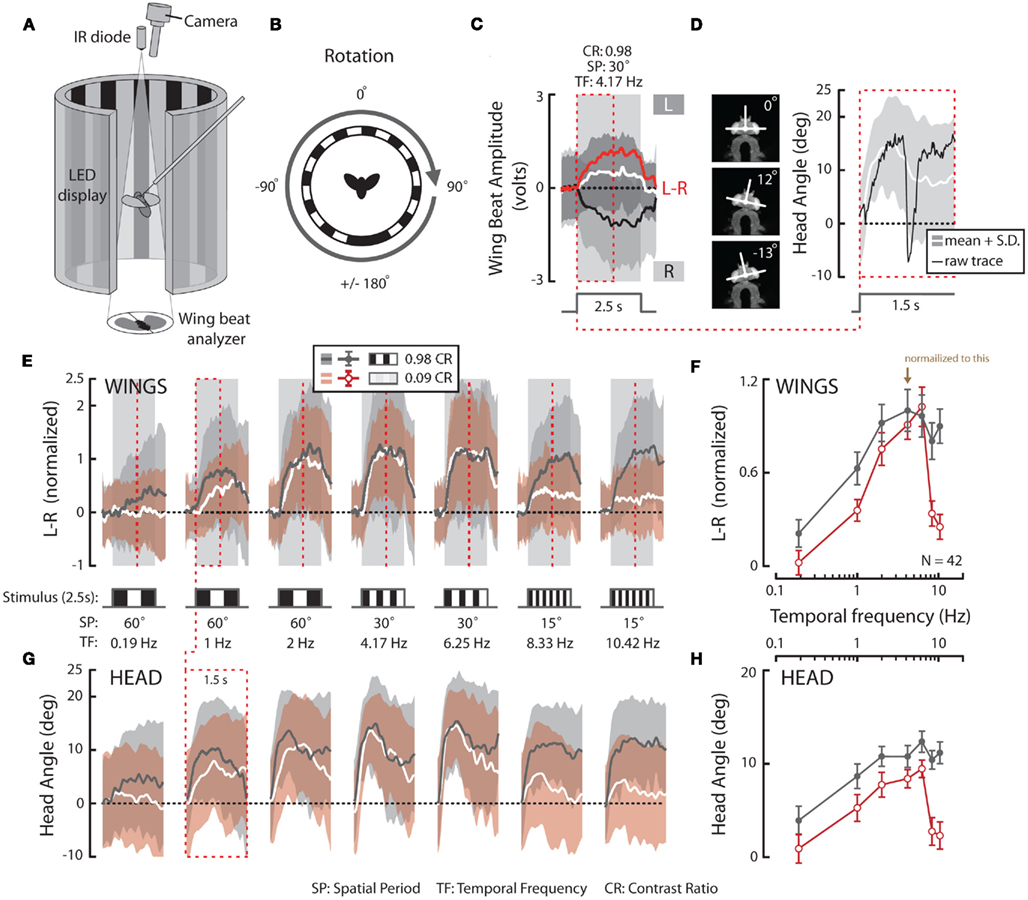
Figure 1. Experimental set-up and temporal frequency tuning of wing and head optomotor responses to full-field horizontal rotation. (A) A flying fly is rigidly fixed to a steel pin and placed in the center of a cylinder of LEDs that display computer-controlled visual stimuli. An infrared (IR) diode above the fly casts a shadow of the beating wings onto a sensor below to record asymmetrical changes in wing beat amplitude, or attempted turns by the fly. In response to imposed, rightward, visual rotation (B) flies decrease the amplitude of their right wing [(C) R, black; light gray envelope = SD] and increase the amplitude of their left wing (L, white; dark gray envelope). The difference between R and L WBA (L–R, red) over the 2.5-s rotation stimulus thus represents the total wing turning response. SP, spatial period; TF, temporal frequency; CR, contrast ratio (see Materials and Methods). An IR camera above the fly (A) records the yaw position of the head [(D), left]. Flies turn their head in the direction of motion during the stimulus presentation, as seen for the first 1.5 s [red dotted boxes in (C,D)]. (E) Average L–R ± SD in response to rotation over a range of temporal frequencies (TF, bottom) and two extreme CRs (0.98 = dark gray; gray envelope; 0.09 = white; red envelope). Stimulus timing is indicated with boxes filled with a cartoon indication of the relative spatial period. (F) Mean of individual averages over the whole stimulus duration ±SE of the mean (SEM) following the color scheme indicated in E (inset). (G) Average simultaneous head responses ±SD during the first 1.5 s of the stimuli presented in E (see red dotted boxes and lines in E and G for comparison) and (H) mean of individual averages ±SEM over the recorded duration following the color scheme indicated in (E,F). All data in this figure is normalized to the high contrast value indicated by the brown arrow in (F).
In response to a rotating striped panorama (Figure 1B), the changes in wing beat amplitude (WBA; Figure 1C) were encoded by an optical wingbeat analyzer where an infrared (IR) LED projecting downward above the fly casts a shadow of the beating wings onto a photodiode pair beneath the fly (Figure 1A). The two optical signals were conditioned with an optical mask such that sensor output represents time-varying wing position. Associated electronics then processed the analog position signal to extract total WBA for the left and right wings. The difference in amplitude between the left and right wings (L–R) is directly proportional to yaw torque (Götz, 1987; Tammero et al., 2004; Figure 1C, red). An IR-sensitive digital camera (Basler Vision Components A601f, Ahrensburg, Germany) with a 94-mm zoom lens (Edmund Optics, Barrington, NJ, USA) and additional 850 nm IR LEDs for illumination were positioned above the fly such that yaw motions of the fly’s head could be recorded (Figures 1A,D). The data from the wing beat analyzer and the camera were digitized at 500 Hz (Axon Instruments DigiData 1320, Sunnyvale, CA, USA), stored on a PC workstation and, in the case of wing amplitude signals, relayed back to the LED arena to control the display under closed-loop conditions.
Visual Motion Stimuli, Acquisition, and Data Analysis
To test optomotor responses under various conditions we presented a stimulus regime composed of up to 24 pseudo-randomized 2.5 s periods of open-loop visual stimuli interspersed with 5 s periods during which the fly had active closed-loop control of a 30° vertical stripe. This regime ensured that flies were actively engaged in optomotor behavior when the open-loop test patterns were presented. Each experiment began with 20 s of closed-loop stripe fixation to ensure correct alignment over the photodiode, and flies which could not fixate the stripe during this period (∼10%) were not included in the test sample. Unless otherwise noted, each experiment was presented to each fly once. All display patterns and experimental algorithms were generated and controlled using custom software routines written in MATLAB (Natick, MA, USA).
The “classic” optomotor stimulus consists of a striped “drum,” or panoramic vertically striped square-wave grating, rotating horizontally around the vertical, or yaw axis (Figure 1B). Due to an upper limit on the pattern velocities we could achieve with our apparatus without dropping individual frames, we varied spatial period (SP) and pattern velocity (V) to generate a continuous range of temporal frequencies (TFs). We presented seven TFs from 0.19 to 10.42 Hz and the SP, V, and resultant TFs were as follows: (1) SP = 60°; V = 11.4° s−1; TF = 0.19 Hz; (2) SP = 60°; V = 60° s−1; TF = 1 Hz; (3) SP = 60°; V = 120° s−1; TF = 2 Hz; (4) SP = 30°; V = 125° s−1; TF = 4.17 Hz; (5) SP = 30°; V = 187.5° s−1; TF = 6.25 Hz; (6) SP = 15°; V = 124.95° s−1; TF = 8.33 Hz; (7) SP = 15°; V = 156.3° s−1; TF = 10.42 Hz. All patterns contained a 50:50 light:dark duty cycle. Though the low TF stimuli contain quite visible higher frequency steps, our previous studies demonstrate that optomotor responses to such stimuli reflect TF dependent responses rather than responses to high frequency jitter (Duistermars et al., 2007b). The contrasts used were estimated as the difference between the light:dark, or “on” and “off” LED intensity values (Imax, Imin, respectively) divided by the sum of “on” and “off” values [(Imax − Imin)/(Imax + Imin)] and each of the seven TFs were presented at contrast ratios (CRs) of 0.98 and 0.09 (Figure 1E, inset). The data in Figures 1E–H was obtained from repeated experiments containing 14 test stimuli rotating to the right lasting approximately 2 min each.
We also presented monocular front-to-back (FTB) and back-to-front (BTF) motion and classic counter-phase flicker stimuli (Figures 3F and 4A,F), in addition to binocular, or “full-field” rotation (Figure 3A). Previous experiments on flying flies have used FTB and BTF visual stimuli restricted to the anterior visual field (±0° to ±40° or ±15° to ±60° in azimuth; Hausen and Wehrhahn, 1990; Rister et al., 2007), anterior–lateral visual field (Götz, 1968; Götz et al., 1979), 45° or 90° azimuthal subsets of the anterior, lateral, or posterior visual field (Geiger and Poggio, 1975; Wehrhahn and Hausen, 1980; Tammero et al., 2004), and monocular stimuli covering most of the anterior–posterior visual field (±30° to ±180°; Heisenberg, 1972). Drosophila HS LPTCs have receptive fields maximally sensitive to motion restricted ±90° in the frontal visual field (Schnell et al., 2010) and heterolateral H1 cells in other flies have receptive fields spanning almost the entire ipsilateral visual field (Krapp and Hengstenberg, 1997; Krapp et al., 2001). Further, optomotor responses in Drosophila are profoundly influenced by varying the characteristics of motion in the rear visual field (Tammero et al., 2004; Chow and Frye, 2008). Therefore, to provide the largest possible stimuli relevant to that which might be experienced by a freely flying fly and without losing potentially key rear-field components of the response or stimulating regions of binocular overlap (Schnell et al., 2010), we presented monocular visual stimuli, similar to (Heisenberg, 1972), subtending 150° from ±15° to ±165° to the right or left field of view.
The inactive side of the arena (opposite the test stimulus) remained on with no pattern (i.e., all LEDs were continuously illuminated). Responses were nearly identical if the inactive side is instead switched off, however, results are significantly different if the inactive side projects a static grating (data not shown). The static grating likely generates subtle motion cues as the tethered thorax deforms with every wing beat, thus moving the head and the eyes along with it (observed with high speed video not shown). Visual stimuli in these monocular experiments were presented at a motion TF or static flicker frequency of 3.75 Hz (SP = 30°; V = 112.5° s−1) over six CRs ranging from 0.98 to 0.09 (Figure 3B, bottom). The data in Figures 3 and 4 were obtained from repeated experimental trials each containing 24 test stimuli and, due to the 5-s epochs of closed-loop stripe fixation separating each test stimulus, a single trial lasted approximately 3 min and 15 s: (1) six full-field rotation stimuli to the right; (2) six FTB motion stimuli on the right; (3) six BTF motion stimuli on the left; (4) six flicker, or no motion, stimuli on the left. The results were not significantly different if motion stimuli moved to the left (data not shown).
The raw WBA signals were low-pass filtered at 200 Hz with a fifth order zero-phase digital Butterworth filter (MATLAB). We calculated response magnitude as the mean L–R WBA for the whole 2.5 s stimulus duration (roughly 500 wing beats) and overall, the reported trends were similar if we used maximum L–R instead of an average over the response plateau (data not shown). Note that neither method accounts for the variable time course of optomotor responses, a factor best appreciated by observing the plots of mean responses (Figures 1, 3, and 4; Duistermars et al., 2007a). In order to eliminate arbitrary units of voltage from L–R data, values from each trial were normalized to the largest value within each animal preparation. Data from Figure 1 was normalized to the high contrast condition indicated in Figure 1F (brown arrow) and both the “head-free” and “head-fixed” graphs in Figures 3 and 4 were normalized to the “head-free” FTB condition indicated in Figure 3H (brown arrow). Video of the head was acquired at 100 frames per second. Owing to the prolonged time required to write each file to disk between successive experimental trials, we only acquired video for the first 1.5 s of the stimulus period. Head angle was calculated programmatically offline. Response delays in Figures 2 and 5 were calculated directly from the mean L–R and head angle responses for each condition as the time, considering the entire recorded stimulus duration (2.5 s for L–R and 1.5 s for head angle), to reach 1 SD above baseline of L–R and head angle during the prior periods of closed-loop stripe fixation.
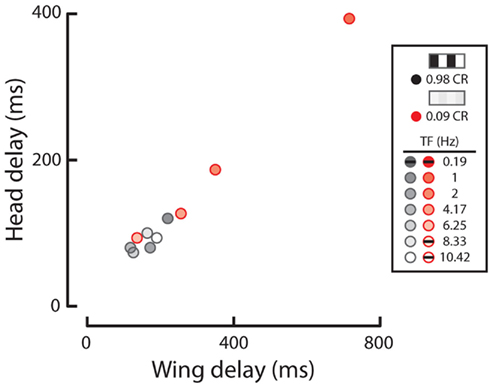
Figure 2. Wing and head response delays from data in Figures 1E,G. Response delay, calculated as the time for a given response to rise 1 SD above baseline (as calculated from initial periods of closed-loop stripe fixation). Response delays to high (gray) and low (red) contrast patterns are displayed for all temporal frequencies (see shading as indicated in legend). Responses where either head or wing steering did not rise above the set threshold are not plotted but are identified with black dashes in the legend.
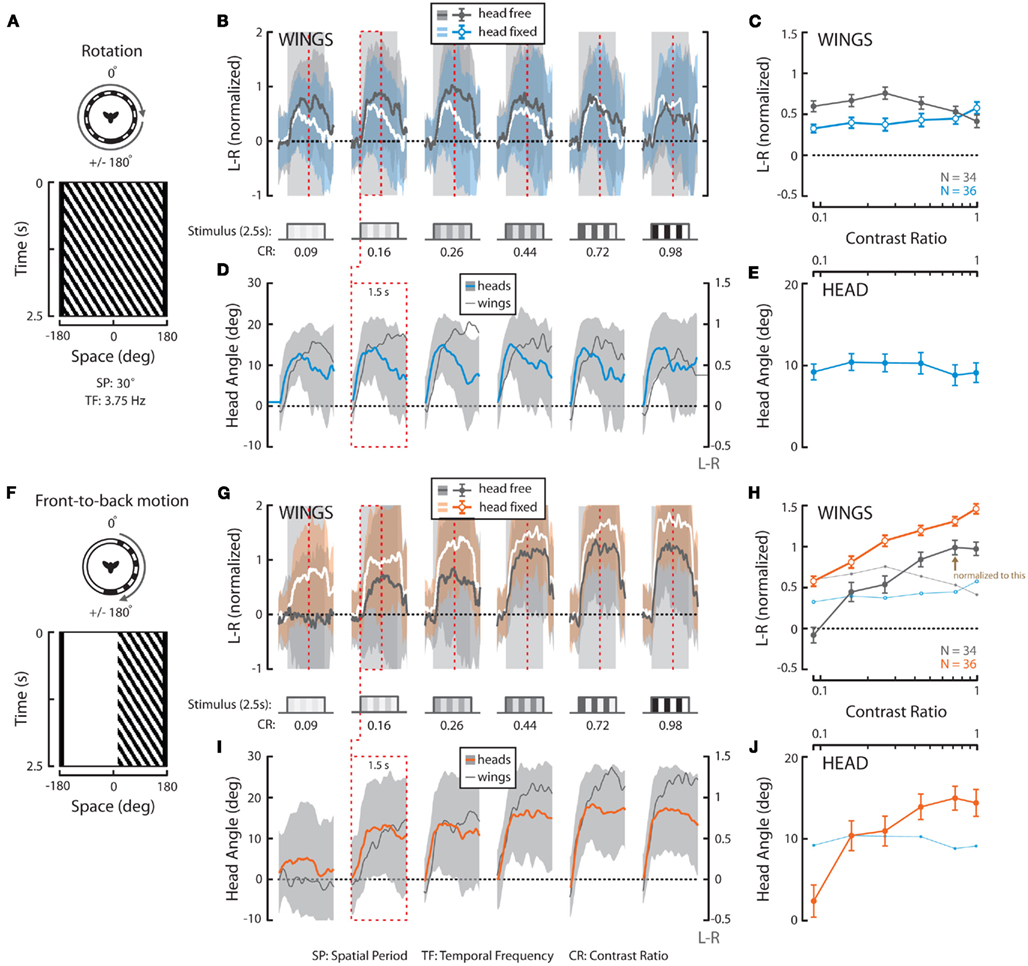
Figure 3. Wing and head responses to full-field horizontal rotation and half-field front-to-back (FTB) motion at a temporal frequency of 3.75 Hz over a range of contrasts. (A,F) Top view and space–time plot of the rotation and FTB stimuli where space represents the horizontal position of a single vertical row of the visual pattern as it varies in time. SP, spatial period; TF, temporal frequency. (B,G) Average L–R ± SD of flies in response to 2.5 s of rotation (“head-free” = gray; gray and “head-fixed” = white; blue) and FTB motion (“head-free” = gray; gray and “head-fixed” = white; orange). Stimulus duration (striped cartoons, timing indicated with gray outlines) and contrast ratios [(B,G), CR, bottom] are as depicted. (C,H) Mean of individual L–R averages over the entire stimulus duration ±SEM [color as indicated in (B,G), inset]. (D,I) Average head angle ±SD (rotation = blue; gray; FTB motion = orange; gray) over the first 1.5 s of the stimulus (red dotted boxes and vertical lines) plotted next to corresponding average L–R from (B,G) (dark gray and right y-axis). (E,J) Mean of individual head angle averages over the entire recorded duration ±SEM. The responses to rotation in (C,E) are underlain in (H,J) for visual comparison. N = 34 (“head-free”) and 36 (“head-fixed”) for all stimuli. All data in this figure is normalized to the value indicated by the brown arrow in (H).
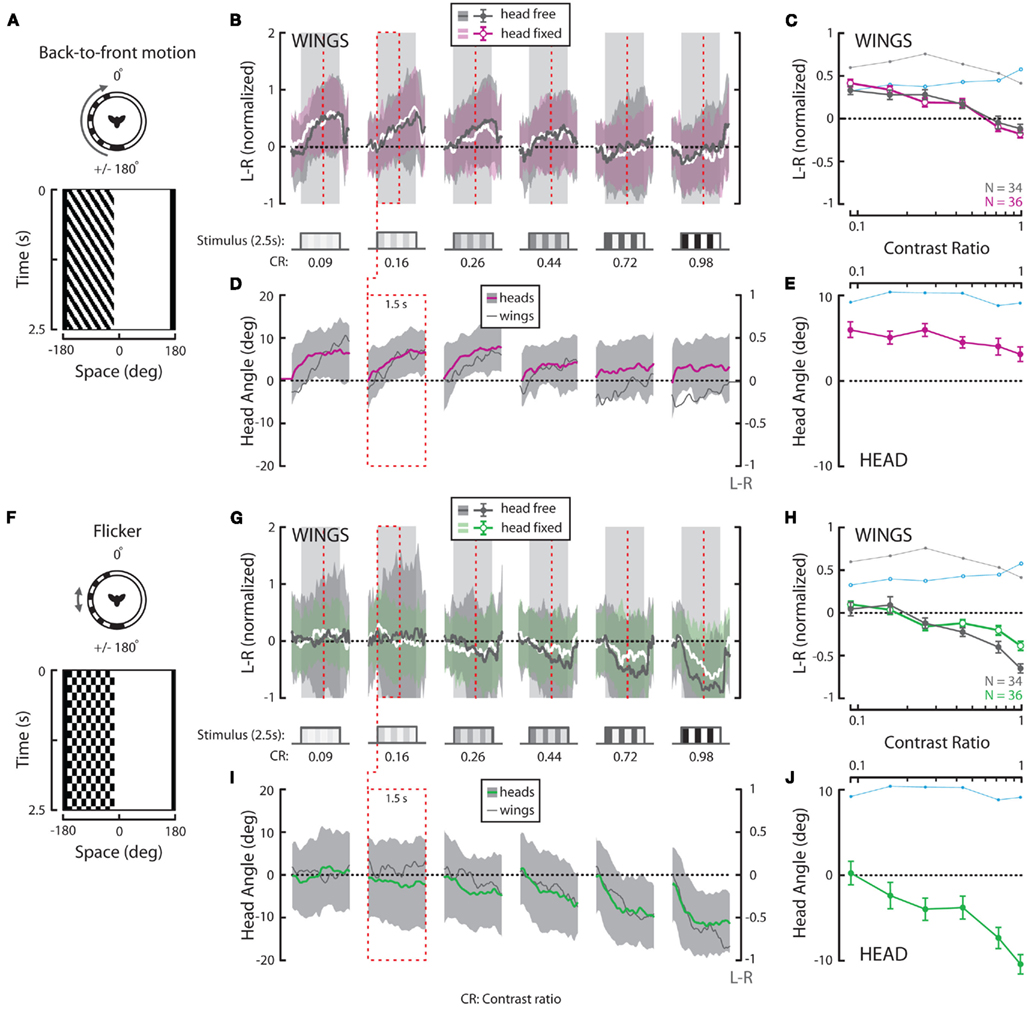
Figure 4. Wing and head responses to half-field back-to-front (BTF) motion and half-field flicker. (A,F) Flicker frequency and temporal frequency matched at 3.75 Hz over a range of contrasts. Top view and space–time plot of the BTF and flickering stimuli where space represents the horizontal position of a vertical striped pattern that varies in time. (B,G) Average L–R ± SD of flies in response to 2.5 s of horizontal BTF motion (“head-free” = gray; gray and “head-fixed” = white; magenta) and flicker (“head-free” = gray; gray and “head-fixed” = white; green). Stimulus duration (steps and gray boxes) and contrast ratios [(B,G), CR, bottom] are as indicated. (C,H) Mean of individual L–R averages over the entire stimulus duration ±SEM [color as indicated in (B,G), inset]. (D,I) Average head angle ±SD (BTF motion = magenta; gray; flicker = green; gray) over the first 1.5 s of the stimulus (red dotted boxes and vertical lines) plotted next to corresponding average L–R from (B,G) (dark gray and right y-axis). (E,J) Mean of individual head angle averages over the entire recorded duration ±SEM. The responses to rotation in Figures 3C,E are underlain in (C,E,H,J) for visual comparison. N = 34 (“head-free”) and 36 (“head-fixed”) for all stimuli. All data in this figure was normalized to the high contrast value indicated by the brown arrow in Figure 3H.
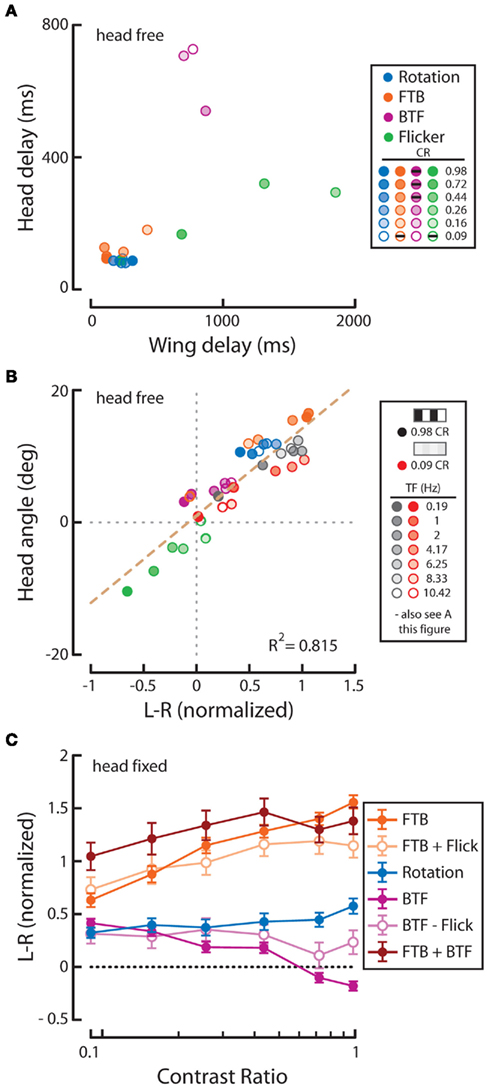
Figure 5. Response delay and correlation of the wings and head and analysis of the summation of half-field stimuli. (A) Wing and head response delays, as calculated in Figure 2, from data sets plotted within Figures 3 and 4. Delays to rotation (blue), front-to-back (FTB) motion (orange), back-to-front (BTF) motion (magenta), and flicker (green) are displayed for all tested contrasts (see shading as indicated in legend). Responses where either head or wing steering did not rise above the set threshold are not plotted but are identified with black dashes in the legend. (B) Wing and head response magnitudes across temporal frequencies at high (gray) and low (red) contrast (Figure 1) along with responses from Figures 3 and 4 are plotted and fitted with a dashed regression line (R2 = 0.815). The upper right quadrant holds wing and head responses to the right. (C) We analyzed the statistical significance (see companion Table 4) between “head-fixed” responses to rotation (blue) and (1) the responses to FTB motion (orange) added to those to flicker (FTB + Flick, light orange) (2) the responses to BTF motion (magenta) subtracted from those to flicker (BTF – Flick, light magenta) and (3) the responses to FTB motion (orange) added to those to BTF motion (FTB + BTF, rust). In addition we compared the flicker adjusted FTB + Flick to BTF − Flick. “Head-fixed” flies were utilized for this analysis as the azimuthal position of half-field stimuli remained constant on the retina for the entire stimulus duration.
For the two experiments, variation in contrast and TF and variation in the spatial extent and contrast, each fly received all treatments. This design enabled statistical analyses on normally distributed data with a one-way (* in Tables 2 and 3) or two-way (all Tables except where indicated) repeated measures ANOVA for one or two within-subjects variables. For statistical analyses between “head-free” and “head-fixed” conditions, data were analyzed with a two-way non-repeated measures ANOVA († in Table 2). Significance in these tables indicates that the mean for any one individual condition is significantly different from the aggregate mean across all the indicated experimental conditions.
Results
To test the contribution of each eye to the classic optomotor response we first sought stimulus parameters which generate large optomotor responses to binocular full-field rotation, over a range of contrasts. If indeed responses to monocular or “half-field” motion can be summed to equal those to full-field rotation (referred heretofore simply as “rotation”), testing these stimuli in order over a range of stimulus strengths, followed by a comparative analysis of responses to each stimulus, should delineate the relative contribution of each component toward optomotor flight responses. We quantified flight optomotor responses with an electronic flight simulator (Figure 1A) which enables us to measure steering responses to rightward, horizontally rotating patterns of vertical stripes (Figures 1A,B). In response to a high contrast rotating pattern (contrast ratio or CR = 0.98, see Materials and Methods) with a SP of 30° and rotational velocity of 125° s−1, a resulting TF (velocity/SP) of 4.17 Hz (Figure 1C), flies respond to the 2.5-s stimulus time course by increasing the WBA of their left wing (white; dark gray envelope = SD) and concomitantly decreasing the amplitude of their right wing (black, light gray envelope = SD). Subtracting the amplitude of the right wing from the amplitude of the left wing (L–R, red), yields a time-varying measure of the relative magnitude of attempted turning.
To provide a second measure of the magnitude of optomotor responses and to compare the temporal characteristics of an additional motor output, we used video (Figure 1A) to measure horizontal (yaw) head movements generated during the first 1.5 s of the stimulus presentations (red dashed box in Figures 1C,D, right). By calculating the mean response of the population over time (Figure 1D, white; light gray = SD), as with wing steering, we can relate the activation of these motor outputs to visual stimulus parameters. On average, head yaw typically increases following stimulus onset and decreases later in the trial. The decrease in mean yaw angle is largely indicative of the onset of head saccades wherein smooth syn-directional head motions that follow pattern movement are interspersed with fast, large amplitude anti-directional “reset” shifts in gaze (compare Figure 1D, right, black to white).
Varying Temporal Frequency and Contrast
Optomotor responses to rotation by flying Drosophila vary in magnitude according to the TF and contrast of the stimulus pattern, peaking at TFs between 3 and 11 Hz and decaying rapidly over CRs ranging from 0.98 (i.e., 98% contrast) to 0.08 (or 8% contrast) at a TF of 7.73 Hz (Duistermars et al., 2007a; Tuthill et al., 2011). We thus examined rotational optomotor responses while varying TF and contrast by stimulating flies with horizontally rotating striped patterns at TFs ranging from 0.19 to 10.42 Hz (Figure 1E, bottom, see Materials and Methods) each presented for 2.5 s at high (CR = 0.98) and low (CR = 0.09) contrast (Figure 1E). At high contrast, flies increase L–R in an attempt to steer rightward in the direction of pattern motion with increasing TFs, the difference saturating above 1 Hz (Figure 1E, dark gray; gray envelope = SD). By taking the population average of the individual average L–R over the entire stimulus duration for each condition (see Materials and Methods), the dependence of L–R on TF at high contrast is evident (Figure 1F, dark gray; error bars indicate SE of the mean or SEM). Interestingly, the same pattern TFs presented at extremely low contrast yield qualitatively similar TF tuning between 0.1 and 5 Hz, albeit of a slightly lower magnitude, but responses to motion at TFs above 6.25 Hz (SP = 15°) are substantially reduced (Figure 1E, white; red envelope = SD and F, red). Analyses of average yaw head movements reveal near identical relationships of head turning and wing steering over TF and contrast (Figures 1G,H). For high contrast rotation, head turning increases with TF and saturates above 1 Hz, while responses to low contrast motion are similarly tuned to TF, though with slightly lower magnitudes, and decrease dramatically at TFs above 6.25 Hz (Figures 1G,H, color as in Figures 1E,F). A two-way repeated measures ANOVA, as all conditions were presented to every fly (N = 42; see Materials and Methods), revealed that both steering and head responses varied significantly across the range of TFs (Table 1; p < 0.001) and between the two tested contrasts (Table 1; p < 0.004).
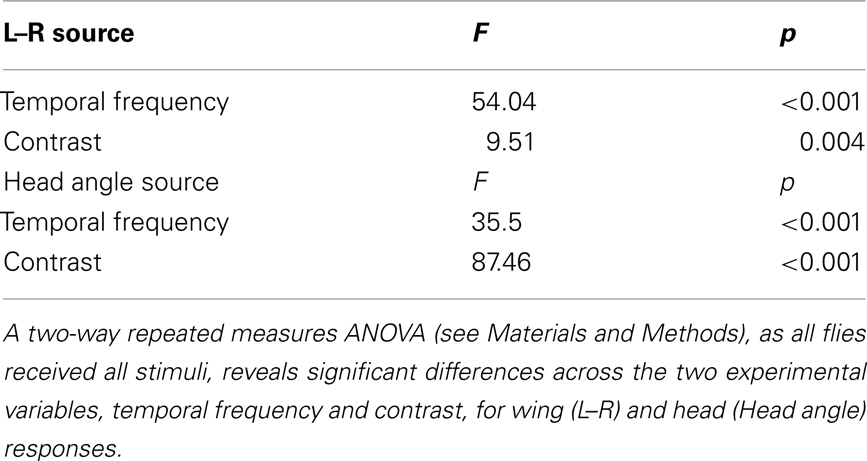
Table 1. Statistical analysis of data in Figures 1F,H.
We next calculated the wing and head response delay, from the population means for each condition, determined by the time taken to reach 1 SD above the baseline (see Materials and Methods). Wing or head responses which did not surpass 1 SD above baseline are not included. In general, wing and head onset delays co-vary, depending on the speed and contrast of motion (Figure 2). We found that wing and head response delays to high contrast TFs above 0.19 Hz clustered in a range from 92 to 220 ms and 73 to 120 ms, respectively (Figure 2, gray). Alternatively, many responses to low contrast motion were considerably delayed (Figure 2, red), particularly at a TF of 1 Hz which evoked wing and head delays of 716 and 393 ms compared to 220 and 120 ms at high contrast. Thus both the magnitude and delay of optomotor responses vary according to TF and contrast.
Responses to Full-Field Rotation
To provide a basis for comparing optomotor responses elicited by full-field rotation to those to half-field front-to-back (FTB) and back-to-front (BTF) motion, we next presented a rotating panorama with a constant TF of 3.75 Hz varying over six different CRs ranging from 0.09 to 0.98 (see Materials and Methods). A space–time plot of our rotation stimulus reveals the position of the pattern in the fly’s field of view over the course of the stimulus presentation (Figure 3A), whereas the tested contrasts are indicated elsewhere (Figure 3B, bottom). At this TF, consistent with Figure 1, wing steering responses to rotation are large across a broad range of contrasts (Figures 3B,C, dark gray; light gray envelope). Similarly, head optomotor responses are large at all contrasts with mean yaw angles peaking between 10° and 15° and population means over the measured stimulus duration persisting around 10° (Figures 3D,E, blue; light gray envelope). Though mean wing and head responses appear to peak slightly at intermediate contrasts, a one-way repeated measures ANOVA (* in Tables 2 and 3) of “head-free” rotation across contrast for the wings (Table 2, p = 0.375) and head motion (Table 3, p = 0.822) reveals that the differences are not significant (N = 34). We also plotted the first 1.5 s of the L–R traces from Figure 3B next to the mean head responses (Figure 3D, dark gray and right y-axis) revealing, as illustrated in Figure 2, that under these stimulus conditions head angle reaches the response maximum sooner than the wings.
We next repeated these experiments on flies with their heads immobilized (see Materials and Methods) in order to assess the contribution of head motion to wing steering. Furthermore, this will provide a basis for comparing subsequent half-field experiments where, without head immobilization, half-field stimuli might vary in position across the retina of an actively moving head. We found that wing steering responses by “head-fixed” flies, by comparison to head-free flies, are slightly reduced in magnitude (except at the highest tested contrast) and decline more steeply over the time course of the stimulus (Figures 3B,C, white; blue envelope). However, a two-way non-repeated measures ANOVA († in Table 2) of head-free vs. head-fixed responses to rotation across contrast reveals that the differences between these data are not significantly different (Table 2, p = 0.162). Similarly, we also found that responses by head-fixed flies did not vary significantly over contrast (N = 36, Table 2, p = 0.683) and thus, our combined results demonstrate that optomotor responses by both head-free and head-fixed flies to rotation are large over a range of contrasts. Indeed, if such steering behavior is representative of the summation of responses to the half-field motion components alone, the latter responses should be of significantly smaller magnitudes than those to full-field rotation.
Responses to Half-Field Rotation (Front-to-Back Motion on the Right)
We next presented the half-field components of rightward rotation at the same TF and contrasts as the full-field rotation stimuli. A space–time plot reveals the time-varying position of our half-field FTB stimulus (Figure 3F) in which motion is restricted to the right visual field and the rest of the arena is “on” (see Materials and Methods). Head-free steering behavior to FTB motion varies considerably from that to rotation in that the mean L–R rises continuously with contrast (Figures 3G,H, dark gray). Head responses show a similar relationship to wing responses across contrast (Figures 3I,J, orange) and unlike those to rotation, wing, and head responses to high contrast FTB motion appear to rise simultaneously following stimulus onset (Figure 3I). Statistical analysis reveals that head-free wing and head responses to FTB motion vary significantly with contrast (Tables 2 and 3, p < 0.001) but such responses are not significant when compared to those to rotation (Tables 2 and 3, p = 0.435 and p = 0.181, respectively). However, a post hoc multiple comparisons test with Bonferroni corrections revealed a significant difference between head-free wing responses to FTB motion vs. rotation at CRs of 0.09 and 0.98 (p < 0.05) demonstrating that the magnitude of optomotor responses to rotation, compared to FTB motion responses, are enhanced at low contrast, yet reduced at high contrast.
It is clear that high contrast FTB motion elicits large syn-directional head movements resulting in a displacement of the retinal position of the lateral wide-field stimulus toward visual midline. Accordingly, we repeated these experiments with head-fixed flies (Figures 3G,H, white; orange). When the retinal position of the FTB visual stimulus is fixed laterally, wing responses remain significantly different over contrast (Table 2, p < 0.001) and, notably, are significantly larger than both head-free responses to FTB motion and head-fixed responses to rotation (Table 2, p < 0.001). Together these results demonstrate that the responses of head-free flies to FTB motion, by comparison to rotation, are significantly larger (smaller) at high (low) contrast, whereas responses by head-fixed flies to FTB motion at all contrasts are much larger than those to rotation.
Responses to Half-Field Rotation (Back-to-Front Motion on the Left)
Full-field rightward rotation contains BTF motion on the left eye (Figure 4A), a stimulus which, like FTB motion on the right eye and full-field rotation, is expected to generate syn-directional turning. However, head-free steering behavior to BTF motion differs considerably from responses to rotation in that response magnitudes peak at the lowest tested contrasts and the wing steering response dynamics are slower (Figures 4B,C, dark gray). Additionally, at high contrast, BTF motion unexpectedly elicits slight anti-directional optomotor wing steering. Head responses vary over contrast in a manner similar to wing responses and are much reduced in magnitude compared to those to either rotation or FTB motion (Figures 4D,E, magenta). Although wing steering in response to BTF motion varies significantly across contrast (Table 2, p < 0.001), head movements do not (Table 3, p = 0.131). Furthermore, both wing and head responses are significantly smaller than head-free flies in response to either rotation or FTB motion (Tables 2 and 3, p < 0.001). Statistical analysis of the wing responses of head-fixed flies to BTF motion (Figures 4B,C, white/magenta) reveals that L–R indeed varies significantly across contrast (Table 2, p < 0.001) but as the responses are insignificantly different from that of head-free flies (Table 2, p = 0.71) it appears head movements have little influence on the magnitude of optomotor responses to this stimulus. Further, the responses of head-fixed flies to BTF motion across contrast are of significantly smaller magnitudes when compared to those to rotation and FTB motion (Table 2, p < 0.001) and thus, it is clear that FTB and BTF motion are not equal in their capacity to elicit optomotor responses.
Responses to Flicker on the Left
A drifting square-wave grating not only produces apparent motion signals, but also evokes on–off flicker at each spatial location. Flicker stimulates motion processing pathways and previous studies have demonstrated that flying flies respond not just to motion cues but also slowly steer toward an immobile flickering vertical bar (Geiger and Poggio, 1975; Pick, 1976). To test if the observed responses to our half-field stimuli are likewise motion independent, we presented a half-field flickering pattern at a frequency of 3.75 Hz (Figure 4F) to match the TF at which we presented our FTB and BTF motion stimuli (see Materials and Methods). Head-free wing and head motion responses toward half-field flicker are surprisingly robust and contrast sensitive, peaking at the highest tested contrast (Figures 4G–J). Indeed at the highest contrasts, responses to flicker are near equal, though in opposite direction, to those to full-field rotation stimuli. Statistical analysis reveals that both head-free wing and head optomotor responses are significantly contrast sensitive (Tables 2 and 3, p < 0.001) and significantly different from all previously tested stimuli (Tables 2 and 3, p < 0.013). Also, wing steering responses by head-fixed flies to flicker (Figures 4G,H, white/green) remain contrast dependent (Tables 2 and 3, p < 0.001), are highly insignificant from those by head-free flies (Tables 2 and 3, p = 0.991), and are significantly different from all previously tested head-fixed responses (Table 2, p < 0.001). Taken together, it therefore appears that the magnitude of behavioral responses to our half-field FTB and BTF motion stimuli may result from additional motion independent processes.
Comparison of Head and Wing Optomotor Responses
We next calculated the wing and head response delays, as in Figure 2 (see Materials and Methods), in order to provide a comparison among full-field rotation and the three half-field stimuli (Figure 5A). Again, data where either the wing or head response delay did not surpass 1 SD above baseline are not included. Consistent with Figure 2, wing and head optomotor response delays to rotating stimuli clustered from 172 to 316 ms and 80 to 93 ms, respectively, across contrast (blue). Wing responses to FTB motion at high contrast were faster than rotation at 104–118 ms and head responses were slightly slower from 93 to 126 ms (orange). At the lowest contrast that elicited a mean response above baseline (CR = 0.16) however, responses to FTB motion were considerably slower with delays of 428 and 180 ms compared to the 232 and 80 ms wing and head response delays to rotation, respectively. Response delays to BTF motion at CRs from 0.09 to 0.26 were dramatically increased compared to other stimuli, calculated at 704–870 ms for the wings and 540–726 ms for the head (magenta). Wing and head response delays to flicker vary from 232 to 86 ms respectively, at a CR of 0.98 and increase to 1314 and 320 ms at a CR of 0.44 (green). Thus it is evident that response delays vary not only according to TF and contrast (Figure 2) but also according to the spatial extent and motion characteristics of visual stimuli (Figure 5A).
We also compared the wing response delays of head-free and head-fixed flies to determine the influence of head immobilization on these parameters (Figure A1 in Appendix, dark and light dots, respectively). We found little effect of head immobilization on response delays to rotation and FTB motion with the former only slightly different at high contrasts and the latter faster at low contrasts (Figure A1 in Appendix, blue and orange). Of course despite these small differences in delay, head immobilization has a pronounced effect on the magnitude of these steering responses (Figures 3C,H). Alternatively, head immobilization has a comparatively small effect on the magnitude of steering responses to BTF motion and flicker (Figures 4C,H) but a larger influence on the response delays to these stimuli (Figure A1 in Appendix). Head-fixed flies respond faster than head-free flies to BTF motion at extremely low contrast but this result is largely inverted at higher contrasts (Figure A1 in Appendix, magenta). Notably, both head-fixed and head-free wing delays to this stimulus generally increase with pattern contrast but drop steeply at higher contrasts, indicating that such responses are influenced by an underlying contrast sensitive mechanism (note the differences in magnitude, Figure 4B). Finally, wing responses by head-fixed flies to asymmetrical flicker are faster than those of head-free flies at low contrast but slower at the highest contrast (Figure A1 in Appendix, green).
We next assessed the extent to which wing and head optomotor responses co-vary over all tested stimuli (Figure 5B). Indeed, optomotor responses of the wings and head are tightly correlated (dashed line, R2 = 0.815). Curiously, several head and wing responses are in opposite directions of one another, namely responses to FTB motion at a CR of 0.09, BTF motion at CRs of 0.98 and 0.72, and flicker at a CR of 0.16. This suggests there are perhaps some conditions where wing and head movements may be very weakly coupled (Figure 5B, see upper left and lower right quadrants), though such movements are coordinated to a high degree.
A Linear Summation?
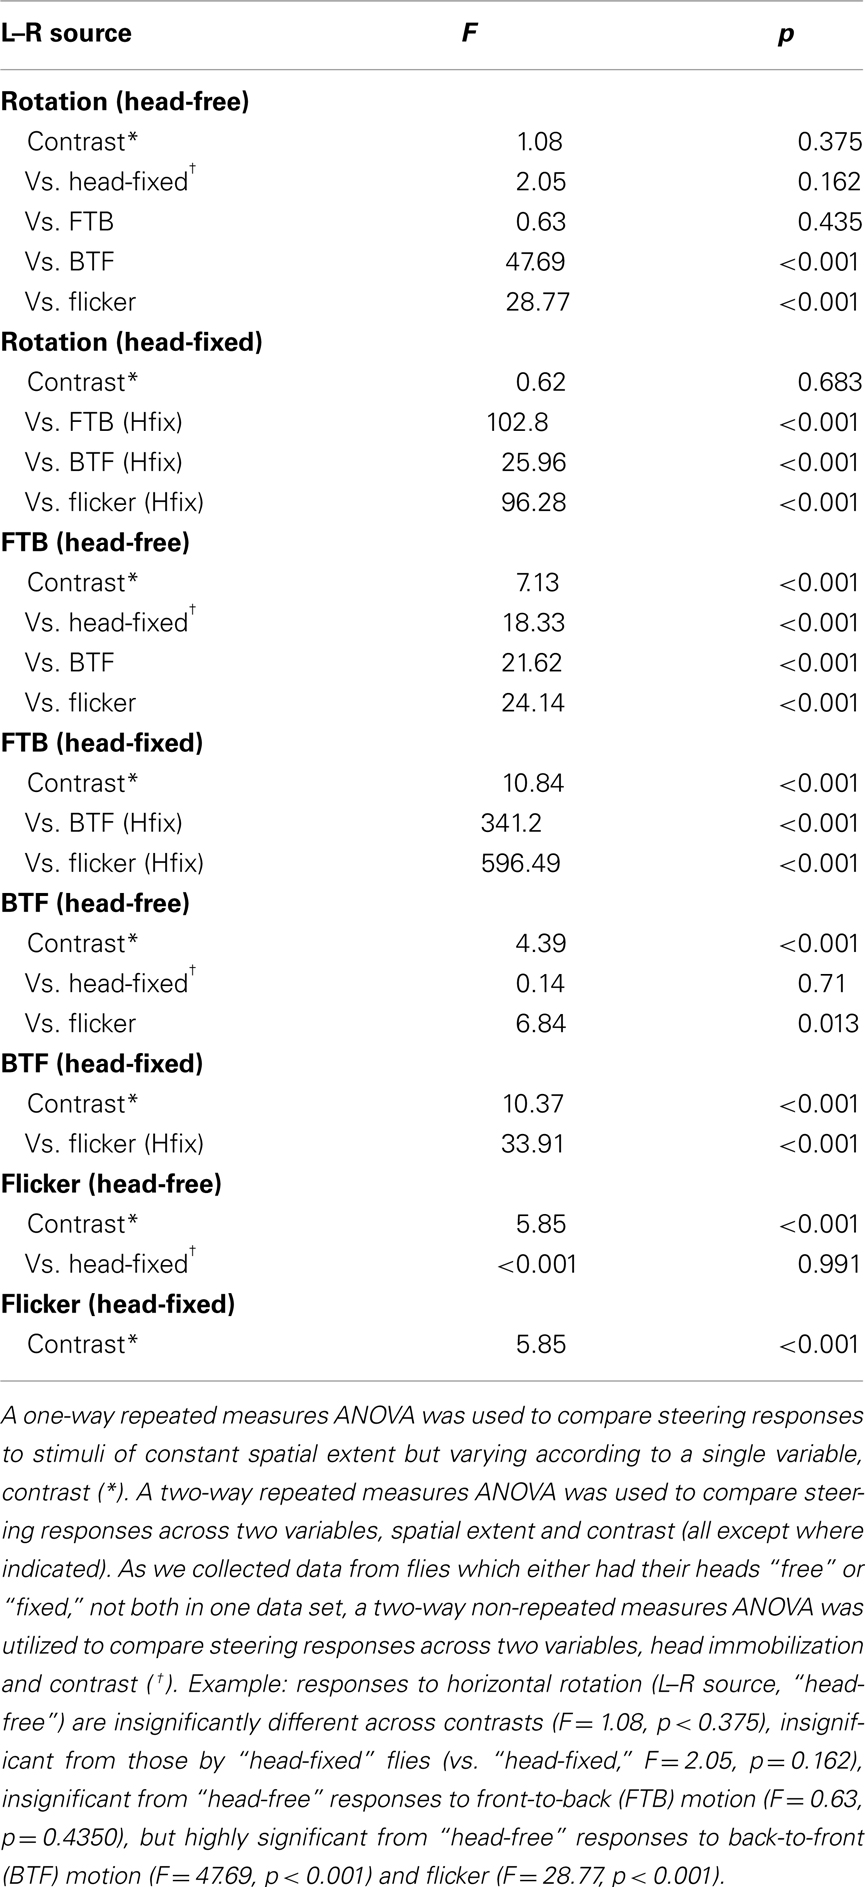
The responses of head-fixed flies to high contrast binocular full-field rotation are significantly smaller than those to monocular FTB motion despite the fact that the latter contains half the total motion energy (Figure 3H). We first wondered, as optomotor responses to FTB motion and flicker are similarly contrast sensitive and both directed toward the projected stimulus, if these differences might be due to a summation of motion dependent and motion independent steering systems. That is, do responses to FTB motion result from the cooperative sum of independent global direction-sensitive motion and local position-sensitive flicker pathways, whereas responses to rotation, which would be expected to stimulate position-sensitive flicker pathways symmetrically, lack the latter? To examine this possibility, we simply added, for each individual and condition, the measured head-fixed responses to flicker on the left (Figure 4H, green) to the head-fixed responses to FTB motion on the right (Figures 3H and 5C, dark orange). The resulting curve (Figure 5C, light orange), arguably representing the motion dependent responses to FTB motion, was significantly larger than head-fixed responses to rotation (Figure 5C, blue) indicating that the differences between responses to FTB motion and rotation cannot be explained by a simple summation of motion dependent and flicker responses (Table 4, p < 0.001).
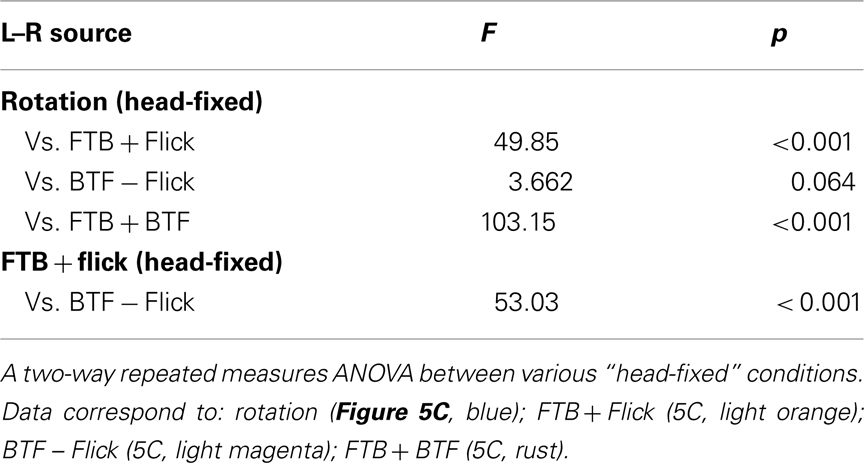
Table 4. Statistical analysis of data in Figure 5C.
Additionally, the responses of head-fixed flies to rotation at high contrasts are significantly larger than those to BTF motion (Figure 4C), a difference which may be due to a competing contrast sensitive flicker pathway which cancels any influence of contrast insensitive BTF motion pathways. Indeed, subtracting the responses to flicker (Figure 4H, green) from the responses to BTF motion (Figure 5C, magenta) results in a BTF motion dependent prediction that is not significantly different from responses to rotating stimuli (Figure 5C, light magenta; Table 4, p = 0.064). This suggests first that the weak steering observed in response to high contrast BTF motion may be explained by a competing flicker dependent response. However, the near twofold difference in magnitude between mean responses to rotation at high contrast and those to BTF motion adjusted for flicker (Figure 5C, blue and light magenta) and the slower response delays toward high contrast flicker compared to those toward high contrast BTF motion (Figure A1 in Appendix) do not support this hypothesis. Second, responses to rotation at low contrasts could result solely from a steering system sensitive to half-field BTF motion, but the slow response delays to such stimuli (Figure 5A) suggest the involvement of an additional mechanism.
Having now determined the motion dependent components of the responses to half-field stimuli, we next tested the hypothesis that responses to FTB and BTF motion, adjusted for the effects of flicker, are significantly different. Indeed, flicker adjusted responses to FTB motion (Figure 5C, light orange) are statistically different (Table 4, p < 0.001) from flicker adjusted responses to BTF motion (Figure 5C, light magenta). Finally, to test the hypothesis that responses to rotation are the linear sum of the two half-field components, we added responses to FTB motion on the right to those to BTF motion on the left (Figure 5C, rust). We find that responses to rotation are significantly smaller than the linear sum of the individual half-field components (Table 4, p < 0.001) and accordingly cannot be explained as such.
Discussion
We have explored several properties of the sensory–motor transformations underlying the classic optomotor response in Drosophila. Consistent with previous results (e.g., Duistermars et al., 2007a), the magnitude and delay of wing and head optomotor responses vary according to the TF and contrast of a motion stimulus (Figures 1 and 2). Despite their ability to execute robust steering responses over a range of TFs at high contrast, tethered flying flies respond to low contrast motion in a comparatively narrow range of TFs and in some cases with slower response delays. Also, and consistent with previous studies (Wehrhahn, 1981; Tammero et al., 2004), optomotor response magnitude and delay varies according to the spatial extent and direction of motion (Figures 3–5). Notably, and barring a non-linear effect of asymmetrical flicker, half-field front-to-back (FTB), and back-to-front (BTF) motion do not evoke similar wing and head steering responses at any stimulus strength. Rather, the opposing contrast dependencies to FTB and BTF motion (compare Figures 3G–J to Figures 4B–E) are largely cooperative such that behavioral responses to both components presented together (full-field rotation) are contrast invariant (Figures 3B–E). Finally, flight optomotor responses to rotation are not, as is the case for the motion dependent responses of centrifugal horizontal (CH) LPTCs (Egelhaaf et al., 1993), representative of the arithmetic sum of responses to each individual half-field component alone (Figure 5C). Indeed the sum of mean behavioral responses to FTB and BTF motion is significantly larger than responses to full-field rotation indicating that non-linear contralateral inhibitory and excitatory interactions underlie the observed rotational optomotor responses by tethered flying Drosophila.
The perception of visual motion in Drosophila begins with the detection of light by an array of approximately 750 ommatidia per eye, each containing eight retinal photoreceptors (Ready et al., 1976; Sanes and Zipursky, 2010). Photoreceptors 1–6 feed retinotopically, via neural superposition, onto the post-synaptic circuits of the lamina (Heisenberg and Buchner, 1977; Hardie, 1979) which are thought to provide the pre-processing necessary to confer directionally selective motion sensitivity (Borst and Egelhaaf, 1989; Rister et al., 2007; Zhu et al., 2009; Joesch et al., 2010; Clark et al., 2011; Eichner et al., 2011). Though the precise functions of the many classes of medullar neurons remain elusive (Fischbach and Dittrich, 1989; Bausenwein et al., 1992), anatomical studies reveal motion sensitive efferents to both the lobula (Otsuna and Ito, 2006; Strausfeld and Okamura, 2007) and the lobula plate (Douglass and Strausfeld, 1996; Scott et al., 2002). Electrophysiological recordings in LPTCs have revealed that the magnitude and latency of motion dependent responses in these cells are sensitive to both the TF and CR of pattern motion (e.g., Warzecha and Egelhaaf, 2000). The weak behavioral steering responses to very low TFs (Figures 1 and 2) and very high TFs at low contrast, reflects the limitations of the peripheral motion detection circuitry. Further, optomotor responses to visual motion are largely dependent on LPTCs (Heisenberg et al., 1978) and as such, we adapt a published diagram of LPTC organization (Figures 6 and 7; Borst et al., 2010; and references therein) to describe the lobula plate circuitry that may underlie the behavioral responses we have observed. Without providing robust modeling efforts (e.g., Hennig et al., 2011), we admit that speculation on such complex circuitry, informed only by our behavioral results, is limited. Nevertheless, our behavioral observations provide a framework for new insights with regard to the function of the Drosophila LPTC network. Also, whereas much of the specific synaptic connectivity has been elucidated in other fly species, recent work suggests that motion processing in Drosophila, with the possible exception of H1 cells, is accomplished via circuits with strikingly similar anatomy, connectivity, and motion dependent response properties (Bausenwein et al., 1990; Scott et al., 2002; Joesch et al., 2008; Schnell et al., 2010; Eichner et al., 2011).
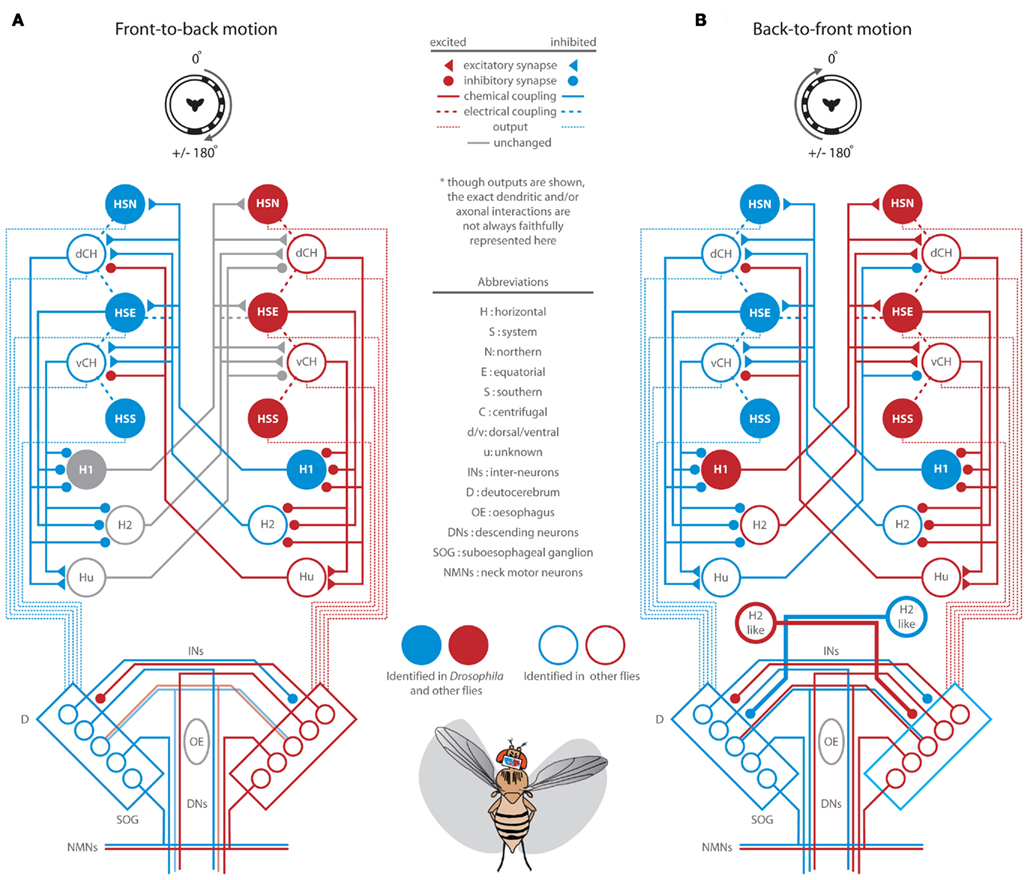
Figure 6. Summary diagram of presumed lobula plate tangential cell (LPTC) activation (red = depolarization) and inhibition (blue = hyperpolarization) in response to half-field front-to-back motion (A) and half-field back-to-front motion (B). This diagram is reproduced with some modification from Borst et al. (2010) and established from references cited here and therein. Circuits downstream of the lobula plate are modified from Strausfeld and Seyan (1985), Strausfeld and Gronenberg (1990), Strausfeld et al. (1995). See Figures 3F–J and 4A–E for relevant data and text for a full discussion of this diagram. We note, as we have included indications of neural outputs to subsequent premotor and motor processing elements, our adapted diagrams do not always accurately represent the precise spatial input/output relationships and ignore many other pathways which may contribute to optomotor responses, one such being those from the lobula to the optic glomeruli of the protocerebrum (Otsuna and Ito, 2006).
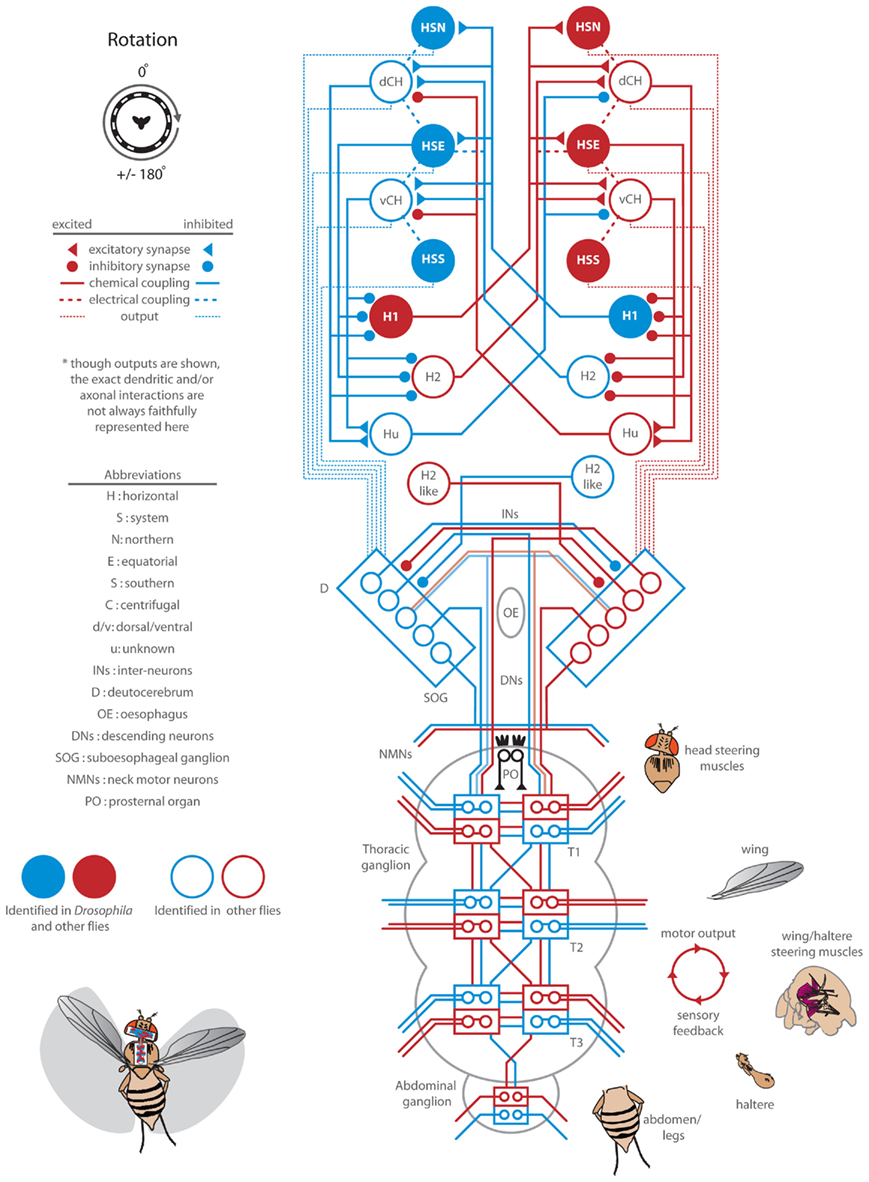
Figure 7. Summary diagram of presumed lobula plate tangential cell (LPTC) activation (red = depolarization) and inhibition (blue = hyperpolarization) in response to full-field rotation and neural control of the resulting motor output. This diagram is reproduced with some modification from Borst et al. (2010) and established from references cited here and therein. Post lobula plate circuits are modified from Strausfeld and Seyan (1985), Strausfeld and Gronenberg (1990), Hengstenberg (1991), Strausfeld et al. (1995). See Figures 3A–E for relevant data and text for a full discussion of this diagram.
Front-to-Back Motion
Consistent with previous results (Kern and Egelhaaf, 2000), open-loop FTB motion restricted to the right side of the visual field elicits robust contrast dependent wing and head syn-directional optomotor responses to the right (Figures 3G–J). Further, FTB motion activates a wide variety of LPTCs (Figure 6A, red). The three right HS cells are depolarized in response to such motion and exert an excitatory effect on electrically coupled CH cells (Eckert and Dvorak, 1983). This stimulus is further expected to inhibit (Figure 6, blue) ipsilateral H1 and H2 cells and stimulate contralaterally projecting horizontal unknown (Hu) cells (Haag and Borst, 2001), which in turn, inhibit contralateral CH and indirectly, HS cells. Electrophysiological studies demonstrate that HS cells have a similar contrast dependence to that which we have observed behaviorally in response to FTB motion (Joesch et al., 2010). This suggests that the behavioral responses we observe may be limited by the contrast sensitivity of HS cells and their inputs. Responses toward half-field flicker are similarly contrast sensitive (Figures 4G–J) and may proceed from the same inputs. Both photoreceptors and second order laminar cells respond similarly to motion and flicker, with motion specificity emerging within the third order medullar neurons (Hardie, 1985; Gilbert et al., 1991; Douglass and Strausfeld, 1996). Furthermore, HS neurons in Drosophila respond to both motion (Schnell et al., 2010) and flicker (Tuthill et al., 2011) and as such, the parsimonious explanation for the observed behavioral responses to flicker is a sensitivity to such stimuli within the motion pathway.
The outputs of HS cells converge onto GABAergic interneurons (INs) linking the right and left deutocerebra (D) which may facilitate the contralateral inhibition of opposing deutocerebral circuitry (Strausfeld et al., 1995). In addition, an array of homo and heterolateral descending neurons (DNs) with dendrites in deutocerebral, as well as proto and tritocerebral clusters, supply the motor systems of the thoracic ganglion and presumably trigger robust compensatory steering behaviors (Strausfeld and Bassemir, 1985a,b; Strausfeld and Gronenberg, 1990). Although it is not known whether the muscles controlling head movements in Drosophila are similar among all flies (Hartenstein, 2006), in larger flies, oblique horizontal muscles spanning the cervical connective are activated by the neck motor neurons (NMNs) of the cervical nerve arising in the subesophageal ganglion (SOG) and are potentially involved in yaw movements of the head (Strausfeld et al., 1987). Half-field FTB motion generates hemispheric differences in the depolarization or hyperpolarization of neurons residing in the left and right lobula plate (Figure 6, red vs. blue), providing sufficient signaling to modulate the stroke amplitudes of the left and right wings and yaw movements of the head (Figures 3G,H).
Back-to-Front Motion
BTF motion restricted to the left side of the visual field elicits robust but slow onset wing and head steering that peaks at low contrasts (Figures 4B–E). Within the lobula plate, half-field BTF motion is expected to activate a wide variety of LPTCs (Figure 6B). HS and CH cells ipsilateral to the motion stimulus are hyperpolarized (Figure 6B, blue) in response to such motion while heterolateral H1 and H2 cells are depolarized (Figure 6B, red) and stimulate HS and CH cells in the contralateral lobula plate. However, without the simultaneous presentation of contralateral FTB motion, the graded depolarization of HS is considerably reduced (Farrow et al., 2006). Curiously, for both HS and CH cells, such graded changes in response to high contrast motion are largely replaced by H1 and H2 induced EPSPs (Haag et al., 1999; Horstmann et al., 2000). At high contrast we might expect the resulting H1 and H2 mediated activation of contralateral HS and CH cells to generate significant rightward turning. However, our results alternatively demonstrate that high contrast BTF motion alone elicits anti-directional steering (Figures 4B,C) indicating that the activation of LPTCs in response to this stimulus does not generate syn-directional optomotor reactions. This may result from a summation of competing and opposing flicker and BTF motion pathways that cancel out, though our results do not entirely support this hypothesis (Figure 5C).
It seems reasonable to suggest that these responses to high contrast motion reflect the influence of heterolateral LPTCs not just on their contralateral target LPTCs, but on post-synaptic circuits. Indeed, BTF motion sensitive H2-like cells in other flies are GABAergic, project to the output regions of the contralateral lobula plate (Figure 6B, bold), and presumably inhibit post-synaptic targets in the GABA convergence zone of the deutocerebrum (Strausfeld et al., 1995). Although the activation of H2 excites HS and CH cells, it seems plausible that H2 inhibits contralateral post-synaptic DNs and contralateral inhibitory interneurons in response to high contrast BTF motion. Such inhibition may indirectly disinhibit DNs ipsilateral to the motion stimulus, activating a slight decrease and increase in the amplitudes of the left and right wings, respectively. However, such a hypothesis leads to a paradox as H2 cells, which respond primarily to BTF motion in the fronto-lateral visual field (Krapp et al., 2001), are presumably active during the presentation of high contrast motion restricted to the fronto-lateral 90° field of view, a stimulus which reliably generates vigorous steering responses away from the motion unlike those which we have observed (Tammero et al., 2004; Rister et al., 2007). This suggests that either GABAergic H2 cells are not involved or that perhaps our larger half-field BTF stimulus may be activating H2-like cells with receptive fields in the more lateral or posterior field of view. Such a hypothesis might be resolved by presenting various quarter-field BTF stimuli (Tammero et al., 2004) simultaneously with contralateral FTB motion and help explain why other studies have also reported weak yaw responses to BTF motion in flight (Heisenberg, 1972; Götz et al., 1979; Wehrhahn and Hausen, 1980; Hausen and Wehrhahn, 1990).
At low contrast, we found that steering responses to flicker are largely absent suggesting, at the very least, that the observed rightward responses to low contrast BTF motion on the left are indeed motion dependent. If the leftward turning in response to high contrast BTF motion is indeed mediated by GABAergic H2-like cells, it remains a question as to what circuits mediate rightward responses to low contrast BTF motion. As H2 is demonstrably sensitive to contrast (Farrow et al., 2006), it seems possible that in response to BTF motion, H2 may activate contralateral HS and CH cells below the threshold for which it inhibits downstream targets. Alternatively, H1 cells (Bausenwein et al., 1990), unlike H2, are largely contrast insensitive (Haag et al., 2004), project to the dendritic input regions of HS and CH cells (Eckert and Dvorak, 1983), and, consistent with the slow behavioral response delays to BTF motion (Figure 5A, magenta), activate these circuits on a significantly slower time course (Horstmann et al., 2000). Curiously, inputs to HS responding to FTB and BTF motion (Joesch et al., 2010) and behavioral responses to FTB motion (this study) all appear to be dependent upon contrast. It remains unclear, however, if the inputs to H1, H2, and even HS which respond to BTF motion are similarly or differentially contrast sensitive. Further, it is unknown what role the depolarization of HS cells ipsilateral to BTF motion stimuli plays in behavioral output and if BTF motion exerts its behavioral effects solely through contralateral interactions, as the lack of ipsilateral H1 and H2 projections to ipsilateral premotor circuits suggests, or is mediated by as yet unidentified ipsilateral premotor circuitry.
Full-Field Rotation
Full-field rotation elicits robust and, at certain TFs, surprisingly contrast insensitive wing and head optomotor responses (Figures 3B–E). Within the lobula plate, rightward visual rotation is expected to strongly and cooperatively activate most of the circuitry described in Figures 6A,B (summarized in Figure 7). The lateral half-field FTB motion component activates HS, CH, and Hu cells in the right lobula plate whereas the lateral BTF component activates H1 and H2 cells in the left lobula plate. Responses to rotation at high contrast are smaller than those to lateral FTB motion alone (Figure 3H), perhaps due to the inhibitory effect of high contrast BTF motion acting contralaterally through H2-like cells on the premotor circuitry responding strongly to high contrast FTB motion. Alternatively, head-free responses to rotation at low contrast are larger and faster than those to FTB and BTF motion alone (Figures 3H and 4C), perhaps due to the excitatory effect of low contrast BTF motion acting contralaterally through H1 cells on LPTCs weakly sensitive to low contrast FTB motion. Together such circuits suppress or enhance the activation of contralateral LPTCs facilitating robust contrast insensitive responses to rotation (Figures 3 and 5A).
Here we have only observed horizontal, or yaw movements of the head and wings and thus, a technical limitation of our study is the absence of observations concerning motor outputs along other axes, such as roll and pitch. In free flight, bilateral and anterior–posterior asymmetries are generated within the vertical system in response to bodily rotation around the longitudinal, or roll axis and the transverse, or pitch axis, respectively. Such asymmetries are enhanced by contralaterally and ipsilaterally projecting inhibitory V1, V2-like, and Vi cells (Strausfeld et al., 1995; Kurtz et al., 2001; Haag and Borst, 2007, 2008). It is possible that the VS circuit ensembles interactively respond to varying to visual contrast in a manner similar to that which we have posited for heterolateral horizontal cell interactions. Like the motion dependent activation of LPTCs, the DNs which receive inputs from the vertical system are more strongly activated in response to binocular or ipsilateral bidirectional motion by comparison to monocular or unidirectional motion stimuli alone (Haag et al., 2007; Wertz et al., 2008). These observations suggest that such cells, and perhaps likewise DNs sensitive to horizontal motion, may not be subject to contralateral or ipsilateral inhibition. However, microlesions of contralateral and ipsilateral premotor pathways have demonstrated an extreme redundancy of, and a likely role for, contralateral excitation and inhibition in shaping optomotor responses (Strausfeld et al., 1995), suggesting that the role of inhibition in the control of these circuits remains to be fully resolved.
Head Movements
In addition to the direct activation of cervical NMNs by LPTCs, HS cells activate DNs which project to regions of the ipsilateral and contralateral thoracic ganglion (Figure 7; Strausfeld and Bassemir, 1985a). In the first stage of processing within the first prothoracic ganglion (T1), anterior dorsal nerve NMNs in larger flies activate transverse horizontal neck muscles, which in conjunction with the aforementioned oblique horizontal muscles, control yaw movements of the head (Strausfeld et al., 1987; Gilbert et al., 1995). By way of contralateral interactions and perhaps coordinated by prothoracic inhibitory interneurons (Strausfeld et al., 1995), most NMNs are tuned to respond to panoramic motion cues from both eyes and are more sensitive to full-field motion than are individual input LPTCs (Huston and Krapp, 2008). We observed individual head movements of flying Drosophila spanning a maximum range of ±25° in the yaw axis. This range is consistent with observations of tethered flying blowflies (Hengstenberg et al., 1986) but is both smaller and larger, respectively, than similar observations on non-flying fixed flies (Rister et al., 2007) and flying flies in simulated or actual free flight conditions (Land, 1973; Schilstra and van Hateren, 1998). We have also observed that in most cases, head movements reach peak angles sooner than the wings (Figures 3D and 4D,I) except in response to high contrast half-field FTB motion where they occur simultaneously (Figure 3I). Indeed, head motor responses are not, or at least less, subject to precisely the same activation thresholds or context dependent constraints as those controlling the wings. First, wing and head response delays are not linearly correlated (Figure 5A) and second, some conditions evoke wing and head responses in different directions (Figure 5B). Thus, the specific stimulus regime is important to consider, as pooling data from multiple stimulus conditions demonstrates that wing and head movements are tightly synchronized (Figure 5B).
Although head movements precede and are synchronized with movements of the wings, yaw head movements of flying Drosophila are, as previously suggested (Geiger and Poggio, 1977), not a required prerequisite for motion induced wing optomotor steering (Figures 3C,I and 4C,I). Consistent with previous studies (Kern et al., 2006), the larger optomotor responses by head-fixed flies to FTB motion (Figure 3H, orange) do indeed suggest, however, that the active maintenance of head position by freely flying flies may function to enhance the detection of low contrast FTB motion stimuli where continuous head movements obfuscate the detection of such weak visual cues (Figure 3H, gray). Though insignificantly different with conservative statistical tests, the response magnitudes of head-fixed flies in response to visual rotation appear generally reduced, (Figures 3B,C), an observation possibly due to the loss of the mechanosensory stimulation from an actively moving head. Ventral neck mechanoreceptors such as the prosternal organ (PO; Figure 7) encode head position (Preuss and Hengstenberg, 1992) and by way of direct connections to NMNs, influence head movements in turn (Strausfeld and Seyan, 1985). However, the PO encodes head yaw weakly (Paulk and Gilbert, 2006) and although yaw movements of the head appear sufficient to elicit wing steering (Liske, 1977; Preuss and Hengstenberg, 1992), the large responses of head-fixed flies to FTB motion may suggest that PO input is not necessarily limiting and the weaker responses to rotation are due to something other than the loss of these mechanosensory inputs. These response decays are almost entirely due to a decline in the amplitude of the left wing (data not shown), apparently unique to full-field rotational motion, and may be due to either a loss of the functional consequences of head optomotor nystagmus (Kien and Land, 1978) or the stimulus dependent depletion of contralateral inhibitory interneurons (Strausfeld et al., 1995).
Other Motor Systems
In addition to head steering muscles, an ensemble of wing steering muscles are indirectly activated by DNs and coordinated through the ipsilateral and contralateral inhibition and excitation of T2 motor neurons to generate asymmetrical changes in wing amplitudes at the appropriate phase of the wing beat cycle (Figure 7; Egelhaaf, 1989; Balint and Dickinson, 2004). Additionally, visual input to the motor neurons controlling the gyroscopic haltere may modulate haltere kinematics (Chan et al., 1998) and, via sensory coding by mechanosensors at the base of the haltere, modulate motions of the wings and head (Sandeman and Markl, 1980; Hengstenberg, 1991; Fayyazuddin and Dickinson, 1996; Sherman and Dickinson, 2004; Huston and Krapp, 2009). To further enhance steering maneuvers in free flight, flying flies actively modulate the position of their abdomen and hind legs in the direction of head and wing steering (Zanker, 1988). Consistent with our results, such abdominal responses are activated by full-field rotation and to a higher (lesser) degree in response to FTB (BTF) motion (Götz et al., 1979). These movements result from the coordinated activation of associated muscles by descending inputs to T3 and the abdominal ganglion (Milde and Strausfeld, 1990; Hartenstein, 2006) and as similar to our observations for head yaw (Figure 5B), are largely correlated with movements of the wings (Götz et al., 1979; Zanker et al., 1991).
Conclusion
Having speculated upon the putative neuronal basis underlying our behavioral observations in tethered flying flies, the relevance to free flight remains somewhat unclear. Though heterolateral LPTCs sensitive to binocular rotation may be involved in optomotor stabilization during low velocity forward flight, at high velocity, H1 cells, and presumably H2, are inhibited during inter-saccadic intervals by inputs responding strongly to translational FTB motion (van Hateren et al., 2005). Furthermore, yaw stabilization responses to full-field rotation are generally weaker by comparison to those elicited by other, perhaps more important, axes of wide-field motion (Theobald et al., 2010). It may be that the contrast insensitive encoding of visual rotation is less important for general optomotor stabilization and is rather involved in the suppression of steering responses to motion perceived during saccades (Zaretsky and Rowell, 1979). H1 cells have been posited to indirectly suppress “false,” and also perhaps “true,” object responses in contralateral figure detecting cells activated by visual motion during saccadic rotation (van Hateren et al., 2005) and similarly, the inhibitory effect of H2 cells on targets in the GABA convergence zone of the deutocerebrum (Strausfeld et al., 1995) may block wide-field detecting neurons from activating downstream circuitry during saccades. However, investigations into this question reveal that it is primarily the halteres, not visual motion, which mediates saccadic suppression in Drosophila (Bender and Dickinson, 2006). What then is the function of the rotational motion perceived during saccades? It is possible that such motion influences the timing, size, and direction of subsequent saccades through a persistent inhibitory effect of H2 cells, and perhaps other sensory modalities (Mamiya et al., 2011), on targets in the GABA convergence zone (Strausfeld et al., 1995). This could result in subsequent saccades being biased in the same direction as the previous one (Mayer et al., 1988). This hypothesis is particularly interesting given that attractive odors enhance optomotor responses to visual rotation (Chow and Frye, 2008) and rotational optic flow is permissive for odor mediated reductions of saccade amplitude and frequency (Duistermars and Frye, 2008; Krishnan et al., 2011).
Heterolateral interactions within visual systems are not limited to flies and indeed, the visual systems of flies are startlingly similar to those of vertebrates (Sanes and Zipursky, 2010). Such comparisons reveal that the contralateral inhibitory and excitatory processes operating within recurrent networks of LPTCs may be analogous to suppressive and additive processes in the mammalian LGN which either participate in binocular rivalry (Wunderlich et al., 2005; Tang and Juusola, 2010) or enhance binocular visual detection beyond that achievable with one eye alone (Bearse and Freeman, 1994). It may thus be that further exploration of the heterolateral mechanisms partially described here will yield insights into our own everyday experience.
Conflict of Interest Statement
The authors declare that the research was conducted in the absence of any commercial or financial relationships that could be construed as a potential conflict of interest.
Acknowledgments
Brian J. Duistermars and Rachel A. Care conceived the experiments. Rachel A. Care conducted the experiments and collected data. Brian J. Duistermars analyzed data, and wrote the paper with editorial assistance from Mark A. Frye. Mark A. Frye is an Early Career Scientist with the Howard Hughes Medical Institute. Rachel A. Care was supported by a supplement Research Experience for Undergraduates grant from the National Science Foundation (IOS-0718325).
References
Balint, C. N., and Dickinson, M. H. (2004). Neuromuscular control of aerodynamic forces and moments in the blowfly, Calliphora vicina. J. Exp. Biol. 207, 3813–3838.
Bausenwein, B., Buchner, E., and Heisenberg, M. (1990). Identification of H1 visual interneuron in Drosophila by [3H]2-deoxyglucose uptake during stationary flight. Brain Res. 509, 134–136.
Bausenwein, B., Dittrich, A. P. M., and Fischbach, K. F. (1992). The optic lobe of Drosophila melanogaster. Cell Tissue Res. 267, 17–28.
Bearse, M. A. Jr., and Freeman, R. D. (1994). Binocular summation in orientation discrimination depends on stimulus contrast and duration. Vision Res. 34, 19–29.
Bender, J. A., and Dickinson, M. H. (2006). A comparison of visual and haltere-mediated feedback in the control of body saccades in Drosophila melanogaster. J. Exp. Biol. 209, 4597–4606.
Blondeau, J., and Heisenberg, M. (1982). The three-dimensional optomotor torque system of Drosophila melanogaster. J. Comp. Physiol. A 145, 321–329.
Borst, A., and Egelhaaf, M. (1989). Principles of visual motion detection. Trends Neurosci. 12, 297–306.
Chan, W. P., Prete, F., and Dickinson, M. H. (1998). Visual input to the efferent control system of a fly’s ‘gyroscope.’ Science 280, 289–292.
Chow, D. M., and Frye, M. A. (2008). Context-dependent olfactory enhancement of optomotor flight control in Drosophila. J. Exp. Biol. 211, 2478–2485.
Clark, D. A., Bursztyn, L., Horowitz, M. A., Schnitzer, M. J., and Clandinin, T. R. (2011). Defining the computational structure of the motion detector in Drosophila. Neuron 70, 1165–1177.
Douglass, J. K., and Strausfeld, N. J. (1996). Visual motion-detection circuits in flies: parallel direction- and non-direction-sensitive pathways between the medulla and lobula plate. J. Neurosci. 16, 4551–4562.
Duistermars, B. J., Chow, D. M., Condro, M., and Frye, M. A. (2007a). The spatial, temporal and contrast properties of expansion and rotation flight optomotor responses in Drosophila. J. Exp. Biol. 210, 3218–3227.
Duistermars, B. J., Reiser, M. B., Zhu, Y., and Frye, M. A. (2007b). Dynamic properties of large-field and small-field optomotor flight responses in Drosophila. J. Comp. Physiol. A Neuroethol. Sens. Neural. Behav. Physiol. 193, 787–799.
Duistermars, B. J., and Frye, M. A. (2008). Crossmodal visual input for odor tracking during fly flight. Curr. Biol. 18, 270–275.
Eckert, H., and Dvorak, D. R. (1983). The centrifugal horizontal cells in the lobula plate of the blowfly, Phaenicia sericata. J. Insect Physiol. 29, 547–553, 555–560.
Egelhaaf, M. (1989). Visual afferences to flight steering muscles controlling optomotor responses of the fly. J. Comp. Physiol. A 165, 719–730.
Egelhaaf, M., Borst, A., Warzecha, A. K., Flecks, S., and Wildemann, A. (1993). Neural circuit tuning fly visual neurons to motion of small objects. II. Input organization of inhibitory circuit elements revealed by electrophysiological and optical recording techniques. J. Neurophysiol. 69, 340–351.
Egelhaaf, M., Kern, R., Krapp, H. G., Kretzberg, J., Kurtz, R., and Warzecha, A. K. (2002). Neural encoding of behaviourally relevant visual-motion information in the fly. Trends Neurosci. 25, 96–102.
Eichner, H., Joesch, M., Schnell, B., Reiff, D. F., and Borst, A. (2011). Internal structure of the fly elementary motion detector. Neuron 70, 1155–1164.
Farrow, K., Haag, J., and Borst, A. (2006). Nonlinear, binocular interactions underlying flow field selectivity of a motion-sensitive neuron. Nat. Neurosci. 9, 1312–1320.
Fayyazuddin, A., and Dickinson, M. H. (1996). Haltere afferents provide direct, electrotonic input to a steering motor neuron in the blowfly, Calliphora. J. Neurosci. 16, 5225–5232.
Fischbach, K. F., and Dittrich, A. P. M. (1989). The optic lobe of Drosophila melanogaster. I. A Golgi analysis of wild-type structure. Cell Tissue Res. 258, 441–475.
Frye, M. A., and Dickinson, M. H. (2001). Fly flight: a model for the neural control of complex behavior. Neuron 32, 385–388.
Gauck, V., and Borst, A. (1999). Spatial response properties of contralateral inhibited lobula plate tangential cells in the fly visual system. J. Comp. Neurol. 406, 51–71.
Geiger, G., and Nässel, D. R. (1982). Visual processing of moving single objects and wide-field patterns in flies: behavioural analysis after laser-surgical removal of interneurons. Biol. Cybern. 44, 141–149.
Geiger, G., and Poggio, T. (1975). The orientation of flies towards visual patterns: on the search for the underlying functional interactions. Biol. Cybern. 19, 39–54.
Geiger, G., and Poggio, T. (1977). On head and body movements of flying flies. Biol. Cybern. 25, 177–180.
Gilbert, C., Gronenberg, W., and Strausfeld, N. J. (1995). Oculomotor control in calliphorid flies: head movements during activation and inhibition of neck motor neurons corroborate neuroanatomical predictions. J. Comp. Neurol. 361, 285–297.
Gilbert, C., Penisten, D. K., and DeVoe, R. D. (1991). Discrimination of visual motion from flicker by identified neurons in the medulla of the fleshfly Sarcophaga bullata. J. Comp. Physiol. A 168, 653–673.
Götz, K. G. (1968). Flight control in Drosophila by visual perception of motion. Kybernetik 4, 199–208.
Götz, K. G. (1975). The optomotor equilibrium system of the Drosophila navigation system. J. Comp. Physiol. A 99, 187–210.
Götz, K. G. (1987). Course-control, metabolism and wing interference during ultralong tethered flight in Drosophila Melanogaster. J. Exp. Biol. 128, 35–46.
Götz, K. G., Hengstenberg, B., and Biesinger, R. (1979). Optomotor control of wing beat and body posture in Drosophila. J. Comp. Physiol. 35, 101–112.
Haag, J., and Borst, A. (2001). Recurrent network interactions underlying flow-field selectivity of visual interneurons. J. Neurosci. 21, 5685–5692.
Haag, J., and Borst, A. (2007). Reciprocal inhibitory connections within a neural network for rotational optic-flow processing. Front. Neurosci. 1:1. doi: 10.3389/neuro.01.1.1.008.2007
Haag, J., and Borst, A. (2008). Electrical coupling of lobula plate tangential cells to a heterolateral motion-sensitive neuron in the fly. J. Neurosci. 28, 14435–14442.
Haag, J., Denk, W., and Borst, A. (2004). Fly motion vision is based on Reichardt detectors regardless of the signal-to-noise ratio. Proc. Natl. Acad. Sci. U.S.A. 101, 16333–16338.
Haag, J., Vermeulen, A., and Borst, A. (1999). The intrinsic electrophysiological characteristics of fly lobula plate tangential cells: III. Visual response properties. J. Comput. Neurosci. 7, 213–234.
Haag, J., Wertz, A., and Borst, A. (2007). Integration of lobula plate output signals by DNOVS1, an identified premotor descending neuron. J. Neurosci. 27, 1992–2000.
Hardie, R. C. (1979). Electrophysiological analysis of fly retina. I: comparative properties of R1-6 and R7 and 8. J. Comp. Physiol. A 129, 19–33.
Hartenstein, V. (2006). “The muscle pattern of Drosophila,” in Muscle Development in Drosophila, ed. H. Sink (Berlin, NY: Springer-Verlag), 8–27.
Hausen, K. (1976). Functional characterization and anatomical identification of motion sensitive neurons in the lobula plate of the blowfly Calliphora erythrocephala. Z. Naturforsch. 31, 629–633.
Hausen, K. (1981). Monocular and binocular computation of motion in the lobula plate of the fly. Verh. Dtsch. Zool. Ges. 74, 49–70.
Hausen, K., and Wehrhahn, C. (1990). Neural circuits mediating visual flight control in flies. II. Separation of two control systems by microsurgical brain lesions. J. Neurosci. 10, 351–360.
Heisenberg, M. (1972). Comparative behavioral studies on two visual mutants of Drosophila. J. Comp. Physiol. A 80, 119–136.
Heisenberg, M., and Buchner, E. (1977). The role of retinula cell types in visual behavior of Drosophila melanogaster. J. Comp. Physiol. A 117, 127–162.
Heisenberg, M., Wonneberger, R., and Wolf, R. (1978). Optomotor-blindH31 – a Drosophila mutant of the lobula plate giant neurons. J. Comp. Physiol. A 124, 287–296.
Hengstenberg, R., Sandeman, D. C., and Hengstenberg, B. (1986). Compensatory head roll in the blowfly Calliphora during flight. Proc. R. Soc. Lond. B Biol. Sci. 227, 455–482.
Hengstenberg, R. (1991). Gaze control in the blowfly Calliphora: a multisensory, two-stage integration process. Semin. Neurosci. 3, 19–29.
Hennig, P., Kern, R., and Egelhaaf, M. (2011). Binocular integration of visual information: a model study on naturalistic optic flow processing. Front. Neural Circuits 5:4. doi: 10.3389/fncir.2011.00004
Horstmann, W., Egelhaaf, M., and Warzecha, A. K. (2000). Synaptic interactions increase optic flow specificity. Eur. J. Neurosci. 12, 2157–2165.
Huston, S. J., and Krapp, H. G. (2008). Visuomotor transformation in the fly gaze stabilization system. PLoS Biol. 6, 119–136. doi: 10.1371/journal.pbio.0060173
Huston, S. J., and Krapp, H. G. (2009). Nonlinear integration of visual and haltere inputs in fly neck motor neurons. J. Neurosci. 29, 13097–13105.
Joesch, M., Plett, J., Borst, A., and Reiff, D. F. (2008). Response properties of motion-sensitive visual interneurons in the lobula plate of Drosophila melanogaster. Curr. Biol. 18, 368–374.
Joesch, M., Schnell, B., Raghu, S. V., Reiff, D. F., and Borst, A. (2010). ON and OFF pathways in Drosophila motion vision. Nature 468, 300–304.
Kern, R., and Egelhaaf, M. (2000). Optomotor course control in flies with laragely asymmetric visual input. J. Comp. Physiol. A 186, 45–55.
Kern, R., van Hateren, J. H., and Egelhaaf, M. (2006). Representation of behaviourally relevant information by blowfly motion-sensitive visual interneurons requires precise compensatory head movements. J. Exp. Biol. 209, 1251–1260.
Kien, J., and Land, M. F. (1978). The fast phase of optokinetic nystagmus in the locust. Phys. Entomol. 3, 53–57.
Krapp, H. G. (1999). Neuronal matched filters for optic flow processing in flying insects. Int. Rev. Neurobiol. 44, 93–120.
Krapp, H. G., and Hengstenberg, R. (1997). A fast stimulus procedure to determine local receptive field properties of motion-sensitive visual interneurons. Vision Res. 37, 225–234.
Krapp, H. G., Hengstenberg, R., and Egelhaaf, M. (2001). Binocular contributions to optic flow processing in the fly visual system. J. Neurophysiol. 85, 724–734.
Krishnan, P., Duistermars, B. J., and Frye, M. A. (2011). Odor identity influences tracking of temporally patterned plumes in Drosophila. BMC Neurosci. 12, 62. doi: 10.1186/1471-2202-12-62
Kurtz, R., Warzecha, A. K., and Egelhaaf, M. (2001). Transfer of visual motion information via graded synapses operates linearly in the natural activity range. J. Neurosci. 21, 6957–6966.
Lappe, M., Bremmer, F., and van den Berg, A. V. (1999). Perception of self-motion from visual flow. Trends Cogn. Sci. (Regul. Ed.) 3, 329–336.
Liske, E. (1977). The influence of head position on the flight behaviour of the fly. Calliphora erythrocephala. J. Insect Physiol. 23, 375–379.
Mamiya, A., Straw, A. D., Tomasson, E., and Dickinson, M. H. (2011). Active and passive antennal movements during visually guided steering in flying Drosophila. J. Neurosci. 31, 6900–6914.
Mayer, M., Vogtmann, K., Bausenwein, R., Wolf, R., and Heisenberg, M. (1988). Flight control during ‘free yaw turns’ in Drosophila melanogaster. J. Comp. Physiol. A 163, 389–399.
Milde, J. J., and Strausfeld, N. J. (1990). Cluster organization and response characteristics of the giant fiber pathway of the blowfly Calliphora erythrocephala. J. Comp. Neurol. 294, 59–75.
Mronz, M., and Lehmann, F. O. (2008). The free-flight response of Drosophila to motion of the visual environment. J. Exp. Biol. 211, 2026–2045.
Otsuna, H., and Ito, K. (2006). Systematic analysis of the visual projection neurons of Drosophila melanogaster. I. Lobula-specific pathways. J. Comp. Neurol. 497, 928–958.
Paulk, A., and Gilbert, C. (2006). Proprioceptive encoding of head position in the black soldier fly, Hermetia illucens (L.) (Stratiomyidae). J. Exp. Biol. 209, 3913–3924.
Paulus, W. M., Straube, A., and Brandt, T. H. (1984). Visual stabilization of posture. Brain 107, 1143–1163.
Pick, B. (1976). Visual pattern discrimination as an element of the fly’s orientation behaviour. Biol. Cybern. 23, 171–180.
Preuss, T., and Hengstenberg, R. (1992). Structure and kinematics of the prosternal organs and their influence on head position in the blowfly Calliphora erythrocephala Meig. J. Comp. Physiol. A 171, 483–493.
Ready, D. F., Hanson, T. E., and Benzer, S. (1976). Development of the Drosophila retina, a neurocrystalline lattice. Dev. Biol. 53, 217–240.
Reiser, M. B., and Dickinson, M. H. (2008). A modular display system for insect behavioral neuroscience. J. Neurosci. Methods 167, 127–139.
Rister, J., Pauls, D., Schnell, B., Ting, C. Y., Lee, C. H., Sinakevitch, I., Morante, J., Strausfeld, N. J., Ito, K., and Heisenberg, H. (2007). Dissection of the peripheral motion channel in the visual system of Drosophila melanogaster. Neuron 56, 155–170.
Sandeman, D. C., and Markl, H. (1980). Head movements in flies (Calliphora) produced by deflexion of the halteres. J. Exp. Biol. 85, 43–60.
Sanes, J. R., and Zipursky, S. L. (2010). Design principles of insect and vertebrate visual systems. Neuron 66, 15–36.
Schilstra, C., and van Hateren, J. H. (1998). Stabilizing gaze in flying blowflies. Nature 395, 654.
Schnell, B., Joesch, M., Forstner, F., Raghu, S. V., Otsuna, H., Ito, K., Borst, A., and Reiff, D. F. (2010). Processing of horizontal optic flow in three visual interneurons of the Drosophila brain. J. Neurophysiol. 103, 1646–1657.
Scott, E. K., Raabe, T., and Luo, L. (2002). Structure of the vertical and horizontal system neurons of the lobula plate in Drosophila. J. Comp. Neurol. 454, 470–481.
Sherman, A., and Dickinson, M. H. (2004). Summation of visual and mechanosensory feedback in Drosophila flight control. J. Exp. Biol. 207, 133–142.
Strausfeld, N. J., and Bassemir, U. K. (1985a). The organization of giant horizontal-motion-sensitive neurons and their synaptic relationships in the lateral deutocerebrum of Calliphora erythrocephala and Musca domestica. Cell and Tissue Res. 242, 531–550.
Strausfeld, N. J., and Bassemir, U. K. (1985b). Lobula plate and ocellar interneurons converge onto a cluster of descending neurons leading to neck and leg motor neuropil in Calliphora erythrocephala. Cell Tissue Res. 240, 617–640.
Strausfeld, N. J., and Gronenberg, W. (1990). Descending neurons supplying the neck and flight motor of diptera: organization and neuroanatomical relationships with visual pathways. J. Comp. Neurol. 302, 954–972.
Strausfeld, N. J., Kong, A., Milde, J. J., Gilbert, C., and Ramaiah, L. (1995). Oculomotor control in calliphorid flies: GABAergic organization in heterolateral inhibitory pathways. J. Comp. Neurol. 361, 298–320.
Strausfeld, N. J., and Okamura, J. K. (2007). Visual system of calliphorid flies: organization of optic glomeruli and their lobula complex efferents. J. Comp. Neurol. 500, 166–188.
Strausfeld, N. J., and Seyan, H. S. (1985). Convergence of visual, haltere, and prosternal inputs at neck motor neurons of Calliphora erythrocephala. Cell Tissue Res. 240, 601–615.
Strausfeld, N. J., Seyan, H. S., and Milde, J. J. (1987). The neck motor system of the fly Calliphora erythrocephala. J. Comp. Physiol. A 160, 205–224.
Tammero, L. F., Frye, M. A., and Dickinson, M. H. (2004). Spatial organization of visuomotor reflexes in Drosophila. J. Exp. Biol. 207, 113–122.
Tang, S., and Juusola, M. (2010). Intrinsic activity in the fly brain gates visual information during behavioral choices. PLoS ONE 5, e14455. doi: 10.1371/journal.pone.0014455
Theobald, J. C., Ringach, D. L., and Frye, M. A. (2010). Dynamics of optomotor responses in Drosophila to perturbations in optic flow. J. Exp. Biol. 213, 1366–1375.
Tuthill, J. C., Chiappe, M. E., and Reiser, M. B. (2011). Neural correlates of illusory motion perception in Drosophila. Proc. Natl. Acad. Sci. U.S.A. 108, 9685–9690.
van Hateren, J. H., Kern, R., Schwerdtfeger, G., and Egelhaaf, M. (2005). Function and coding in the blowfly H1 neuron during naturalistic optic flow. J. Neurosci. 25, 4343–4352.
Warzecha, A. K., and Egelhaaf, M. (2000). Response latency of a motion-sensitive neuron in the fly visual system: dependence on stimulus parameters and physiological conditions. Vision Res. 40, 2973–2983.
Wehrhahn, C. (1981). Fast and slow flight torque responses in flies and their possible role in visual orientation behaviour. Biol. Cybern. 40, 213–221.
Wehrhahn, C., and Hausen, K. (1980). How is tracking and fixation accomplished in the nervous system of the fly? Biol. Cybern. 38, 179–186.
Wertz, A., Borst, A., and Haag, J. (2008). Nonlinear integration of binocular optic flow by DNOVS2, a descending neuron of the fly. J. Neurosci. 28, 3131–3140.
Wunderlich, K., Schneider, K. A., and Kastner, S. (2005). Neural correlates of binocular rivalry in the human lateral geniculate nucleus. Nat. Neurosci. 8, 1595–1602.
Zanker, J. M. (1988). How does lateral abdomen deflection contribute to flight control of Drosophila melanogaster? J. Comp. Physiol. A 162, 581–588.
Zanker, J. M., Egelhaaf, M., and Warzecha, A. K. (1991). On the coordination of motor output during visual flight control of flies. J. Comp. Physiol. A 169, 127–134.
Zaretsky, M., and Rowell, C. H. (1979). Saccadic suppression by corollary discharge in the locust. Nature 280, 583–585.
Zhu, Y., Nern, A., Zipursky, S. L., and Frye, M. A. (2009). Peripheral visual circuits functionally segregate motion and phototaxis behaviors in the fly. Curr. Biol. 19, 613–619.
Appendix
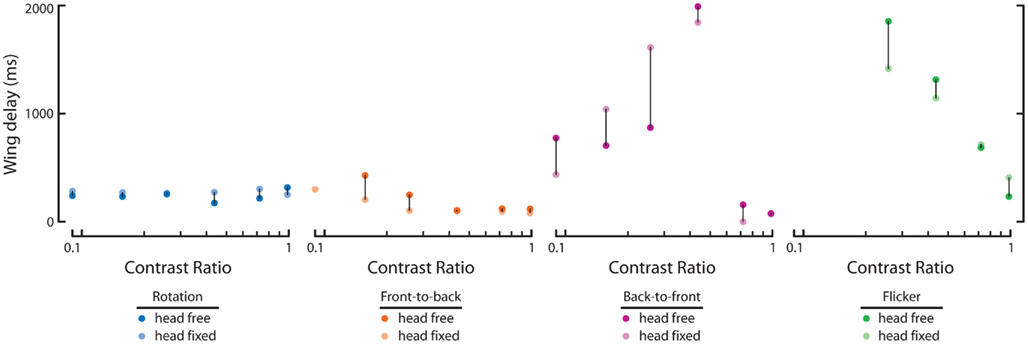
Figure A1. L–R response delays between experiments with “head-free” and “head-fixed” flies. Plotted here, for each of the four conditions in Figures 3 and 4, is the wing response delays, as calculated in Figure 2, of “head-free” (dark dots) and “head-fixed” (light dots) flies in response to rotation (blue), front-to-back motion (orange), back-to-front motion (magenta), and flicker (green). Dark lines connecting dark and light dots indicate the magnitude of the difference. Responses where wing turning did not rise above the set threshold (see Figure 5A) are not shown.
Keywords: vision, contralateral, self-motion, sensory–motor, head movement, insect flight
Citation: Duistermars BJ, Care RA and Frye MA (2012) Binocular interactions underlying the classic optomotor responses of flying flies. Front. Behav. Neurosci. 6:6. doi: 10.3389/fnbeh.2012.00006
Received: 23 August 2011; Accepted: 08 February 2012;
Published online: 23 February 2012.
Edited by:
Martin Giurfa, CNRS – Université Paul Sabatier-Toulouse III, FranceReviewed by:
Andrew D. Straw, Research Institute of Molecular Pathology, AustriaRoland Kern, University of Bielefeld, Germany
Copyright: © 2012 Duistermars, Care and Frye. This is an open-access article distributed under the terms of the Creative Commons Attribution Non Commercial License, which permits non-commercial use, distribution, and reproduction in other forums, provided the original authors and source are credited.
*Correspondence: Mark A. Frye, Howard Hughes Medical Institute, University of California Los Angeles, Terasaki Life Sciences, 610 Charles Young Dr. East, Los Angeles, CA 90095-7239, USA. e-mail: frye@ucla.edu