Optical mapping of release properties in synapses
- 1 Department of Biochemistry, Weill Cornell Medical College, New York, NY, USA
- 2 David Rockefeller Graduate Program, The Rockefeller University, New York, NY, USA
Synapses are important functional units that determine how information flows through the brain. Understanding their biophysical properties and the molecules that underpin them is an important goal of cellular neuroscience. Thus, it is of interest to develop protocols that allow easy measurement of synaptic parameters in model systems that permit molecular manipulations. Here, we used a sensitive and high-time resolution optical approach that allowed us to characterize two functional parameters critical to presynaptic efficacy: vesicle fusion probability (Pv) and readily-releasable pool size (RRP). We implemented two different approaches to determine the RRP size that were in broad agreement: depletion of the RRP by high-frequency stimulation and saturation of the calcium sensor during single action potential stimuli. Our methods are based on reporters that provide a robust, quantitative, purely presynaptic readout and present a new avenue to study molecules that affect synaptic vesicle exocytosis.
Introduction
Information flow in the brain is controlled in part by modulating the efficacy of synaptic transmission. Therefore, estimating parameters that impinge on this efficacy is of great interest to gain a deeper understanding of brain function. Here, we developed a high time resolution presynaptic optical approach to measure key biophysical parameters of the neurotransmitter release machinery at central nervous system synapses.
Within the conceptual framework of the quantal hypothesis of neurotransmitter release, an important presynaptic variable is the number of vesicles (N) that fuse with the plasma membrane in response to one action potential (AP). Assuming vesicles are uniform and exocytose independently of each other, the average N will be determined by the size of the readily-releasable pool of synaptic vesicles (RRP) and the probability that a vesicle in that pool will undergo exocytosis in response to a single action potential (Pv) (Schneggenburger et al., 2002):

A closely related parameter is the release probability (Pr) which is the probability that a single AP will release at least one vesicle in the RRP or, equivalently, that the synapse will not fail (N > 0). Under a binomial model consistent with the aforementioned assumptions, Pr will be set by Pv and RRP:

Our experimental approach relied on a form of green fluorescent protein (pHluorin, Miesenbock et al., 1998) tagged to the vesicular glutamate transporter vGlut-1 (vG-pH, Voglmaier et al., 2006), whose fluorescence increases ∼20-fold when synaptic vesicles fuse with the plasma membrane (Sankaranarayanan et al., 2000). This technique is sufficiently sensitive to measure single AP responses (Granseth et al., 2006; Balaji and Ryan, 2007). To obtain estimates of exocytosis properties we found that a key requirement was to improve the time resolution of this approach to 10 ms. Using this high-speed imaging we developed and validated protocols for determining Pv and RRP size.
By using purely presynaptic methods that are unaffected by neurotransmitter diffusion, clearance, and postsynaptic receptor kinetics, we hope to simplify the study of synaptic vesicle exocytosis. In combination with standard molecular and pharmacological manipulations these methods should provide a potent new way to test hypotheses of molecular factors affecting neurotransmitter release.
Materials and Methods
Cell Culture and Optical Setup
Hippocampal CA3–CA1 regions were dissected from 1- to 3-day-old Sprague Dawley rats, dissociated, and plated onto polyornithine-coated glass as described previously (Ryan, 1999). vG-pH was transfected using calcium phosphate precipitation 8 days after plating and imaging was performed 13–25 days after plating. Due to the low transfection efficiency there was only one or a few well separated transfected cell bodies per dish. Thus, the boutons imaged in each experiment belong to a single cell. The coverslips were mounted in a rapid-switching, laminar-flow perfusion and stimulation chamber (volume ∼75 μl) on the stage of a custom-built laser-illuminated epifluorescence microscope. Live-cell images were acquired with an Andor iXon+ (model #DU-897E-BV) back-illuminated electron-multiplying charge-coupled device camera. An Ar+ ion or solid-state diode pumped 488 nm laser was shuttered using acousto-optic modulation. Fluorescence excitation and collection was through a 40× 1.3 NA Fluar Zeiss objective using 515–560 nm emission and 510 nm dichroic filters (Chroma) and a 1.6× Optivar. Laser power at the back aperture was ∼3 mW. Action potentials were evoked by passing 1-ms current pulses, yielding fields of ∼10 V/cm via platinum-iridium electrodes. Experiments in Figures 1 and 2 were performed at room temperature (∼28–32°C in stimulation chamber), for all others the temperature was clamped at 30.0 ± 0.1°C. Cells were continuously perfused at 0.2–1.0 ml/min. in a saline solution containing (in mM) 119 NaCl, 2.5 KCl, 2 CaCl2, 2 MgCl2, 25 HEPES, buffered to pH 7.4, 30 glucose, 10 μM 6-cyano-7- nitroquinoxaline-2,3-dione (CNQX), and 50 μM D,L-2-amino-5-phosphonovaleric acid (AP5). All chemicals were obtained from Sigma except for bafilomycin (Calbiochem), calcium channel toxins (Alomone Labs) and calcium dyes (Invitrogen). For solutions with different Ca2+ concentrations in the 1–4 mM range, we substituted Mg2+ to maintain a constant divalent concentration. For 10 mM Ca2+ we reduced the concentration of glucose to maintain constant osmolarity. For 18 mM Ca2+ we also reduced the concentration of HEPES to the same end. Cells were only exposed to different Ca2+ solutions for ∼15–30 s necessary to acquire data. For experiments in the presence of 4-aminopyridine (4-AP), we repeatedly stimulated with 1 AP and only analyzed the responses once their amplitude was stable over several trials. A subset of cells showed no effect of 4-AP (<10% of all experiments) and were excluded from further analysis. For 4-AP experiments with 4 mM external calcium we incubated the cells in 4-AP continuously with standard external calcium (2 mM) and only increased the calcium concentration for the ∼15–30 s necessary for imaging. Due to the low baseline fluorescence of neurons that express vG-pH (Balaji and Ryan, 2007), we gave brief bursts with 6 APs at 33 Hz every 4 s to find transfected cells in a dish. Cells were allowed to rest 10 min after identification with 33 Hz stimuli, at least 30 s between 1 AP trials and at least 5 min between 100 Hz AP bursts. Data was acquired at 100 Hz by integrating for 9.74 ms in frame transfer mode and restricting imaging to a subarea of the CCD chip. The maximum width of the imaged field was 167 pixels (41.75 μm).
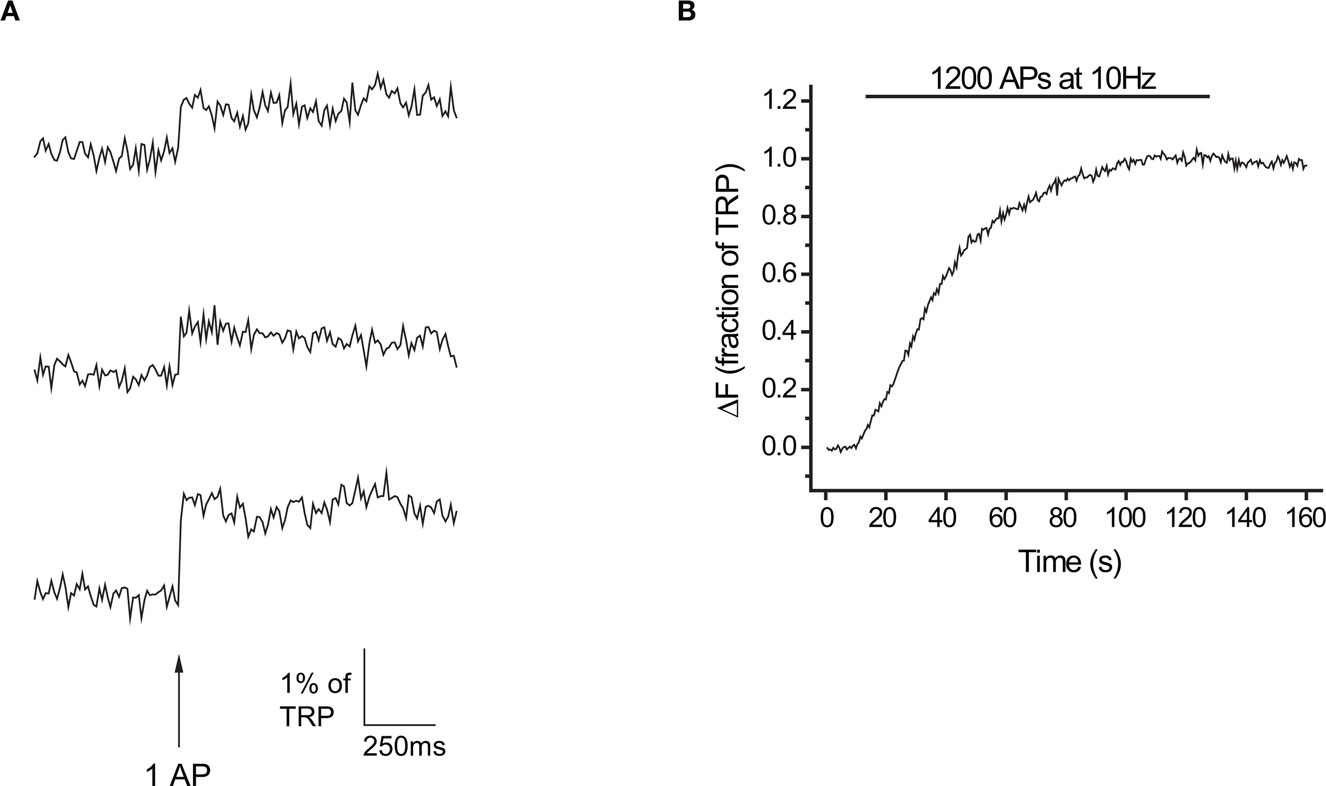
Figure 1. Exocytosis in response to 1 AP measured at 10 ms time resolution with vG-pH. (A) Representative traces of a neuron’s response to 1 AP (n = 25 synapses). (B) Response to 1200 APs at 10 Hz in the presence of Baf for the same neuron.
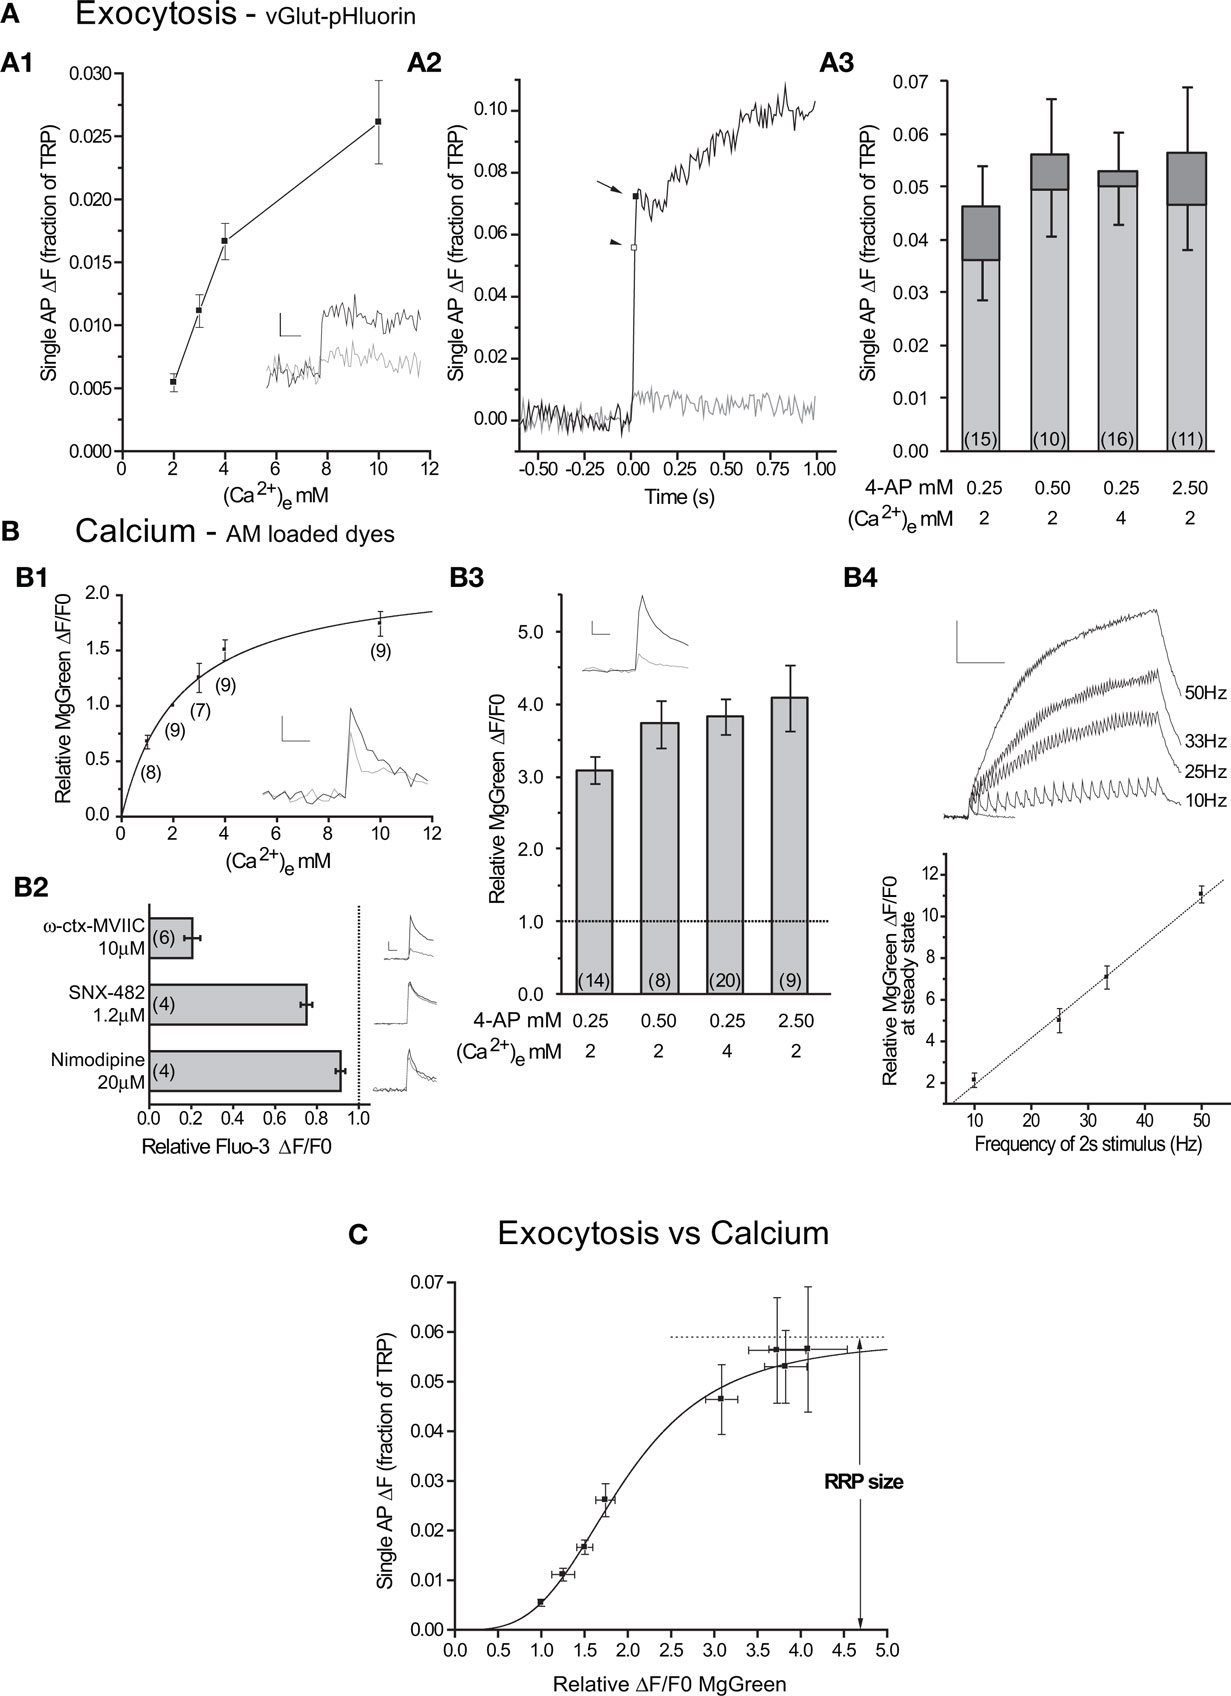
Figure 2. Single APs cause exocytosis of the entire RRP in conditions with large intracellular calcium increases. (A1) Exocytosis in response to 1 AP as a function of extracellular calcium (n = 14 cells). Inset: representative individual trials at 2 mM (gray) and 4 mM (black) from one cell. Scale bar = 1% of TRP, 100 ms. (A2) Representative experiment showing responses to a single AP under control conditions (2 mM external calcium, gray) and with 2.5 mM 4-AP (black). Note the presence of fast (arrow) and slow subcomponents of delayed release after the end of stimulus-locked exocytosis (arrowhead). n = 7 and 3 trials for control and 4-AP respectively. (A3) Average responses to single APs under different 4-AP and extracellular calcium conditions. The bars show the stimulus-locked (light gray) and fast delayed (dark gray) components of exocytosis with their SEs. (B1) Average relative peak ΔF/F0 as a function of external calcium across several experiments. The line is a fit (to the measurements) by a single site binding model (equation (4), Km = 2.3 ± 0.4 mM, Rmax = 2.2 ± 0.2). Inset: responses to 1 AP at 2 mM (gray) and 4 mM (black) in a representative experiment (n = 4 trials each). (B2) Effects of calcium channel toxins on single AP responses measured with Fluo-3 AM. Beside each column there is an average control (black) and toxin (red) trace from a representative experiment (n = 3–5 trials each). Scale bar = 20% ΔF/F0, 50 ms (B3) Increases in intracellular calcium concentration in response to 1 AP relative to control in different 4-AP and extracellular calcium conditions. Inset: response to control (gray, n = 5 trials) and 4-AP (black, n = 13 trials) from a representative experiment with 2.5 mM 4-AP. Scale bar = 2% ΔF/F0, 50 ms. (B4) Top: representative experiment showing responses to 1 AP (blue) and 2 s stimuli at 10, 25, 33 and 50 Hz (black). Scale bar = 10% ΔF/F0, 0.5 s. Traces are averages of 3 trials for 2 s stimuli and 13 trials for the 1 AP stimulus. Bottom: average steady state ΔF/F0 at the end of 2 s stimuli of varying frequencies (n = 4 experiments). Responses are normalized to the single AP peak in each experiment. Line shows fit (P < 0.001, R2= 0.995). (C) Exocytosis as a function of the relative increase in internal calcium concentration (n = 10–16 vG-pH experiments, n = 9–20 MgGreen experiments). The line shows the fit to a generalized Hill model (Eq. 3, RRP = 5.9 ± 0.7% of TRP, n = 3.4 ± 0.4, K = 1.9 ± 0.2).
Image and Data Analysis of vG-pH Experiments
Images were analyzed in ImageJ1 using a custom-written plugin2. Two micrometer diameter circular ROIs were placed on all varicosities that did not split or merge, were stably in focus throughout all trials and responded to a maximal stimulus at the end of the experiment. To estimate 1 AP ΔFs, we took the difference between the average 10 frames before the stimulus and 10 frames after the stimulus. The rise in vG-pH fluorescence in response to a single AP always took two frames when acquiring at 100 Hz time resolution. A subset of the data in Figure 2A1 was acquired at 2 Hz imaging with 200 ms integration and the 1 AP ΔF was calculated as a point to point difference. At the end of each experiment we measured the response to 1200 APs at 10 Hz in bafilomycin at 2 Hz temporal resolution.
For experiments where we stimulated at 100 Hz in 4 mM external calcium, we calculated the frame at which each AP fired taking into account the two frame rise time for the first AP. Independent experiments with varying numbers of APs at 100 Hz confirmed that each AP took place at the expected frame (not shown). After the end of stimulation, there was an additional slower rise in fluorescence. Operationally, we defined exocytosis that occurred up to and including the last frame of the stimulus period as “stimulus-locked” and all later rises as “delayed”. The end of delayed exocytosis was set when the fluorescence stopped rising. Trials with 20 APs at 100 Hz were repeated at least four times. To determine objectively from 100 Hz bursts the size of the RRP, in each cell we used an automated method that searched for plateaus in the ΔF response where the fluorescence did not rise significantly. Sliding data windows of increasing size were used to fit a linear model to the cumulative ΔF vs AP number data. For example, 3 point data windows were used to fit cumulative ΔF vs AP number between 3 and 5 APs, 4 and 6 APs and so forth up to 18 to 20 APs. Analogously, 4 point data windows were used to fit cumulative ΔF vs AP number between 3 and 6 APs, 4 and 7 APs and so forth up to 17 to 20 APs. This procedure was repeated up to a 18 point fitting window for the ΔF vs AP number data between 3 and 18 APs. For each of the fits, we tested whether the slope was statistically significant (greater than 0) at α = 0.05 (Sokal and Rohlf, 1994). A plateau representing the RRP size was identified as the largest window where the slope of ΔF vs AP number was not significant. If there was more than one window of the same size where this condition was met, we picked the one corresponding to the lowest AP numbers. To determine the RRP size, we averaged the ΔF values within the identified window. On average, these windows where fluorescence did not rise were located between the 8th (range = 3–14) and the 14th AP (8–20) in the 100 Hz train.
Individual APs in the presence of 4-AP caused both a stimulus-locked component of exocytosis and the appearance of an additional delayed component. Typically, the latter had much slower kinetics but in some cases it could be further classified into a fast and a slow subcomponent. The fast subcomponent was similar in rate of rise to stimulus-locked exocytosis, while the other subcomponent was noticeably slower (see Figure 2A2 for an example with and Figure 4A2 for an example without this fast delayed subcomponent). The end of the fast delayed subcomponent of exocytosis was set at the inflection point where the rate of rise of the fluorescence slowed. Because stimulus-locked exocytosis and the fast subcomponent of delayed release were kinetically similar and distinct from the slow subcomponent of the latter, we took the sum as a measure of fast exocytosis in response to 1 AP.
To estimate the RRP size from single AP data (Figure 2C), we used a generalized Hill model that relates exocytosis (Exo) and the relative increase in intracellular calcium (rCai):

We estimated Exo from vG-pH ΔF measurements (using the fast exocytosis estimate if applicable) and rCai from Magnesium Green (MgGreen) relative ΔF/F0 measurements (see below). n, K and RRP were fit using a Levenberg-Marquardt optimization procedure with data points weighted inversely by their error bars (Origin 7.0, OriginLab).
To estimate how precisely we could determine Pv and RRP size in each cell (Figures 3E and 5B), we used a standard formula to propagate the errors arising from fluctuations in our traces (Taylor, 1997):
if q ≡ q(x,…,z)
then
To calculate Pv and RRP size with their errors, we relied on three traces from each cell:
F1: response to 1 AP (average of at least 10 trials)
F20: response to 20 APs at 100 Hz (average of at least 4 trials)
FBaf: response to 1200 APs at 10 Hz in bafilomycin
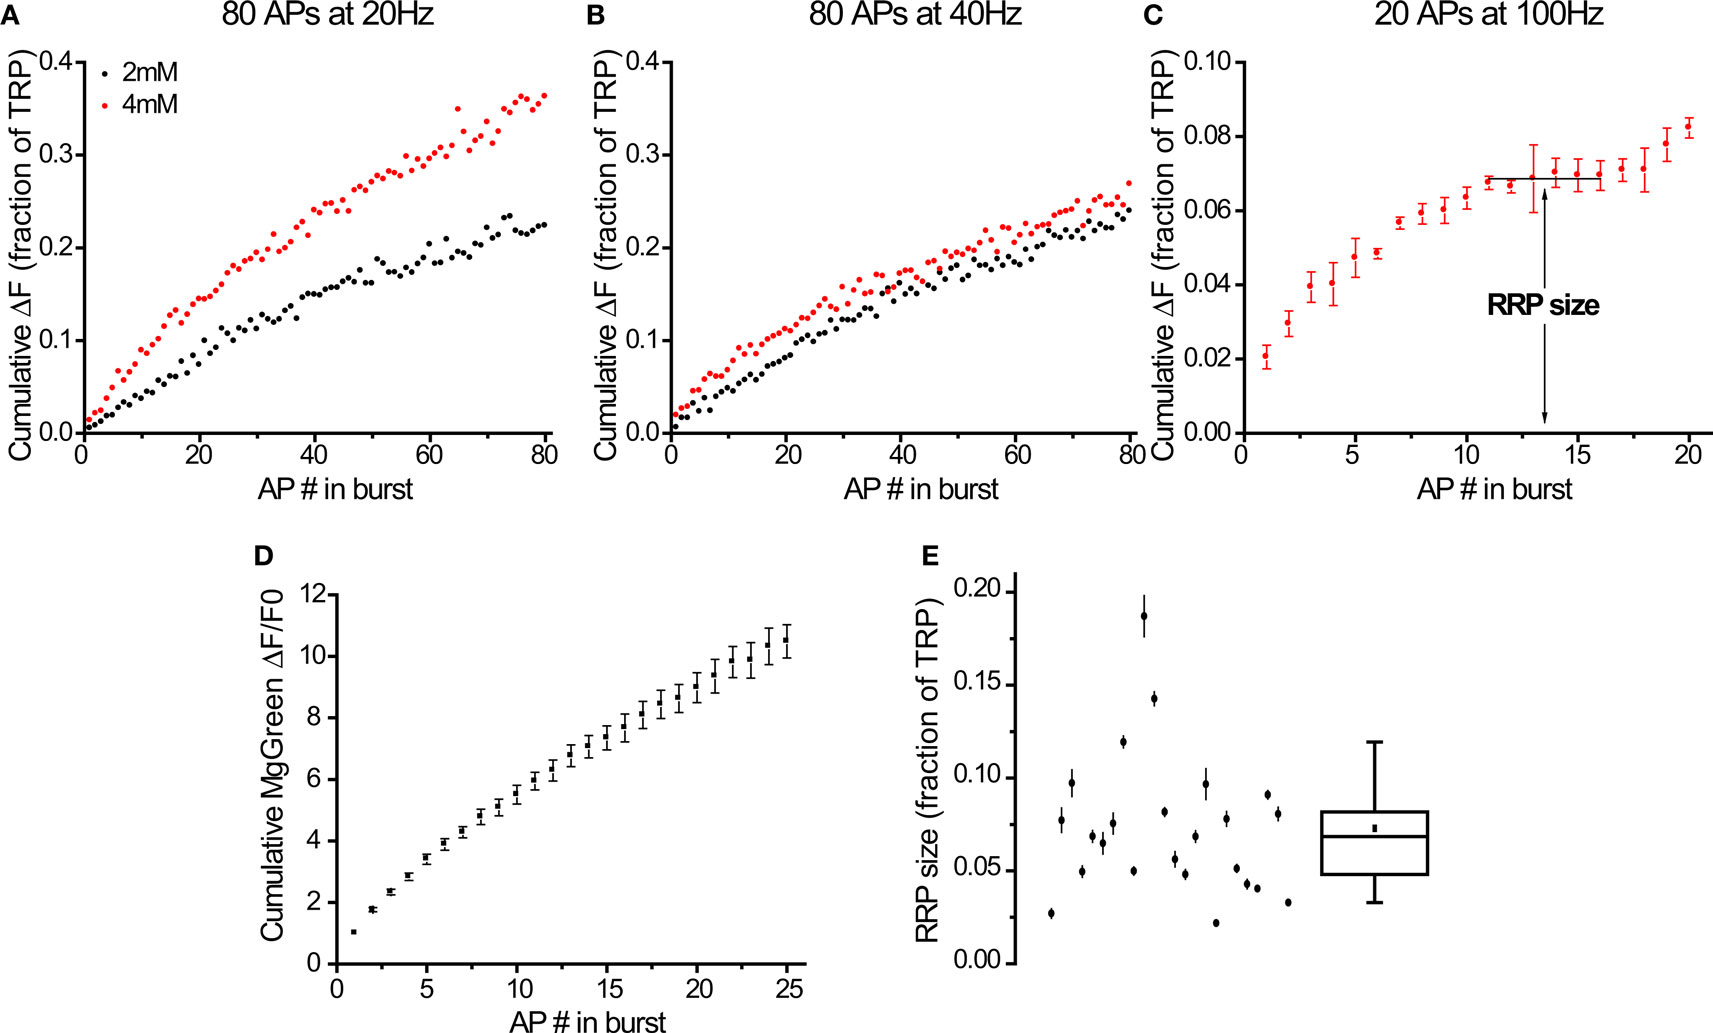
Figure 3. Bursts of action potentials at 100 Hz in 4 mM external calcium deplete the RRP after exocytosis of ∼7% of the TRP. (A–C) Responses to different stimuli in the same cell (average of 11 synapses). Responses to 20 (A) and 40 Hz (B) come from individual trials, response to 100 Hz burst (C) is the average of 4 trials. The plateau indicating the depletion of the RRP (C) was detected automatically (see Materials and Methods). (D) Calcium entry at 100 Hz, 4 mM (n = 6 experiments). Values normalized to first AP. (E) RRP size determined from 100 Hz bursts in 24 cells (see Materials and Methods for explanation of error bars). Box whisker plot shows the median (line), mean (point), 25–75 percentile (box) and 10–90 percentile (whisker) ranges.
To obtain the responses to 1 AP and 1200 APs at 10 Hz in bafilomycin we averaged the last 10 frames before the stimulus and the first 10 frames after the end of the stimulus. This gave us:
where the standard error in each case was the standard deviation of the 10 frames divided by the square root of 10. Based on these values, we calculated the responses to 1 AP and 1200 APs at 10 Hz in bafilomycin with their corresponding errors:
For the 20 AP traces we proceeded similarly, averaging the last 10 frames before the stimulus and the frames included in the plateau to obtain:
where the standard error was the standard deviation divided by the square root of the number of observations in each case (10 for F20pre and the number of points included in the plateau for F20plateau). Thus:

In addition to these instrumental errors, given that we measured the responses to 20 APs at 100 Hz at least four times in each experiment we also obtained a statistical estimate of the error in ΔF20plateau:
where SDΔF20plateau,stat is the standard deviation of the plateau estimates in different trials (n at least 4). We added the instrumental and statistical contributions to the error in quadrature and combined them to get the total error for ΔF20plateau:

Finally, we calculated RRP size and Pv with their associated errors:
These calculations provide the error bars in Figures 3E and 5B.
All other values with errors mentioned in the text are means and standard errors of the mean (SE). Unless stated otherwise, all error bars in the figures are SEs.
Calcium DYE Measurements and Analysis
MgGreen (Figures 2B1,B3,B4, and 3D) or Fluo-3 (Figure 2B2) were loaded at 20 μM in their acetoxymethyl ester (AM) form for 10 min and washed off for ∼30 min before experiments were started. Single AP stimuli led to robust, focal responses distributed over neuritic fields. We analyzed ΔF/F0 of manually drawn ROIs placed on these punctate responsive regions. F was corrected point to point by subtracting local background from manually drawn ROIs on adjacent non-responsive regions.
The data in Figure 2B1 were fit to a single site binding model using a Levenberg–Marquardt optimization procedure with data points weighted inversely by their error bars (Origin 7.0, OriginLab):

For experiments with 100 Hz stimulation in 4 mM external calcium (Figure 3D), we calculated the frame at which each AP fired in the same manner as for vG-pH (see above) confirming separately that the each AP took place at the expected frame (not shown).
Results
There are two key requirements to determine Pv and RRP size. The first is a measurement system with sufficient signal-to-noise to estimate precisely the response to a single AP. The second is an appropriate protocol to determine RRP size. The RRP was first defined for secretory systems as the pool of vesicles that are kinetically privileged and upon stimulation are the first to undergo exocytosis (Sorensen, 2004). The practical definition of this pool therefore requires the ability to detect distinct kinetic phases in exocytosis during a stimulus in ways that will not be confounded by possible postsynaptic contributions to the signal. For synapses, it has generally been assumed that the RRP consists of vesicles that are docked at the plasma membrane and “primed”. Functionally, they represent vesicles in a biochemical state such that they are immediately accessible by AP stimulation and presumably await only calcium elevation to trigger their fast exocytosis. Therefore, to measure RRP size the key is to use stimuli that rapidly deplete this vesicle pool before it refills. At giant synapses, estimates of the RRP have been obtained using flash photolysis of caged calcium, prolonged calcium current activation and repetitive high-frequency stimulation (for review, see Sakaba et al., 2002) while in dissociated neurons in culture, acute hypertonic stimulation (with sucrose) has most frequently been used to deplete this pool (Rosenmund and Stevens, 1996). Although modest stimulation frequency (20 Hz for ∼2 s) has also been used, it is unclear if this always leads to appreciable depletion of the RRP and a debate has arisen regarding the extent to which the sucrose accessible pool corresponds to physiologically primed vesicles (Moulder and Mennerick, 2005; Stevens and Williams, 2007). We sought to compare and validate different approaches using our optical methods that are, by design, a strictly presynaptic measurement of exocytosis. Using high-frequency AP bursts and single APs under conditions that cause large intracellular calcium increases we looked for evidence of pool depletion in each case. To estimate Pv we divided the response to 1 AP in 2 mM external calcium (our standard condition) by our estimate of the RRP size (see Eq. 1).
Exocytosis Measured at High Time Resolution with vG-pH
Our exocytosis measurements were based on the sudden rise in pH of synaptic vesicles when they fuse with the plasma membrane. In dissociated rat hippocampal neurons in culture transfected with vG-pH, this rise in pH causes the fluorescence of the reporter to increase ∼20-fold (Sankaranarayanan et al., 2000; Voglmaier et al., 2006). Previously, we demonstrated that fluorescence increases in response to a single AP evoked by field stimulation can be reliably detected in our system using a 100-ms integration window with minimal bleaching or photodamage over several hours in the course of a typical experiment (Balaji and Ryan, 2007).
To faithfully estimate RRP sizes we needed high time resolution to distinguish between stimulus-locked and delayed components of exocytosis expected after large stimuli. Furthermore, since the depression of release during a burst is used as a sign of RRP depletion, we had to image quickly enough to precisely quantify exocytosis in response to each AP within a stimulus train. At the same time, to estimate Pv we required adequate signal-to-noise to detect responses to single action potentials. After some preliminary tests, we selected a ∼10-ms integration window, imaging continuously at 100 Hz. Under these conditions, the signal-to-noise ratio at individual boutons for single trials is quite low. However, by averaging over many boutons from a single neuron, we measured responses to individual APs with excellent signal-to-noise at high time resolution (SNR > 5 for examples shown in Figure 1A). We routinely performed >1-h long experiments with minimal bleaching or drift in cell responsiveness. To calibrate our signals as a fraction or percentage of the total releasable pool (TRP) we applied a maximally depleting stimulus (1200 APs at 10 Hz) in the presence of the V-ATPase H+ pump blocker bafilomycin (Baf, Figure 1B). Individual APs led to exocytosis of 0.54 ± 0.07% of the TRP (n = 14 cells).
Importantly, our data acquisition is fast enough that endocytosis is expected to have a negligible effect on the traces of single AP responses. We expect <0.01% decay of the peak amplitude in 100 ms, assuming τendo∼14 s and τreacidification∼4 s (Atluri and Ryan, 2006; Granseth et al., 2006; Balaji and Ryan, 2007).
A Single AP That Causes a Large Increase in Intracellular Calcium Can Release the Entire RRP
Our first approach to measure the RRP size was to use single APs under conditions where sufficient calcium entered the synapse so as to saturate the calcium sensors on the vesicles (presumably synaptotagmin I molecules, for review see Chapman, 2008). Under these conditions, all vesicles in the RRP are expected to fuse synchronously. Whether these vesicles fuse separately (Abenavoli et al., 2002; Oertner et al., 2002; Conti and Lisman, 2003) or through compound fusion (Matthews and Sterling, 2008; He et al., 2009) does not affect our estimate of the RRP size as in both cases the compartments will alkalinize and the fluorescence of vG-pH will increase accordingly.
In order to increase the number of calcium ions that entered the synapse in response to 1 AP, we first chose to elevate extracellular calcium in the range from 2 mM to 10 mM. While increasing extracellular calcium 2-fold from 2 mM to 4 mM caused a 3-fold increase in exocytosis, the 2.5-fold increase between 4 mM to 10 mM only caused a ∼60% increase in exocytosis (Figure 2A1). This suggests that exocytosis as a function of external calcium is close to saturation at 10 mM and indeed, increasing external calcium concentration to 18 mM yielded only a ∼20% additional increase in exocytosis (exocytosis18mM = 3.1 ± 0.5% of TRP in 14 cells).
An important point that we wished to address was how changes in extracellular calcium concentrations affected relative increases in internal calcium concentrations in response to single APs. While the relationship can be assumed to be linear at low calcium concentrations, under the conditions used here that is not necessarily the case. In fact, in the calyx of Held giant synapse in the auditory brainstem, the relationship between relative calcium entry and extracellular calcium is not linear in the 2–10 mM range (Schneggenburger et al., 1999) and conforms to a model reflecting saturation of the flux through the pore of each calcium channel. To study this issue directly, we used the low affinity calcium indicator MgGreen AM to probe relative changes in intracellular calcium concentration in response to 1 AP as a function of extracellular calcium. Our results from MgGreen measurements are in good agreement with those from the calyx of Held and show that increases in intracellular calcium saturate as extracellular calcium is increased (Figure 2B1). This means that the saturation of exocytosis as a function of extracellular calcium in the 2–10 mM range is in large part due to saturation of the flux through the calcium channels and not necessarily to saturation of the calcium sensors on synaptic vesicles.
The use of an AM loaded calcium dye to determine presynaptic properties can be misleading as the indicator is taken up not only by axons and nerve terminals, but also by dendrites and spines which will be in the same field of view. Thus, it was necessary to determine whether the signals were mainly due to calcium entry through the N and P/Q calcium channels that drive presynaptic vesicle exocytosis (Meir et al., 1999). To test this we studied the effect of specific blockers of these and other channels on single AP responses. To enhance our signal-to-noise ratio and obtain more precise estimates of the degree of inhibition, we switched to the higher affinity calcium dye Fluo-3 AM and performed experiments with ω-conotoxin MVIIC 10 μM (N, P/Q- blocker), SNX-482 1.2 μM (R-type blocker) or Nimodipine 20 μM (L-type blocker) to test the contribution of different calcium channel subtypes to our responses (Figure 2B2). While all three inhibitors decreased responses to 1 AP (P < 0.05 in one tailed t-tests with null hypothesis μ = 1.0), the main contribution to the signal was from N and P/Q channels (∼80%). This gives us confidence that the response to different stimuli of AM loaded calcium dyes can be used to estimate relative increases in intracellular calcium in the presynaptic terminal.
To probe exocytosis in response to single APs under conditions of larger intracellular calcium increases we used 4-aminopyridine (4-AP), a potassium channel blocker that is expected to extend the duration of the AP and therefore increase the open time of calcium channels (Mathie et al., 1998). As predicted, applying 4-AP caused increases in intracellular calcium levels in response to 1 AP larger than those attainable by increasing extracellular calcium (Figure 2B3). Importantly, we verified that the response of the calcium dye itself remained linear in this measurement range (Figure 2B4). In the presence of 4-AP, exocytosis in response to 1 AP also increased beyond what was achieved by increasing the extracellular calcium concentration, confirming that the calcium sensors on the vesicles were previously not saturated, even at 10 mM external calcium (Figures 2A2,A3). 4-AP caused an increase in the stimulus-locked component of exocytosis and the appearance of delayed component, which could sometimes be further classified into a fast and a slow subcomponent (see Materials and Methods for more details). When there was a fast delayed subcomponent present, we added it to stimulus-locked response to obtain a measure of fast exocytosis after 1 AP. If there was no fast delayed subcomponent, we simply used the stimulus-locked response for analysis.
We combined our measurements of exocytosis in response to single action potentials under different conditions (Figures 2A1,A3) with those of relative increases in intracellular calcium under those same conditions (Figures 2B1,B3) to show how exocytosis varies with increasing internal calcium fluxes into the nerve terminal (Figure 2C). The data were well fit by a generalized Hill model – Eq. 3 – where the saturation value corresponds to an estimate of the size of the RRP (5.9 ± 0.7%). We also analyzed the data using only the stimulus-locked component of exocytosis (excluding the fast subcomponent of delayed release) and found that while the estimate of RRP size was ∼20% lower, the difference with the previous estimate was not statistically significant (RRP = 4.9 ± 0.6% of TRP).
High-Frequency Action Potential Bursts Deplete the RRP
Our second approach to measure the RRP size was to study exocytosis in response to high-frequency bursts of APs. In addition to validating our previous results, this type of protocol should be easier to use as it does not require multiple trials until a steady state is reached in the presence of a pharmacological agent (4-AP). We initially tried to measure the RRP by distinguishing a kinetically distinct component of exocytosis using 80 APs at 20 Hz (Figure 3A) or 40 Hz (Figure 3B) at 2 or 4 mM external calcium. Under these stimulation conditions we could not observe any obvious kinetic signature of depression expected from a rapid depletion of the RRP in any of the cells we tested (n = 10, see Figures 3A,B for a representative example). This was surprising given the widespread use of these protocols in the literature (Murthy and Stevens, 1998; Moulder and Mennerick, 2005; Stevens and Williams, 2007). We explore this apparent discrepancy further in the Section “Discussion”. While there was some gradual depression of responses during a stimulus train (Figures 3A,B), any estimate of the RRP size would have required fitting a refilling model to the data. This would introduce additional assumptions regarding both the general kind of model that would be appropriate and its parameters (for example, see Wesseling and Lo, 2002), neither of which we could validate. Due to these complications, we chose instead to increase the strength of the stimulus. We predicted that the larger increase in intracellular calcium would lead to a more rapid, clearly noticeable depression of exocytosis as a consequence of RRP depletion. After several tests, we found that increasing our stimulation frequency to 100 Hz and external calcium to 4 mM led to responses that showed clear evidence of distinct kinetic phases of exocytosis in all cells tested (see Figure 3C for a representative example). This protocol led to a rapid rise in fluorescence, followed by a plateau and then an additional increase that continued beyond the end of the stimulus period. We equated the RRP size with the amplitude of the plateau phase for each cell tested (see Materials and Methods for more details). This plateau typically began after 5–10 stimuli and indicated that the rate of exocytosis had dropped to zero. Presumably, under these circumstances all vesicles in the RRP have fused with the membrane and the refilling of that pool becomes the rate limiting step for further exocytosis. The additional rising phase after the plateau proceeded at a lower rate than the original burst (see Figure 3C and 4A1 for smaller and larger magnitudes respectively of this effect) and led to an additional fluorescence increase of 30 ± 4% (n = 24) over the plateau phase during the remaining stimuli. This rising phase is presumably a consequence of the RRP refilling process “catching up” and generating primed vesicles that quickly fuse with the membrane due to the elevated calcium prevalent inside the nerve terminals. After the end of stimulation, the slower release rate continued, resulting in additional delayed release (amplitude = 1.4 ± 0.1× RRP size, τ = 360 ± 40 ms, n = 24 cells). These kinetics probably reflect the complicated interplay of calcium decay, RRP refilling and decreasing exocytosis rates in the synapse after stimulation.
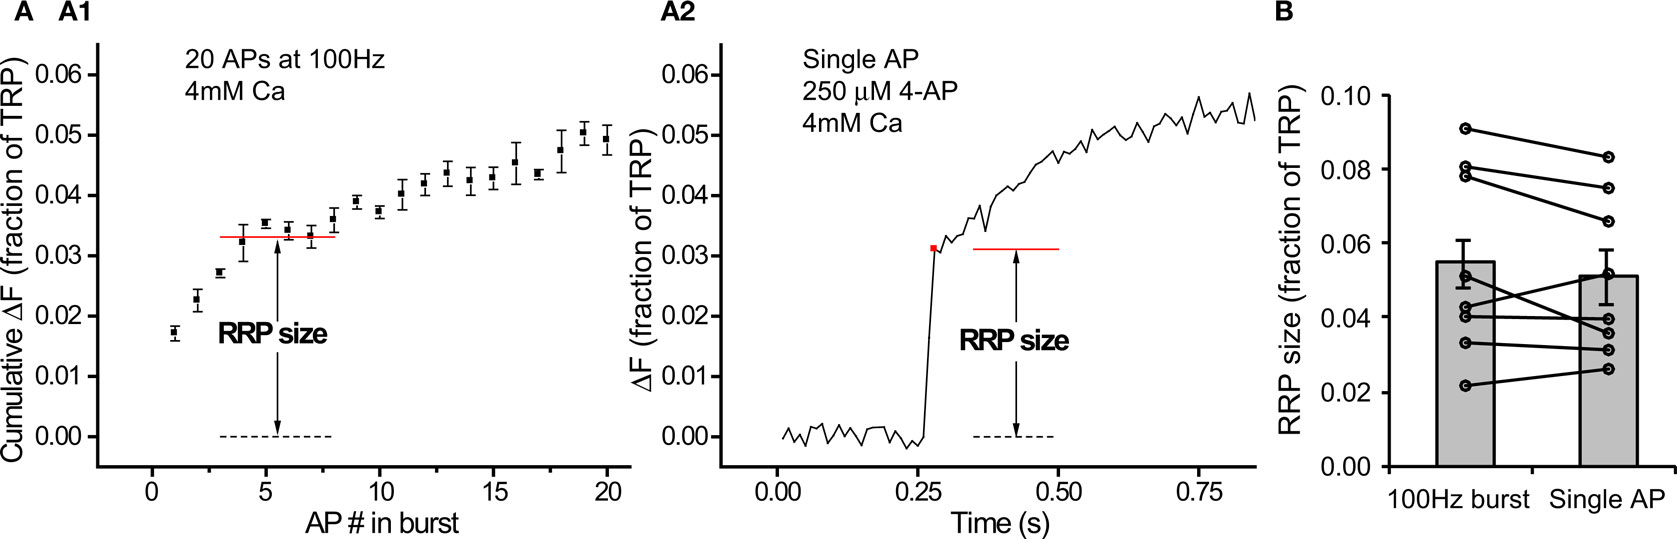
Figure 4. Different estimates of RRP size are consistent. (A) Example of a neuron (average of 30 synapses) where both methods were used to estimate RRP size (n = 4 trials for A1, n = 5 trials for A2). Note that the vertical scale on both graphs is the same. (B) RRP size determined from single APs in the presence of 250 μM 4-AP and 4 mM external calcium agrees with estimates from 100 Hz bursts (n = 8 cells).
An alternative explanation for the strong depression in exocytosis rates during 100 Hz bursts might be a decrease in calcium entry due to progressive inactivation of calcium channels (Xu and Wu, 2005). We tested this directly using MgGreen AM and found that the increase in internal calcium concentration shows no evidence of significant depression with increasing numbers of APs at 100 Hz in the range where exocytosis rates drop to zero (Figure 3D). Importantly, we applied tetrodotoxin (TTX) to confirm that the calcium signal during 100 Hz stimulation is due to action potentials as opposed to a passive effect of the field stimulation (responses in TTX dropped to 0 ± 1% and could be washed off to 94 ± 2% of the rise before treatment, n = 4). This strongly suggests that the saturation of stimulus-locked exocytosis during 100 Hz stimulation is due to depletion of vesicles from the RRP.
On average, the RRP size determined from these experiments was 7.3 ± 0.8% of the TRP (n = 24 cells). Notably, this parameter was quite variable between cells (Figure 3E, range = 2.2–18.7%).
Comparison of Methods
Our estimates of RRP size as determined from 100 Hz bursts (7.3 ± 0.8% of the TRP) and from single APs under conditions of large intracellular calcium rises (5.9 ± 0.7% of the TRP) were in reasonable agreement. To further confirm that our protocols gave self consistent results, we designed experiments to estimate RRP size using both methods in each cell. From our previous results (Figure 2C) we knew that the response to a single AP in 250 μM 4-AP with 4 mM external calcium would only be a slight (∼7%) underestimate of the RRP size determined by fitting a generalized Hill model to the entire release curve. Therefore, in each of these experiments we began with the 100 Hz protocol and then applied 4-AP to estimate RRP size using single AP responses. Figure 4A shows an example of a neuron where we used both protocols and obtained a close correspondence between the different estimates. This observation was true across many cells (Figure 4B) such that the two estimates of RRP size were not significantly different from each other (5.1 ± 0.8% vs 5.5 ± 0.9% for single AP and 100 Hz burst protocol respectively, P = 0.23 in two tailed paired t-test, n = 8). This confirms the validity of our protocols for measuring RRP size.
Estimation of Pv
Having confirmed that we had reliable methods to estimate RRP size, we could use them to calculate Pv by measuring responses to 1 AP under standard conditions (2 mM external calcium). Figure 5A shows results from a single neuron that exemplifies the procedure. By measuring the response to a single AP (Figure 5A1) and then dividing it by the estimate of RRP size obtained with the 100 Hz protocol (Figure 5A2), we estimated Pv for that neuron.
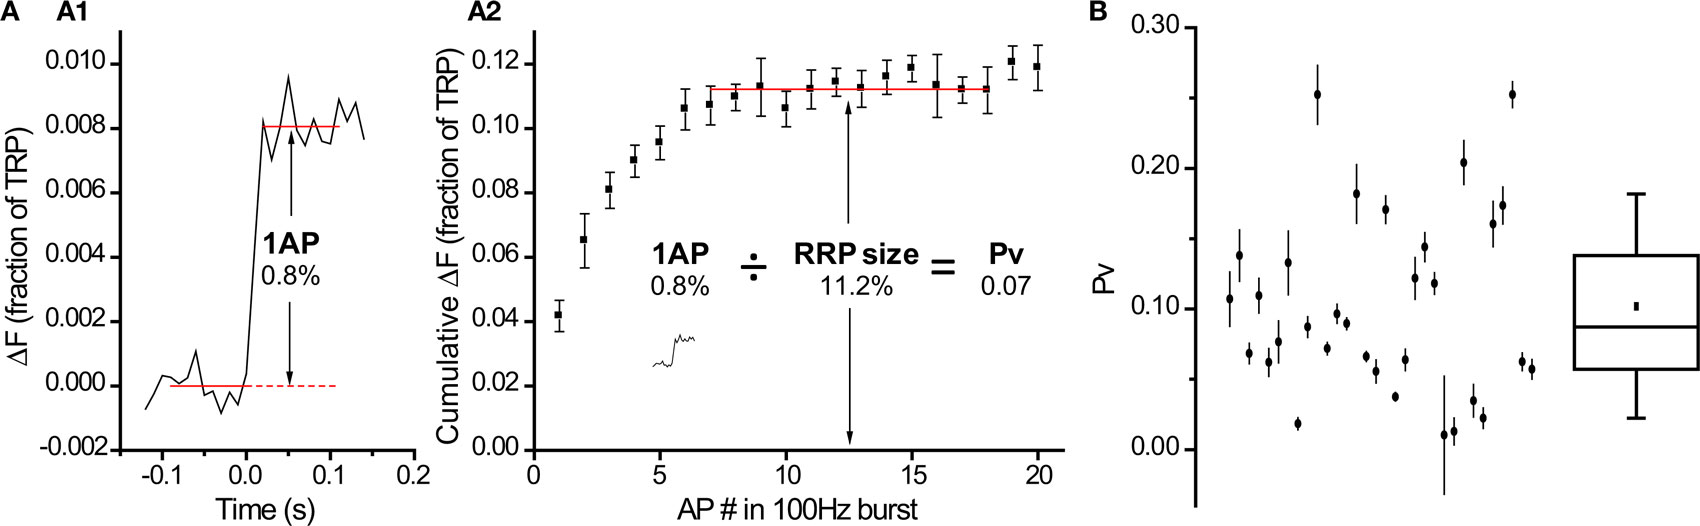
Figure 5. Pv varies over a wide range across cells. (A) Procedure for determining a neuron’s Pv requires a measurement of the response to 1 AP (A1, n = 20 trial average, 12 synapses) and an estimate of the RRP size (A2, n = 4 trial average). Values within each panel are in % of TRP. The trace from (A1) was scaled down 10-fold in the inset in (A2) to be at the same vertical scale as the 100 Hz burst measurement. (B) Pv determined with this protocol in 32 cells (see Materials and Methods for explanation of error bars). Box whisker plot shows the median (line), mean (point), 25–75 percentile (box) and 10–90 percentile (whisker) ranges.
Extending this procedure to many cells, we found Pv = 0.10 ± 0.01 (n = 32 cells). Interestingly, as with RRP size, Pv was quite variable between cells (Figure 5B, range = 0.01–0.25).
Discussion
We present here methods to provide optical measures of Pv and RRP size at synapses from neurons expressing vG-pH. Our measurements showed that ∼6–7% of all the releasable vesicles in a synapse are in a primed state, ready to fuse in response to an AP with 0.10 average probability.
An unexpected finding when developing protocols to measure the RRP size was the lack of strong depression in response to 20 or 40 Hz stimulation under both standard (2 mM) and high (4 mM) external calcium conditions. We initially tested these protocols due to reports in the literature that use short 20 Hz bursts to deplete the RRP in neurons in culture (Murthy and Stevens, 1998; Stevens and Williams, 2007). These reports are based on postsynaptic electrophysiological voltage clamp recordings of relatively young (5–15 days after plating) hippocampal neurons grown in culture. Early experiments (Murthy and Stevens, 1998) measured the amplitude of excitatory post synaptic currents (EPSCs) which depressed substantially during 2 s of 20 Hz stimulation. However, the use of EPSC amplitude to study depression during a stimulus will only include release that occurs synchronously, excluding asynchronous exocytosis which occurs between APs in the train, therefore underestimating the total amount of release. It is worth noting that our time resolution is such that the optically measured stimulus-locked exocytosis will include both synchronous and asynchronous components as defined above. A more recent study that takes into account this effect and measures cumulative charge (which will include both the synchronous and asynchronous component) shows much less depression during a 20 Hz, 80 AP train (Figure 5B in Stevens and Williams, 2007). Work from another group using similar methods shows clearer evidence of depression during a 2 s, 20 Hz train (Figure 1 in Moulder and Mennerick, 2005). However, in experiments performed in the presence of the rapidly dissociating AMPA receptor antagonist kynurenate (therefore unaffected by AMPA receptor saturation) there was considerably less depression (Figure 6B in same paper), suggesting a postsynaptic contribution to the phenomenon. Due to the comparatively weak depression in both recent papers, the authors had to apply a substantial correction for ongoing refilling of the RRP during stimulation to estimate RRP size. Another consideration is that previous experiments were often performed at a lower temperature (room temperature was ∼22°C in Stevens and Williams, 2007) than our 20 and 40 Hz experiments (30°C). Higher temperatures have been shown to lower release probability and increase the RRP refilling rate (Pyott and Rosenmund, 2002) predicting less depression in our experiments. Finally, a very recent study measured responses to 40 APs at 20 Hz using synaptophysin-pHluorin 2× and the results are similar to those shown here, with little evidence of depression (Supplementary Figure 2E in Matz et al., 2010). In summary, upon closer inspection our lack of clear depression at 20 and 40 Hz is not as surprising as it initially seemed to be.
The estimates we present for Pv (0.10) and RRP size (∼6–7% of the TRP) are consistent with values reported in the literature for dissociated hippocampal neurons in culture. It was shown previously in our lab that there are 64 ± 14 vesicles labeled with vG-pH in the TRP and that most of the vesicles in the synapse are labeled for the transfection conditions and age of cultured neurons used here (Balaji and Ryan, 2007). We therefore estimate that, on average, the RRP corresponds to ∼3–5 vesicles, a number similar to the number of docked vesicles observed by electron microscopy in hippocampal synapses in culture (4.6 ± 3.0 in Schikorski and Stevens, 1997). Given this number of vesicles in the RRP, if each has a Pv of 0.1 this indicates that sparse stimulation with single APs causes hippocampal synapses from rat neurons in primary culture to release, on average, 1 vesicle every 3 APs in standard conditions, (Pr∼0.3–0.4 from Eq. 2) which is consistent with previous estimates (Murthy et al., 1997; Granseth et al., 2006; Branco et al., 2008). The same kind of analysis suggests that under standard conditions multivesicular release is infrequent (probability of releasing 2 or more vesicles ∼0.03–0.08). However, if Pv is large enough (for example, in the presence of 4-AP) a single AP will cause multiple vesicles present in the RRP to exocytose. At the moment, our time resolution is limited to 10 ms so we do not know in detail the temporal coupling between an AP firing and the exocytosis of several vesicles under conditions of high Pv.
Interestingly, we noted considerable variability in both Pv and RRP size between cells (Figures 3E,5B). This was somewhat surprising given that we used a relatively homogenous population of neurons cultured from the CA3–CA1 region of the rat hippocampus. It is unknown whether this variability is characteristic of this brain region or a consequence of the in vitro growth conditions of the neurons. Measuring Pv and RRP size in cultured neurons prepared from other brain regions and/or cell types might provide some insights into this issue.
Our methods should be widely applicable to study factors that affect Pv and RRP size. By design these techniques are restricted to presynaptic properties and thus avoid complications such as receptor saturation and desensitization inherent in studying presynaptic properties based on a postsynaptic readout (Xu-Friedman and Regehr, 2004). Finally, a potential advantage of our imaging approach to study exocytosis parameters is that in a given experiment it provides information from many individual synapses in parallel. By averaging many trials, we expect it will be possible to obtain robust information from individual synapses, opening up for study the molecular analysis of synapse to synapse variability in Pv and RRP size.
Conflict of Interest Statement
The authors declare that the research was conducted in the absence of any commercial or financial relationships that could be construed as a potential conflict of interest.
Acknowledgments
This work was supported by grants from the National Institutes of Health (Timothy A. Ryan). The vGlut–pHluorin construct was kindly provided by Susan Voglmaier and Robert Edwards (University of California, San Francisco). We thank members of the Ryan laboratory and Jeremy Dittman for useful discussions and Ricky Kwan for excellent technical support.
Footnotes
References
Abenavoli, A., Forti, L., Bossi, M., Bergamaschi, A., Villa, A., and Malgaroli, A. (2002). Multimodal quantal release at individual hippocampal synapses: evidence for no lateral inhibition. J. Neurosci. 22, 6336–6346.
Atluri, P. P., and Ryan, T. A. (2006). The kinetics of synaptic vesicle reacidification at hippocampal nerve terminals. J. Neurosci. 26, 2313–2320.
Balaji, J., and Ryan, T. A. (2007). Single-vesicle imaging reveals that synaptic vesicle exocytosis and endocytosis are coupled by a single stochastic mode. Proc. Natl. Acad. Sci. U.S.A. 104, 20576–20581.
Branco, T., Staras, K., Darcy, K. J., and Goda, Y. (2008). Local dendritic activity sets release probability at hippocampal synapses. Neuron 59, 475–485.
Chapman, E. R. (2008). How does synaptotagmin trigger neurotransmitter release? Annu. Rev. Biochem. 77, 615–641.
Conti, R., and Lisman, J. (2003). The high variance of AMPA receptor- and NMDA receptor-mediated responses at single hippocampal synapses: evidence for multiquantal release. Proc. Natl. Acad. Sci. U.S.A. 100, 4885–4890.
Granseth, B., Odermatt, B., Royle, S. J., and Lagnado, L. (2006). Clathrin-mediated endocytosis is the dominant mechanism of vesicle retrieval at hippocampal synapses. Neuron 51, 773–786.
He, L., Xue, L., Xu, J., McNeil, B. D., Bai, L., Melicoff, E., Adachi, R., and Wu, L. G. (2009). Compound vesicle fusion increases quantal size and potentiates synaptic transmission. Nature 459, 93–97.
Mathie, A., Wooltorton, J. R., and Watkins, C. S. (1998). Voltage-activated potassium channels in mammalian neurons and their block by novel pharmacological agents. Gen. Pharmacol. 30, 13–24.
Matthews, G., and Sterling, P. (2008). Evidence that vesicles undergo compound fusion on the synaptic ribbon. J. Neurosci. 28, 5403–5411.
Matz, J., Gilyan, A., Kolar, A., McCarvill, T., and Krueger, S. R. (2010). Rapid structural alterations of the active zone lead to sustained changes in neurotransmitter release. Proc. Natl. Acad. Sci. U.S.A. 107, 8836–8841.
Meir, A., Ginsburg, S., Butkevich, A., Kachalsky, S. G., Kaiserman, I., Ahdut, R., Demirgoren, S., and Rahamimoff, R. (1999). Ion channels in presynaptic nerve terminals and control of transmitter release. Physiol. Rev. 79, 1019–1088.
Miesenbock, G., De Angelis, D. A., and Rothman, J. E. (1998). Visualizing secretion and synaptic transmission with pH-sensitive green fluorescent proteins. Nature 394, 192–195.
Moulder, K. L., and Mennerick, S. (2005). Reluctant vesicles contribute to the total readily releasable pool in glutamatergic hippocampal neurons. J. Neurosci. 25, 3842–3850.
Murthy, V. N., Sejnowski, T. J., and Stevens, C. F. (1997). Heterogeneous release properties of visualized individual hippocampal synapses. Neuron 18, 599–612.
Murthy, V. N., and Stevens, C. F. (1998). Synaptic vesicles retain their identity through the endocytic cycle. Nature 392, 497–501.
Oertner, T. G., Sabatini, B. L., Nimchinsky, E. A., and Svoboda, K. (2002). Facilitation at single synapses probed with optical quantal analysis. Nat. Neurosci. 5, 657–664.
Pyott, S. J., and Rosenmund, C. (2002). The effects of temperature on vesicular supply and release in autaptic cultures of rat and mouse hippocampal neurons. J. Physiol. 539, 523–535.
Rosenmund, C., and Stevens, C. F. (1996). Definition of the readily releasable pool of vesicles at hippocampal synapses. Neuron 16, 1197–1207.
Ryan, T. A. (1999). Inhibitors of myosin light chain kinase block synaptic vesicle pool mobilization during action potential firing. J. Neurosci. 19, 1317–1323.
Sakaba, T., Schneggenburger, R., and Neher, E. (2002). Estimation of quantal parameters at the calyx of Held synapse. Neurosci. Res. 44, 343–356.
Sankaranarayanan, S., De Angelis, D., Rothman, J. E., and Ryan, T. A. (2000). The use of pHluorins for optical measurements of presynaptic activity. Biophys. J. 79, 2199–2208.
Schikorski, T., and Stevens, C. F. (1997). Quantitative ultrastructural analysis of hippocampal excitatory synapses. J. Neurosci. 17, 5858–5867.
Schneggenburger, R., Meyer, A. C., and Neher, E. (1999). Released fraction and total size of a pool of immediately available transmitter quanta at a calyx synapse. Neuron 23, 399–409.
Schneggenburger, R., Sakaba, T., and Neher, E. (2002). Vesicle pools and short-term synaptic depression: lessons from a large synapse. Trends Neurosci. 25, 206–212.
Sokal, R. R., and Rohlf, F. J. (1994). Biometry: The Principles and Practice of Statistics in Biological Research, 3rd edn. New York: Freeman.
Sorensen, J. B. (2004). Formation, stabilisation and fusion of the readily releasable pool of secretory vesicles. Pflugers Arch. 448, 347–362.
Stevens, C. F., and Williams, J. H. (2007). Discharge of the readily releasable pool with action potentials at hippocampal synapses. J. Neurophysiol. 98, 3221–3229.
Taylor, J. R. (1997). An Introduction to Error Analysis: The Study of Uncertainties in Physical Measurements, 2nd edn. Sausalito, CA: University Science Books.
Voglmaier, S. M., Kam, K., Yang, H., Fortin, D. L., Hua, Z., Nicoll, R. A., and Edwards, R. H. (2006). Distinct endocytic pathways control the rate and extent of synaptic vesicle protein recycling. Neuron 51, 71–84.
Wesseling, J. F., and Lo, D. C. (2002). Limit on the role of activity in controlling the release-ready supply of synaptic vesicles. J. Neurosci. 22, 9708–9720.
Xu, J., and Wu, L. G. (2005). The decrease in the presynaptic calcium current is a major cause of short-term depression at a calyx-type synapse. Neuron 46, 633–645.
Keywords: synapse, exocytosis, release probability, pHluorin, readily-releasable pool, imaging
Citation: Ariel P and Ryan TA (2010) Optical mapping of release properties in synapses. Front. Neural Circuits 4:18. doi: 10.3389/fncir.2010.00018
Received: 20 April 2010;
Paper pending published: 16 May 2010;
Accepted: 18 June 2010;
Published online: 12 August 2010
Edited by:
Massimo Scanziani, University of California, San Diego, USAReviewed by:
Thomas G. Oertner, Friedrich Miescher Institute for Biomedical Research, SwitzerlandThomas Knopfel, RIKEN Brain Science Institute, Japan
Copyright: © 2010 Ariel and Ryan. This is an open-access article subject to an exclusive license agreement between the authors and the Frontiers Research Foundation, which permits unrestricted use, distribution, and reproduction in any medium, provided the original authors and source are credited.
*Correspondence: Timothy A. Ryan, Department of Biochemistry, Weill Cornell Medical College, New York, NY 10065, USA. e-mail: taryan@med.cornell.edu