Binocular integration of visual information: a model study on naturalistic optic flow processing
- Department of Neurobiology and Center of Excellence ‘Cognitive Interaction Technology’, Bielefeld University, Bielefeld, Germany
The computation of visual information from both visual hemispheres is often of functional relevance when solving orientation and navigation tasks. The vCH-cell is a motion-sensitive wide-field neuron in the visual system of the blowfly Calliphora, a model system in the field of optic flow processing. The vCH-cell receives input from various other identified wide-field cells, the receptive fields of which are located in both the ipsilateral and the contralateral visual field. The relevance of this connectivity to the processing of naturalistic image sequences, with their peculiar dynamical characteristics, is still unresolved. To disentangle the contributions of the different input components to the cell’s overall response, we used electrophysiologically determined responses of the vCH-cell and its various input elements to tune a model of the vCH-circuit. Their impact on the vCH-cell response could be distinguished by stimulating not only extended parts of the visual field of the fly, but also selected regions in the ipsi- and contralateral visual field with behaviorally generated optic flow. We show that a computational model of the vCH-circuit is able to account for the neuronal activities of the counterparts in the blowfly’s visual system. Furthermore, we offer an insight into the dendritic integration of binocular visual input.
Introduction
Navigation and the control of locomotion in any environment require information about ego-motion. For many living beings, vision is an important sense with which to gather such information. Animals with a panoramic field of view, such as insects, many birds, and several mammals with lateral eyes, can exploit visual cues to gather information about ego-motion. Forward translation of the animal, for instance, elicits optic flow directed from front to back on both eyes (Gibson, 1950). In contrast, rotatory ego-motion about the vertical axis of the eyes leads one eye to experience motion from front to back and the other from back to front. Hence, by taking into account global movement direction on both retinae, translatory, and rotational self-motion can be distinguished. This strategy of combining visual motion information from a panoramic field of view is used by several animals with lateral eyes, such as rabbits, pigeons, and many arthropods (Simpson, 1984; Ibbotson, 1991; Kern et al., 1993; Kern, 1998; Frost and Wylie, 2000).
The fly is an ideal model system to analyze the computation of visual information from both visual hemispheres. After retinotopic processing, visual motion information converges in the lobula plate, the third neuropil of the fly’s visual system. It contains about 60 individually identifiable neurons, the lobula plate tangential cells (LPTCs). Most of these large motion-sensitive interneurons integrate signals from several hundreds of retinotopically arranged input elements, i.e., the elementary motion detectors (EMDs; Hausen, 1984; for review see Egelhaaf et al., 2004; Egelhaaf, 2006; Borst et al., 2010). This is different for the vCH-cell (ventral centrifugal horizontal cell; Hausen, 1981; Eckert and Dvorak, 1983) which does not receive its input via retinotopic EMDs but from other mostly identified LPTCs from the ipsilateral and contralateral half of the brain (Farrow et al., 2003; see Figure 1). Despite these known connections, it is not fully understood how the vCH-cell merges the signals from input elements originating in both hemispheres and how these contribute to the complex vCH response characteristic. Each hemisphere contains one vCH-cell. These paired cells are mirror symmetric to each other and respond to ipsilateral as well as contralateral optic flow with, at least on average, similar response amplitudes (Egelhaaf et al., 1993). In contrast, the majority of the LPTCs have a receptive field dominated by one hemisphere with one predominant preferred direction being largely unaffected by contralateral stimulation (Hausen, 1984). Its input organization and response characteristic make the vCH-cell a suitable candidate with which to study the computation of signals mediated by different input elements with receptive fields covering a substantial part of the fly’s visual field.
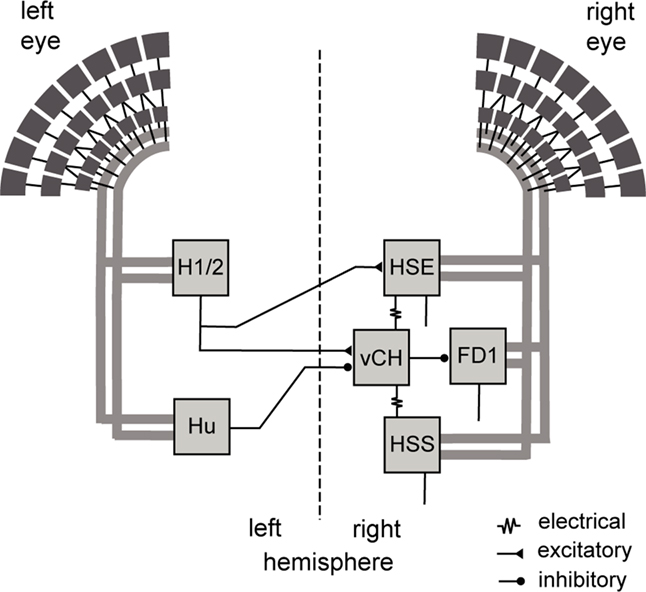
Figure 1. Wiring sketch of the vCH-cell input circuit. Shown are those motion-sensitive input elements of the vCH-cell that have a horizontal preferred direction, as well as the postsynaptic FD1-cell. All input elements of the vCH-cell get retinotopic motion input (thick gray lines) from large portions of one eye. The H1 and H2 of the left brain hemisphere excite the vCH-cell of the right hemisphere, whereas the left Hu-cell inhibits it. The HSE-cell and the HSS-cell of the right side are electrically coupled to the vCH-cell, which inhibits the FD1-cell.
The vCH-cell gets ipsilateral input via dendro-dendritic electrical synapses from the HSS-cell and HSE-cell, which are LPTCs sensitive to ipsilateral motion from front to back (Hausen, 1982a,b; Haag and Borst, 2002). Contralateral input to the vCH-cell is mediated by the H1-cell, the H2-cell, the V1-cell (not shown in Figure 1), and the Hu-cell; LPTCs with different preferred directions and receptive field locations. H1 and H2 get retinotopic input from EMDs and have largely overlapping receptive fields. They respond best to motion directed from back to front (Warzecha et al., 1998; Krapp et al., 2001; Haag and Borst, 2003). Both are heterolateral elements and project onto the vCH-cell and further cells of the contralateral brain hemisphere. Despite their similar functional properties H1 and H2 terminate on different sites on vCH (Horstmann et al., 2000; Haag and Borst, 2001). V1 is the only known input element to vCH with a predominantly vertical preferred direction. It provides excitatory input to the contralateral vCH-cell (Haag and Borst, 2003). A spiking contralateral element, responding best to motion from front to back, inhibits the vCH-cell with pronounced IPSPs (Egelhaaf et al., 1993; Gauck et al., 1997). This element is not yet anatomically identified and is referred to as Hu-cell. Recordings at different vCH-cell sites indicate that the inhibition by the Hu-cell originates outside the lobula plate (Haag and Borst, 2001). The vCH-cell in turn inhibits most likely via dendritic output synapses the FD1-cell, which is thought to contribute to solving object detection tasks (Egelhaaf, 1985; Warzecha et al., 1993; Gauck et al., 1997; Kimmerle et al., 1997). Major parts of the circuit are illustrated in Figure 1.
To unravel the spatial integration properties of the vCH-cell as well as the contribution of its input elements to its overall responses under natural stimulus conditions, we analyzed the vCH-cell and selected presynaptic elements electrophysiologically as well as via modeling. The model includes the visual pathway from the peripheral visual system to the LPTCs. The different LPTCs are modeled as one-compartment membrane patches. The cells and their model counterparts are stimulated by naturalistic optic flow, reconstructed from trajectories of free-flying flies. To disentangle the influence of different parts of the visual field and the interactions between the response components elicited by stimulation of these parts for each analyzed cell, the lateral and/or the binocular frontal parts of the visual field are masked in different combinations. The cellular responses to selected stimuli are used to adjust the model, which yields the contribution of each of the input elements to the vCH response with a realistic dynamic range.
Materials and Methods
Stimulus Generation and Electrophysiology
The position and orientation of the head of blowflies flying in a cage of 40 cm × 40 cm × 40 cm, with images of herbage on its side walls, were recorded using magnetic fields driving search coils attached to the flies (Schilstra and van Hateren, 1998; van Hateren and Schilstra, 1999). Because the fly’s compound eyes are fixed in its head, and the visual interior of the cage was known, the visual stimulus encountered by the fly during a flight could be reconstructed.
Reconstructions of three flight sequences of 3.45 s each, originating from three different flies (sequences A, B, and C), were played back on a panoramic stimulus device, FliMax (Lindemann et al., 2003), at a frame rate of 370 Hz. Proper spatial and temporal prefiltering prevented spatiotemporal aliasing during fast turns (Lindemann et al., 2003). Every flight sequence was preceded by a 1-s period with all LEDs lit at half the maximum brightness, then 0.5 s where the LEDs faded to the brightness values corresponding to the first frame of the subsequently replayed reconstructed image sequence. The inter-stimulus interval, with all LEDs lit at the mean brightness calculated from the flight stimulus, was 7 s. The overall light-priming sequence minimized potential influences of subsequent stimulus presentation of the neural responses.
Masks
To restrict the visual input of the recorded cells to defined regions of the flies’ receptive field, we applied three differently sized masks during the reconstruction process. The masks were applied virtually during the stimulus generation process. Instead of showing the actual stimuli in the masked areas of the visual field the respective LEDs of FliMax were constantly lit at about half their maximum brightness.
A frontal mask covering the binocular part of the visual field had a horizontal extension at the eye equator from −20° to 20° (0° is frontal, negative values: left). The left (right) mask covered the lateral visual field from −120° to −20° (20–120°; see Figure 2A). The masks were applied in different combinations. Responses to mask stimuli were compared to those obtained without applying any mask at all. This condition is referred to as full stimulation in the following sections. The azimuthal equatorial extent of the full stimulus spans approximately −120° to +120° (for details see Lindemann et al., 2003).
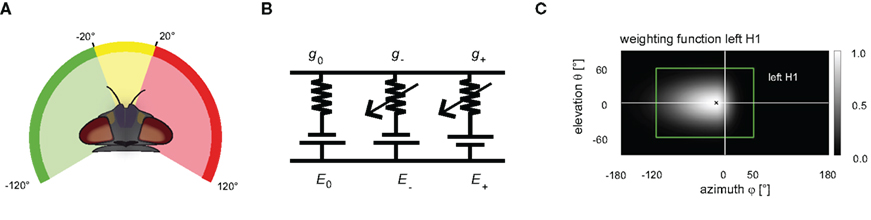
Figure 2. (A) The panoramic visual stimulation device FliMax allows stimulation of ±120° at the eye equator (for details see Lindemann et al., 2003). Three disjunct electronic masks were applied in order to restrict the visual input to defined regions of the visual field. A frontal mask covers the binocular visual field (yellow). Two further masks cover the remaining lateral parts of the visual field (green, red). The masks were applied in different combinations. (B) Dendritic integration of all modeled cells is described by an electrical equivalent circuit consisting of a passive one-compartmental membrane patch. The leakage currents are determined by the resting potential E0 and the leak conductance g0. The excitatory (inhibitory) currents are given by the excitatory (inhibitory) reversal potential E+ (E-) and the synaptically controlled excitatory (inhibitory) conductance g+ (g-). (C) The sensitivity distributions of the model cells’ receptive fields are approximated by a 2D Gaussian function. The function is horizontally asymmetric, allowing different angular distribution widths. As an example, the sensitivity distribution of the left model H1 is shown in a cylindrical map projection. The center of the receptive field is marked by a black cross. The gray level indicates the level of sensitivity with lighter gray corresponding to higher sensitivities of the left H1-cell. The green rectangle surrounds the area used as the visual field of the model’s left eye.
Animals and electrophysiological recording
All experiments were done on female blowflies of the genus Calliphora. The animals were bred in our laboratory culture. The dissection of the 1- to 2-day-old animals for intracellular recording or 3- to 6-day-old animals for extracellular recordings, respectively, followed the routines conventionally used in our laboratory (see, e.g., Warzecha et al., 1993, 2000). Alignment of the flies’ eyes with the stimulus device was achieved according to the symmetry of the deep pseudopupil (Franceschini, 1975).
Recordings from LPTCs were made with standard electrophysiological equipment. Intracellular data were low-pass filtered (corner frequency 2.4 kHz). Extracellularly recorded spikes were transformed into pulses of fixed height and duration before sampling. Sampling rate was always 4 kHz (I/O-card DT3001, Data Translation) using the VEE Pro 5.0 (Agilent Technologies) in conjunction with DT VPI (Data Translation) software. The LPTCs were identified by the recording site, their response mode, their preferred motion-direction, and the location of their receptive field. All experiments were done at temperatures between 29 and 35°C, as measured close to the position of the fly in the center of FliMax.
Data analysis
The H1-cell was recorded extracellularly. For every recorded response trace, a peristimulus time histogram (PSTH) was calculated at the original sampling rate from the interspike intervals. All responses to a given stimulus in a given cell were averaged after the resting activity – determined in a 250-ms time window just before the fading period of the stimulus movie – had been subtracted. Finally, the mean PSTHs of all cells of a given type were averaged and frequencies were binned within 2 ms time intervals. The vCH-cell and the HS-cell were analyzed by intracellular recordings. Again, the response traces from a cell to a given stimulus were averaged and the mean resting potential subtracted. A Gaussian filter (sigma = 3 ms) was applied to the mean responses traces. The filtered responses were averaged across cells of a given type. Data analysis was done with MATLAB 7.x.
Models
The model of the visual motion pathway comprises the optics of the eyes, the peripheral processing stages of the visual system, local motion detection, the spatial pooling of arrays of local motion detectors by LPTCs, and the interaction between LPTCs belonging to the input circuitry of the vCH-cell (see Figure 1). These different processing stages are organized into individual modules. As a first approximation to reality, the flow of information is exclusively feed forward. The individual time steps correspond to 1 ms. Model parameters were obtained either from previous studies or were optimized as free model parameters in an automatic optimization process (see below).
Eye model and peripheral processing
The first module reflects the optic properties of the fly’s compound eyes. A retinal image reconstructed from the flight trajectory and a 3D-model of the corresponding environment is spatially convolved with a Gaussian low-pass filter (σ = 2°) to approximate the optics of the fly’s eye. The filtered signal provides the input to the photoreceptors, which are equally spaced at 2° in elevation and azimuth. The field of view of the left eye covers an elevation range from 60° above to 60° below the horizon, and extends horizontally from −120° in the ipsilateral visual field to +50° in the contralateral field of view (Figure 2C, green rectangle). The field of view of the right eye is mirror symmetric. This field of view covers the receptive fields of all cells that are relevant to this study. For simplicity, the photoreceptors are arranged in a rectangular grid with 60 by 86 elements, which thus deviates in its details from the fly’s roughly hexagonal ommatidial lattice (Exner and Hardie, 1989; Land, 1997; Petrowitz et al., 2000).
The second module merges properties of the processing performed by the photoreceptors and second-order neurons in the fly visual system and describes them as a temporal band pass filter. The filter properties are approximated from experimental analysis and adjusted to the luminance conditions of the electrophysiological experiments (Juusola et al., 1995; Lindemann et al., 2005).
Elementary motion detection
The EMD model is an elaborated correlation-type motion detector with an arithmetic multiplication of a low-pass filtered signal of a photoreceptor and a high-pass filtered signal of a horizontally neighboring photoreceptor (see Figure 3; Borst et al., 2003). The time constants are set to τlp = 10 ms in the low-pass filter and to τhp = 60 ms in the high-pass filter. The parameters were estimated in a previous study (Lindemann et al., 2005). The detector consists of two half-detectors, i.e., mirror symmetric subunits with opposite preferred directions. The corresponding half-detectors each form a retinotopic grid and are used as the input into the following model stages. For simplicity, the model does not contain contrast or luminance normalization. The first modules are equivalent to the model of Lindemann et al. (2005) – see reference for further details.
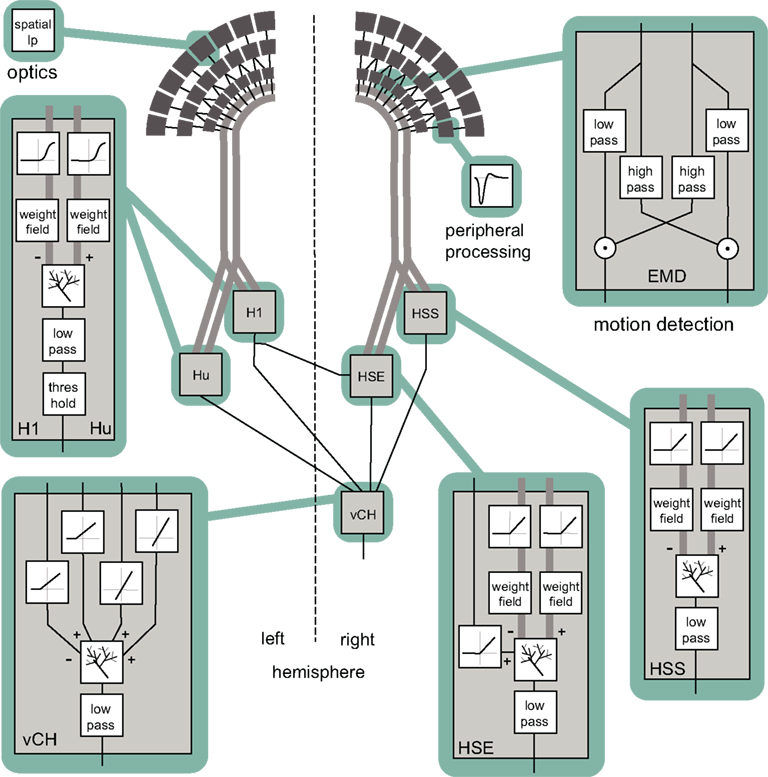
Figure 3. Block diagram summarizing the model of the visual motion information pathway of the fly from the optics of the eyes to the spatial integration in the lobula plate. A spatial low-pass filter accounts for optic properties of the ommatidia. The peripheral processing is approximated by an array of temporal band-pass filters (indicated by the impulse function of the filter) providing the input to an array of elementary motion detectors (EMD) sensitive to horizontal motion. Each EMD is subdivided into two mirror symmetric subunits with opposite preferred directions, each consisting of a temporal high-pass, a low-pass filter, and a multiplication stage. The retinotopic motion information of the half-detectors with the same preferred direction is bundled up in one channel (broad gray lines). The motion information conveyed by the channels is spatially integrated by model cells presynaptic to the vCH-cell. Synaptic transmission is characterized by a half-wave rectification before the spatial signal is weighted by a weighting function corresponding to the spatial sensitivity of the respective cell. The retinotopic signals are spatially integrated by means of an electrical equivalent circuit of a one-compartment passive membrane patch. In doing so, one channel has inhibitory, the other excitatory impact on the integrating element. The model HSE receives additionally excitatory input from the model H1. The integrated signal of all elements is temporally low-pass filtered to account for time constants of the integrating cell. Additionally, the model Hu and the model H1 are characterized by a threshold, because as spiking elements they cannot convey negative signals. In contrast to its presynaptic elements the model vCH does not receive input from the EMDs directly. Rather it gets input only from other motion-sensitive elements located in the ipsi- or contralateral lobula plate. The spatial integration and the low pass are similar to those of the presynaptic elements.
Spatially integrating elements
Lobula plate tangential cells of the fly spatially integrate the output of local motion detectors. The dendritic integration by LPTCs is approximated using an electrical equivalent circuit of a one-compartmental passive membrane patch (see Figure 2B). The resulting membrane potential is given by

g− and g+ denote the total conductance of the inhibitory and excitatory synapses, respectively, that are controlled by the outputs of the two half-detectors of local movement detectors. E− and E+ are the corresponding reversal potentials with E+ set to 1. The resting potential E0 of the cell is set to zero. The leak conductance g0 of the element is arbitrarily set to 1. All other conductances are thus to be interpreted relative to the leak conductance. g− and g+ are calculated as the weighted output of synaptic transfer functions. Capacitive properties of the cell membrane are approximated by a temporal low-pass filter.
Synaptic transmission
Two alternative transformation characteristics from presynaptic to postsynaptic signals were implemented. The basic version is a rectifying linear characteristic with a subsequent amplification. An elaborated variant of the transmission characteristic is given by a sigmoid function:
where α describes the slope of the sigmoid, α accounts for the level of saturation, and β specifies the operating range of the modeled synapse. A rectification stage prevents output values from falling below zero.
Local sensitivities
Heterogeneous dendritic branching of LPTCs and synapse densities lead to receptive fields with a characteristic sensitivity distribution (Hausen, 1984). The model takes this feature into account by using a weighting function, described by a 2D Gaussian function. The distribution is horizontally asymmetric, i.e., the angular width on the left is not equal to that on the right. (As an example, the sensitivity distribution of the model H1 is shown in Figure 2C). For a given retinal position, the sensitivity is defined as follows:
where θ denotes the elevation and φ the azimuth. θC and φC predict the center of the weight field. σθ is the angular width of the distribution in elevation. σφ_r is the azimuthal angular width on the right, σφ_l is that on the left. For the inhibitory and excitatory inputs from the half-detectors, the same weighting function is used. The different parameters need to be adjusted to approximate the different LPTCs’ characteristics.
HS models
The HSS- and HSE-cell have the same overall preferred direction from front to back and get their retinotopic input from EMDs (Hausen, 1984). Thus, the excitatory conductance gHS+ is controlled by the outputs of the half-detectors emd+ at the corresponding grid locations, with a preferred direction from front to back. In order to obtain the excitatory conductance gHS+, the half-detector outputs are transformed by a linear synaptic transfer function synHS+ before being weighted by the cells’ sensitivity distribution wHS:

where n and m denote the position in the retinotopic grid. The inhibitory conductance gHS− is controlled by the second set of half-detectors emd−:

The membrane potential of the model HSS UHSS is calculated as follows:

In contrast to HSS, HSE receives excitatory input from the contralateral H1 element in addition to its retinotopic input (see Figure 1). The membrane potential of the model HSE is thus calculated as

where the conductance gHSE_H1 depends on the activity SFH1 of the model H1:

The parameters of the transfer functions are free parameters of the model. The parameters of the inhibitory and excitatory channels are independent. The parameters of the weighting function are fixed and are estimated on the basis of the experimentally determined sensitivity distributions of HS-cells (Krapp et al., 2001). The peak sensitivity of the weighting function is set to θC = 0° (HSE), θC = −30° (HSS) in elevation, and φC = 10° in azimuth. The angular width of the weighting function is σθ = 35° in elevation. The function tapers over the right side with a sharp cut off on the left (σφ_r = 110°, σφ_l = 0°).
H1 and Hu model
Just like the HSS- and HSE-cell, the H1-cell receives retinotopic input from motion detectors. The membrane potential UH1 of the model H1 is calculated in a similar manner to that of the HSS- and HSE-cells, but with reversed inhibitory and excitatory channels due to its reversed preferred direction of motion. Moreover, an extended synaptic transfer function (see Eq. 1) was used. The parameters of the transfer function are free parameters of the model. Data on H1 responses were obtained from extracellular recordings. Thus, a subsequent spike threshold was incorporated into the model H1:
The H1 weighting function parameters were estimated from Krapp et al. (2001) as follows: The maximum sensitivity was set at an elevation of θC = 2° and an azimuth of φC = −15°. The angular width of the distribution is σθ = 35° in elevation. The right azimuthal angular width is σφ_r = 25°, the left is σφ_l = 120° (see Figure 2C). The model Hu is equivalent to the model H1, but with a reversed preferred direction.
vCH-model
The vCH-cell was modeled like the former cells as a one-compartmental passive membrane patch, but it differs in its input organization. It does not receive direct input from EMDs. Rather, it receives input from the ipsilateral HSE and HSS, the contralateral H1, and the contralateral Hu (see Figure 3). Since the H2-cell, another contralateral input element, has a similar preferred direction to H1 and a largely overlapping receptive field, this cell was not explicitly taken into consideration for the present model. The membrane potential of vCH is given by:
where UHSS and UHSE are the model HS membrane potential signals. The free model parameter gvCH_HS accounts for conductance of the dendro-dendritic gap junctions between HS-cells and vCH-cell. The conductances gvCH_H1 and gvCH_Hu are determined by linear synaptic transfer functions equivalent to Eq. 8 and depend on the activity signals SFH1 and SFHu of the model H1 and the model Hu, respectively. The amplification factors of the transfer functions, the reversal potential E−, the current Ix, and the conductance gX are free parameters of the model.
Optimizing model parameters
The model parameters were optimized to mimic the cells’ responses to naturalistic stimulation. As a quantitative measure of the similarity between physiological p(t) and model data ms(t) the root mean square difference drms was chosen:
The models as described above do not contain all latencies of the nervous system. To correct for this fact, the optimal shifts between the visual input and the model output were determined by a cross-correlation of the model and neuronal signals. Setting the excitatory reversal potential arbitrarily to 1 (see above) implies that the model response is not necessarily scaled to the range of the physiological responses. The scaling factor f was determined analytically, by finding the factor that scales the model response to the corresponding neuronal response with the smallest drms. Since the model is not analytically accessible, an automatic method was applied for parameter optimization. As it is convenient for continuous, non-linear, multimodal, and analytically non-accessible functions, the automatic stochastic optimization method “Differential Evolution” was chosen (Price, 1999).
The search algorithm parameters of the search algorithm were adjusted to the current optimization task in preliminary tests (scaling factor f = 0.6; crossover constant CR = 0.9). For the final optimization the neural responses to the optic flow experienced during flight sequence A of length 3.45 s were used. Since Differential Evolution is a stochastic optimization method, finding the global optimum is not guaranteed, as it is possible to get stuck in a local inflection. As a consequence, the procedure was repeated up to 50 times for each model. Only the best solutions were used in further analysis. For each model, the best solution was reliably found independent of the starting conditions. Neural and model responses to stimulation with the optic flow sequences generated on flight sequences B and C were used as controls.
Results
The vCH-cell is an individually identified visual interneuron that receives input from various other individually identified LPTCs of both the ipsilateral and contralateral half of the visual system (see Figure 1). To disentangle the contributions of the different input components to the cell’s overall response, large parts of the visual field as well as selected ipsi- and contralateral eye regions were stimulated with behaviorally generated optic flow. Selection was accomplished by masking certain parts of the stimulus area. We used the experimental results of various cells presynaptic to the vCH-cell to tune the corresponding model cells. The experimental results and these models were then used in a model vCH-cell to determine the contribution of the presynaptic elements to the overall vCH-cell response. For simplicity, the right vCH-cell will be used as a reference cell. Since the brain is mirror symmetrical, all conclusions concerning the right vCH-cell are expected to hold also for the left vCH-cell.
Responses of the vCH-Cell to Behaviorally Generated Optic Flow
Visual stimulation with behaviorally generated optic flow reflects the consequences of typical flight behavior of flies, which can be divided into saccades, i.e., phases of fast turns that are dominated by rotational optic flow and the intersaccadic intervals that are dominated by translational optic flow (Figure 4A). By this saccadic flight and gaze strategy, translatory and rotatory motion components are largely separated from each other (Collett and Land, 1975; Wagner, 1986; Schilstra and van Hateren, 1998; van Hateren and Schilstra, 1999; Tammero and Dickinson, 2002; Braun et al., 2010). Forward translatory flight produces optic flow from front to back on both eyes, as saccades to the left do on the right eye. In contrast, saccades to the right elicit optic flow from back to front on the right eye. The opposite holds for the left eye.
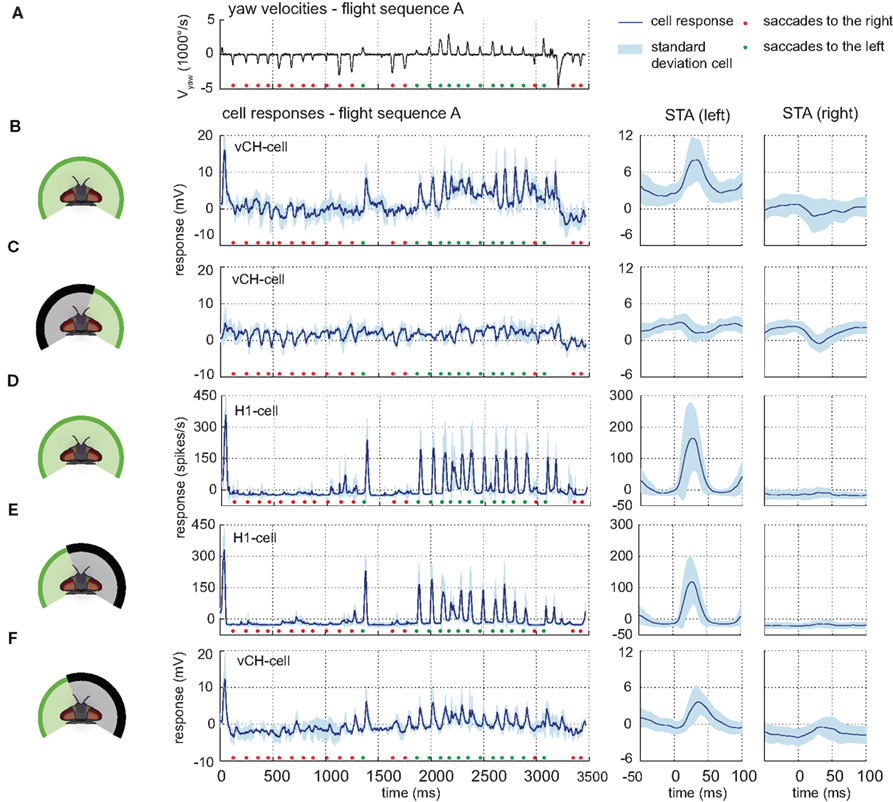
Figure 4. Contralateral input to the vCH-cell. Electrophysiologically measured responses of the right vCH-cell and the left H1-cell to naturalistic motion stimulation of different parts of the visual field. (A) Head yaw velocities plotted against time for flight sequence A. The flight behavior can be divided into saccades – short phases of fast turns – and intervals dominated primarily by translatory motion. Saccades to the right are marked by a red dot, saccades to the left by a green dot. [(B) left] Response time course of the right vCH-cell (blue line, SD in light blue) for flight sequence A during full stimulation. [(B) right] Corresponding saccade-triggered averages (STA) ± SD (light blue), i.e., the response average around saccades in a given direction (specified in brackets) plotted against time. Time 0 represents the time of maximal yaw velocity during the saccades. The middle section of the plotted STA relates to the saccades, whereas the outer parts relate predominantly to translatory phases during the intersaccadic intervals. (C) Responses and STAs of the right vCH-cell to flight sequence A. The stimulus is limited to the right part of the visual field. (D,E) Responses and STAs of the left H1-cell to flight sequence A. (E) The stimulus is limited to the left part of the visual field. (F) Responses and STA of the right vCH-cell to flight sequence A during stimulation of the left visual field.
These situations are reflected in the vCH-cell response when the cell is stimulated with optic flow generated by three different flight sequences. Pronounced depolarizations in the right eye vCH-cell response are most salient during saccades to the left (Figure 4B left, green markers). This prominent characteristic is also found in saccade-triggered averages (STA), the response average around saccades in a given direction (Figure 4B right). The depolarizations during saccades have their origin in the left visual field, since they are not present during stimulation of the right side of the visual field alone (see Figure 4C). They are probably mediated by the left H1-cell and the left H2-cell since these cells are known to be important excitatory contralateral input elements of the right vCH-cell (see above). Because of their similar response properties, only one of them, the H1-cell, was examined electrophysiologically in the present study and serves as a representative of both cells. The elements have the same preferred direction, and respond to motion from back to front by increasing their spike rate. The spike rate is decreased below its moderate resting level by motion in the opposite direction (Hausen, 1984; Warzecha et al., 1998).
Contralateral Input Mediated by the H1-Cell
As expected, the depolarizations in the vCH-cell during saccades to the left coincide with increases in spike rate in H1. The spike rate of the H1-cell increases strongly as a response to saccadic turns inducing optic flow in its preferred direction. The cell’s activity decreases below resting activity in the intersaccadic intervals and during saccadic turns that generate optic flow in its null direction (shown for flight sequence A in Figure 4D left). Within the intersaccadic intervals, the H1-cell displays an activity slightly below its resting level. At the time when the peak velocity of preferred direction saccades is reached the response of the H1-cell rises strongly, returning to its former level after about 50 ms (Figure 4D right).
This response characteristic of the H1-cell has its origin in the frontal and lateral part of the left visual field. Stimulating only the left visual field does not change this overall characteristic (Figure 4E). However, masking out the left visual field reduces the response most prominently (data not shown). The left H1-cell receives inhibitory input from the right field of view, via the left vCH-cell (Haag and Borst, 2001). This input, however, is not apparent under our stimulus conditions (data not shown).
Contralateral Input mediated by Hu-Cell
Stimulating only the left visual field indicates the existence of a further input element of the right vCH-cell with a receptive field on the left side. Whereas the spike rate of the H1-cell is slightly but constantly below resting activity before, after, and during null direction saccades (see Figure 4E), the vCH-cell is slightly hyperpolarized before and after null direction saccades only; During saccades, its response is close to resting activity (see Figure 4F). The most plausible explanation is an inhibitory element with its receptive field in the left visual field and a preferred direction from front to back. Such an element is expected to be depolarized during forward translation. This interpretation fits the physiological properties of an anatomically uncharacterized element which was referred to as Hu-cell (Hausen, 1984; Haag and Borst, 2001). Because of methodological difficulties this neuron was not analyzed experimentally in the present study.
Ipsilateral Input Mediated by HS-Cells
When only the right visual field is stimulated, the right vCH-cell depolarizes during forward translation and saccadic turns to the left. Saccadic turns to the right elicit cellular activities slightly below the resting activity (Figures 5A,B). Input from the right visual field is mediated by retinotopic input via dendro-dendritic gap junctions connecting the right vCH-cell with the HSS-cell and the HSE-cell of the right brain hemisphere (Haag and Borst, 2002). The time course of the responses to behaviorally generated optic flow of the HSE-cell and the HSS-cell corroborate previous findings that they mediate essential information from the right side of the visual field to the vCH-cell. The response amplitude of the vCH-cell is smaller than that of the HS-cells, although the time course is similar, as we expect from their electrical coupling (see Figures 5B,C). Under the experimental conditions used here, substantial responses of the HS-cells are evoked during translatory motion in the intersaccadic intervals.
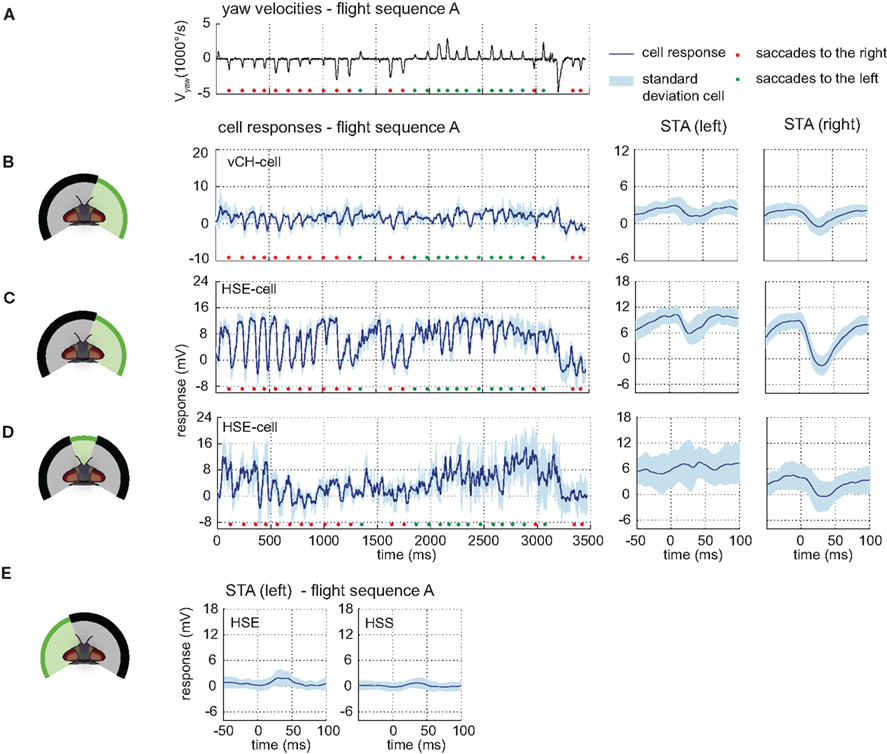
Figure 5. Ipsilateral input to the vCH-cell. Electrophysiologically determined responses of the HS-cells and the vCH-cell to naturalistic motion stimulation of different parts of the visual field. (A) Head yaw velocities plotted against time for flight sequence A. (B) Responses and STAs of the right vCH-cell to flight sequence A. The stimulus is limited to the right part of the visual field. (C,D) Responses and STAs of the right HSE-cell to flight sequence A and different parts of the visual field stimulated as depicted at the left of each row. (E) STAs of the right HSE- (left) and the right HSS-cell (right) for saccades to the left while the left part of the visual field is stimulated by flight sequence A. All color and sign codes as in Figure 4.
The HS-cells receive their main visual information from the frontal and the right field of view. Motion in both the right and the frontal visual field elicits strong HS-cell responses. Covering the frontal field of view only slightly decreases the HS-cell response (data not shown) compared to the response to full stimulation. Exclusive stimulation of the frontal part of the visual field also leads to similar responses, albeit with lower amplitudes (see Figure 5D).
Motion in the left field of view has only a small influence on the HSE-cell and almost no effect on the HSS-cell membrane potential. Whereas the HSE-cell shows weak responses during preferred direction saccades, such responses are missing in the HSS-cell (see Figure 5E). The slight response seen in the HSE-cell is probably due to its known excitatory input from the contralateral H1- and H2-cell (Horstmann et al., 2000; Haag and Borst, 2001).
Modeling the Contribution of Input Elements to the vCH-Cell Response
We developed models of the LPTCs vCH-, H1-, HSE-, HSS-, and Hu-cells. Each cell exists once in each hemisphere. Our vCH-model circuit contains one model of the cells that are directly presynaptic to the vCH-cell (see Figure 3). The overall goal was to determine how the different input elements of the vCH-cell contribute to its complex responses during stimulation with naturalistic optic flow. The models comprise the peripheral visual system up to the level of LPTCs (see above). Each model of an LPTC consists of a passive one-compartment membrane patch. The model H1, the model HSS/E, and the model Hu receive input from local EMDs. The models were optimized by a stochastic optimization algorithm to the electrophysiologically determined responses of the respective cell to the retinal input sequences experienced by the fly during a flight sequence (flight sequence A). The root mean square difference between the time-dependent model response and the corresponding experimentally determined mean cell response was used as a quantitative measure of the similarity between model and cell performance. In the following, this similarity is referred to as drms. For comparison, the inter-cell variability was defined as the mean of the root mean square differences between each single cell response and the mean response over all cells. In the following, this measure is referred to as the inter-cell difference. All models mimic the observed time-dependent activities of the corresponding cell type quite well.
Model H1
The time course and STA of the model H1 responses are similar to those of the corresponding cell (see Figure 6). The model H1 achieves a drms of 18.6 spikes/s, which is smaller than the experimentally determined inter-cell difference of 38.5(±11.2 SD) spikes/s (n = 4). The model performance when only parts of the model’s receptive field were exposed to stimulation is still quite good, although the model parameters were not optimized for these conditions. Covering the frontal part of the visual field reduces the response amplitudes of both the model and the cell response, whereas masking of the right side leaves the responses unchanged compared to the unmasked stimulation. Stimulating the model only in the frontal visual field elicits a model response similar to the cell’s response, although with a slightly lower amplitude. Still, the amplitude is within the range of experimentally measured response variability (see Figure 6C right). A reason for this minor discrepancy might be an underestimation of the H1 cell’s sensitivity in the frontal visual field.
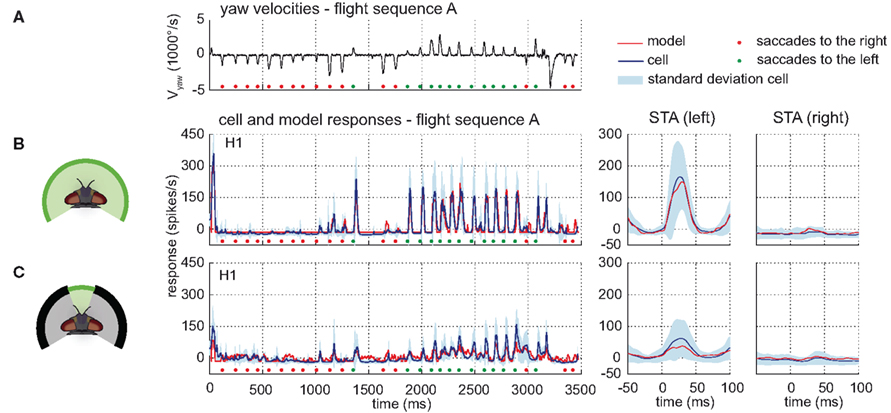
Figure 6. Model performance H1-cell. Electrophysiologically measured and modeled responses of the H1-cell to naturalistic motion stimulation of different parts of the visual field. (A) Head yaw velocities plotted against time for flight sequence A. (B,C) Responses and STAs of the left H1-cell (blue) and model (red) to flight sequence A and different parts of the visual field stimulated as depicted at the left of each row. All further color and sign codes as in Figure 4.
Model HS
The model HSS and the model HSE receive input from retinotopically arranged motion detectors. The models’ receptive fields cover the field of view of the right eye. The model HSE receives additional input from the left model H1. Due to the similarities between the overall functional properties of the H1-cell and the H2-cell, a model for H2 is expected to be similar to the model H1 and thus, for simplicity, is omitted.
The models reach a drms within the range of the inter-cell difference. The model HSE achieves a drms of 2.89 mV whereas the inter-cell difference of the HSE-cell (n = 5) amounts to 2.83 mV (±1.21 mV). The performance of the model HSS results in a drms of 3.38 mV. The inter-cell difference of the HSS-cell (n = 7) is 2.70 mV (±1.08 mV). The responses of both models have time courses similar to those of the corresponding cells, and are for each time step mostly within the range of inter-cell variability (see Figures 7B,C).
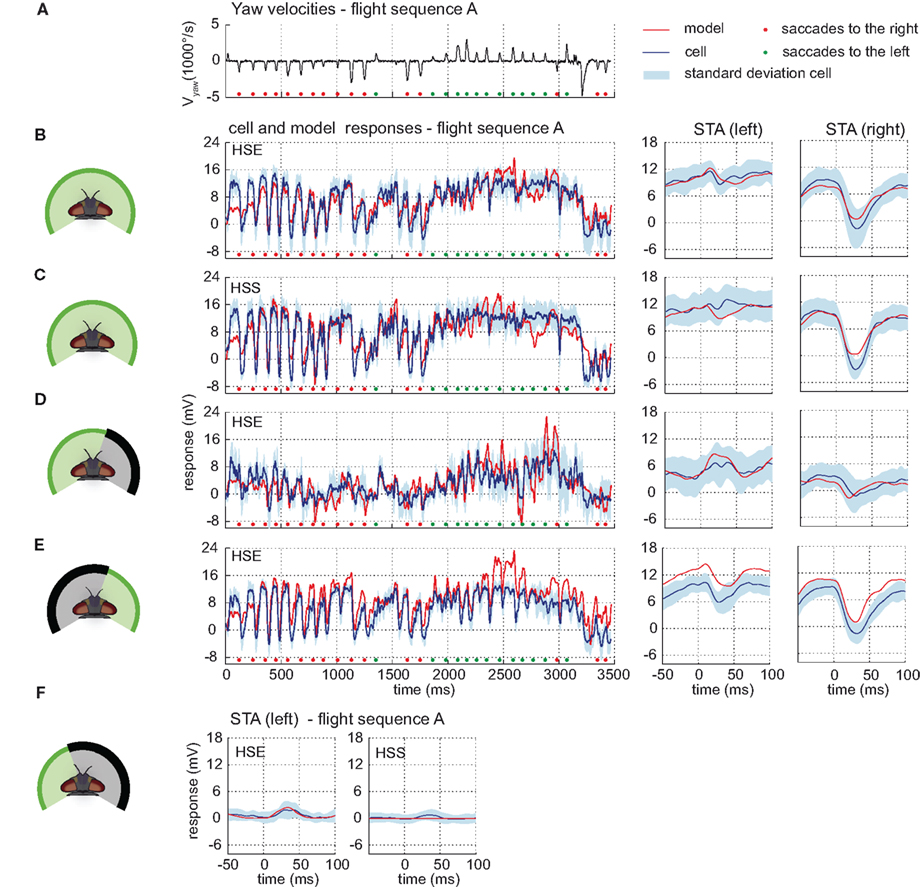
Figure 7. Model performance HS-cells. Electrophysiologically measured and modeled responses of the HSS- and HSE-cell to naturalistic motion stimulation of different parts of the visual field. (A) Head yaw velocities plotted against time for flight sequence A. (B) Responses and STAs of the right HSE-cell (blue) and model (red) to flight sequence A to full stimulation. (C) Responses and STAs of the right HSS-cell (blue) and model (red) to flight sequence A to full stimulation. (D,E) Responses and STAs of the right HSE-cell (blue) and model (red) to flight sequence A and different parts of the visual field stimulated as depicted at the left of each row. (F) STAs of the right HSE- (left) and the right HSS-cell (right) and of the corresponding models (red) for saccades to the left while the left part of the visual field is stimulated by flight sequence A. All color and sign codes as in Figure 4.
The models also mimic quite well the responses of the HSE-cell and the HSS-cell when parts of the visual field are covered. When the right part of the field of view is covered, the responses of the models and of the cells have similar time courses and STA. Compared to the responses to the full stimulus, both model and cellular intersaccadic responses are decreased when the lateral part of the right eye is covered, while being less affected during saccades (shown for HSE in Figure 7). Compare STA in subplots C and D. The middle section of the plotted STA relates to the saccades, whereas the outer parts relate predominantly to translatory phases during the intersaccadic intervals.) The difference between the responses indicates a high contribution of the lateral visual field to the HS-cells response during translatory motion.
After masking the frontal and left visual field, motion elicits the same response characteristic in the models and in the cells. Both translatory motion during the intersaccadic intervals and saccadic turns in the preferred direction elicit depolarization or strong depolarization, respectively. Turns in the null direction lead to negative response peaks (see Figure 7E, early and late parts of the STA relate predominantly to translatory phases during the intersaccadic intervals). Despite this common characteristic, the model responses are shifted to more depolarized levels than the cellular responses, indicating that the impact of the ipsilateral field of view in the models is possibly too strong.
The input to the model HSE from the model H1 turned out to be weak and has only a small impact on the model HSE performance. However, it is strong enough to account for the weak response during preferred direction saccades while the frontal and right part of the visual field are masked (see Figure 7F).
Model vCH
The model vCH integrates the outputs of a model H1, a model Hu, a model HSS, and a model HSE. Due to its similarities to the H1-cell, the H2-cell was omitted as an input element to the model vCH (see above). The model vCH achieves a drms of 1.38 mV which is smaller than the inter-cell difference of 2.03 mV (±0.17 mV, n = 3). Accordingly, the model time course follows the cell time course and lies mostly within the cellular variability range. Consequently, the STA of the model and cell responses do not differ much (see Figures 8A,B). The model vCH does not only account for the responses to the optic flow experienced during the different flight sequences, it also reflects characteristics of the vCH-cell responses when only selected parts of the receptive field are exposed to stimulation. When only the right field of view is stimulated, the model does not depolarize during preferred direction saccades, which matches the corresponding neural responses (Figure 8C). Both the model and the cell show a drop in membrane potential after saccadic turns in the null direction (Figure 8C). A conspicuous overall depolarization of the model response to this stimulus is paralleled by a similar overall depolarization of the model HS.
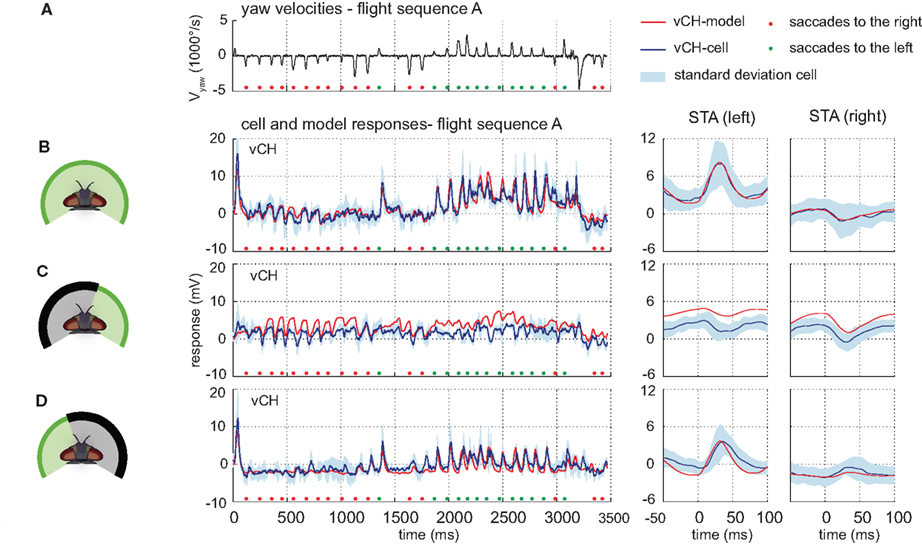
Figure 8. Model performance vCH-cell. Electrophysiologically measured and modeled responses of the vCH-cell to naturalistic motion stimulation of different parts of the visual field. (A) Head yaw velocities plotted against time for flight sequence A. (B) Responses and STAs of the right vCH-cell (blue) and the model vCH (red) plotted against the time for flight sequence A during full stimulation. (C,D) Responses and STAs of right vCH-cell (blue) and model (red) to flight sequence A. The stimulus is limited to the right part (C) or the left part (D) of the visual field, respectively.
The model response to stimulation of the left side alone shows the same characteristics as observed in the cell. The time course of the model response follows the time course of the corresponding cellular response leading also to similar STAs (see Figure 8D). The pronounced depolarizations during saccades to the left indicate that the model reflects the input from H1 (and H2) properly.
Model Performance in Control Flight Sequences
The model can predict responses to visual input from control flight sequences, i.e., visual input for which the model parameters have not been optimized. The models of all cells do not only account for the responses to the optic flow generated on flight sequence A – the performance of the models has a similar quality for the control flight sequences B and C (shown for sequence B in Figure 9).
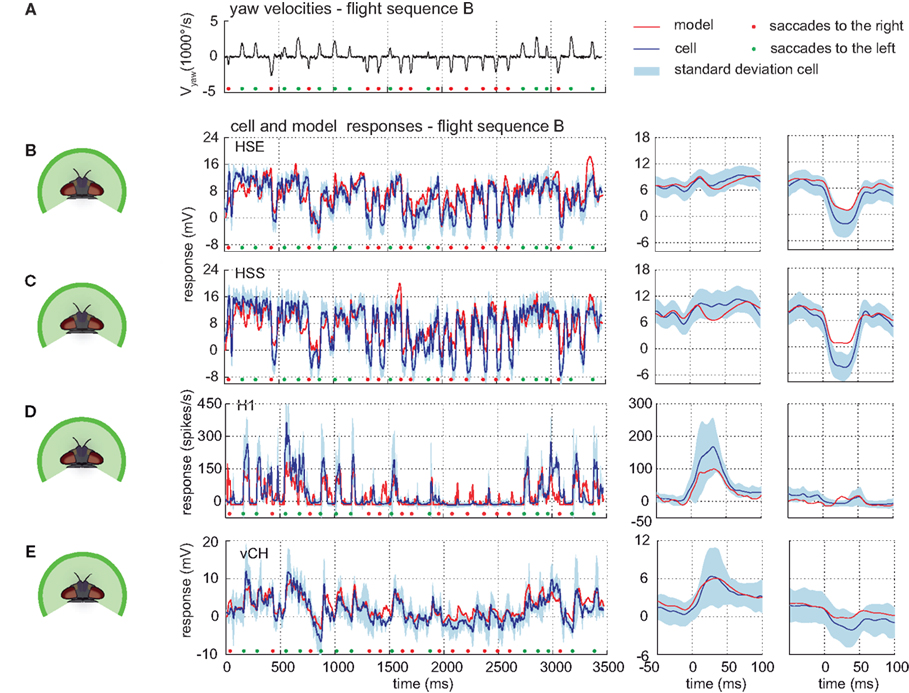
Figure 9. Responses to control flight. Electrophysiologically measured and modeled responses of the HSS-, HSE-, H1-, and vCH-cell to naturalistic motion stimulation. (A) Head yaw velocities plotted against time for flight sequence B. (B–E) Responses and STAs of cells (blue) and models (red) to flight sequence B to full stimulation. All color and sign codes as in Figure 4.
Interactions between Different Input Areas
The performance of the models of the different cells in the input circuit of the vCH-cell during stimulation of various combinations of sections of the visual field reflects the interactions between the different input areas of this cell. In order to assess to what extent these interactions are linear we compared the superposition of responses to separate stimulation of parts of the visual field with the response to the joint stimulation.
In the H1-cell, none of the three parts of the visual field on its own has (under the conditions of our experiment) the impact to elicit response amplitudes similar to those obtained during full stimulation, although the shape of the responses is similar (see above). Superposition of responses to separate stimulation of parts of the visual field indicates rather that the integration of inputs from different parts of the receptive field is linear in the H1-cell. Linear superposition of the responses under masked conditions results in responses similar to the experimentally measured responses under the unmasked condition. As an example, the linear superposition of the response to stimulation of the lateral left visual field and the response to stimulation of the frontal and lateral right visual field is shown in Figure 10A. Slight differences are found at low response amplitudes. Here, differences are expected, because the spike frequency cannot drop below zero and stimulation of only part of the field of view may not always have enough impact to depolarize the cell above its spike threshold. Every linear superposition of the model H1 responses under masked conditions is similar to the response under the unmasked condition (see Figure 10B).
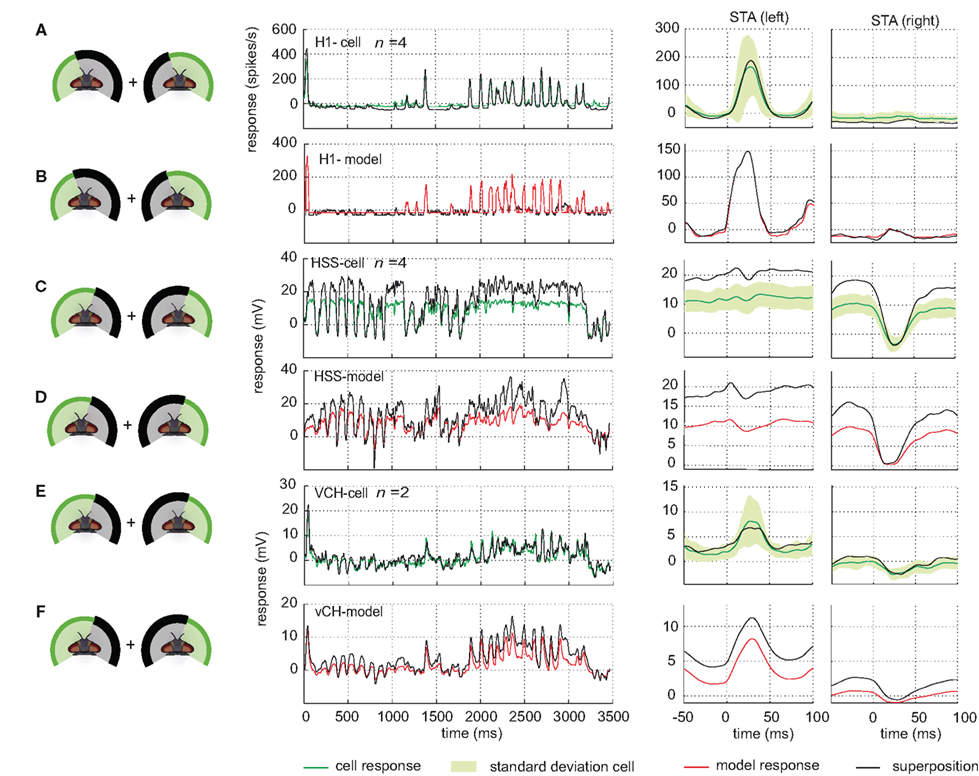
Figure 10. Response superposition. Comparison of cell and model responses to full stimulation and linear superposition of responses to partially stimulated visual field. For superposition, stimulus conditions are used which jointly add up to full stimulation, as depicted at the left side of each row. For all conditions, stimuli are based on flight sequence A. (A) Left H1-cell response to full stimulation (green) and response superposition (black) plotted against time. Right: corresponding STAs to saccades to the left and to the right, respectively, displayed with same color code. The standard deviation of the responses to full stimulation is shown in light green. (B) Model H1 response to full stimulation (red) and response superposition (black) plotted against time. Right: corresponding STAs with the same color code as used in (A). (C,D) Comparison shown for the right HSS-cell (C) and the model HSS (D) with color codes as above. (E,F) Comparison shown for the right vCH-cell (E) and the model vCH (F).
The interactions between the different parts of the receptive field of HS-cells differ from those in the H1-cell. The superimposed responses to motion in the frontal and the lateral right part of the visual field are larger than the response obtained with the unmasked, full stimulation (shown in Figure 10C for the HSS-cell and one superposition). The sum of the responses to stimulation of the lateral left visual field and of the right eye is, in contrast, similar to the response to full stimulation. For this superposition we find a small difference between the HSS-cell and the HSE-cell. While the right HSS-cell is mostly unaffected by motion in the left field of view, the HSE-cell superpositions hint at an input from the left side (data not shown). The HS models share these superposition properties. Combining, the model responses to separate stimulation of parts of the visual field, leads to considerably higher responses than to full stimulation (shown for one superposition in Figure 10D).
These higher superposition responses observed in cell and model are expected from what we call the gain control properties of these cells. They are reflected by the saturation levels of the cell with increasing pattern size that differ for different velocities of pattern motion (Borst et al., 1995).
As seen above, the HS-cells contribute a decisive component to the vCH-cell input. This finding leads us to expect that the superposition of vCH-cell responses to the different masked stimulus conditions is higher than those to the unmasked condition, as observed in the HS-cells. However, the superposition of vCH-cell responses, when different parts of the receptive field were masked, fit in all cases the response to full stimulation (shown for one superposition conditions in Figure 10E). This finding is consistent with former experiments with experimenter designed stimuli (Egelhaaf et al., 1993). One might think that the other input elements of vCH may compensate for this difference in the superposition results between HS and vCH. Hu seems to be a suitable candidate to account, at least partly, for the difference. However, the model vCH, which gets input from the model Hu, does not share the superposition properties of the vCH-cell (see Figure 10F). The vCH-model behaves like the HS-cell in the superposition experiments as shown above.
Despite some differences, the model vCH performance confirms the conclusions drawn from the electrophysiological recordings from the H1-cell, the HS-cells, and the vCH-cell. For stimulation with naturalistic optic flow, the model vCH generates response time courses similar to those of the vCH-cell. Whereas the properties of the vCH-cells are reflected quite well by the model vCH during full stimulation, stimulation of only parts of the visual field and superposition of the corresponding responses hint at interactions not grasped by the current vCH-model.
Discussion
We analyzed the computation of visual information from both brain hemispheres during naturalistic stimulation by investigating the contribution of different input elements and different parts of the visual field to the complex responses of the vCH-cell, an identified motion-sensitive interneuron in the blowfly’s visual system. The analysis was done by model simulations of the vCH-cell and its various input elements. The modeling was based on extensive electrophysiological experiments. Behavioral data of freely flying flies were used to construct naturalistic image sequences, which we used for stimulation. These image sequences reflect the fly’s typical saccadic flight strategy which separates translatory and rotatory motion components. The naturalistic stimulation is dominated by forward translation and rotations around the vertical head-axis.
Contribution of Input Elements
Based on models of its most important input elements, a feed forward model of the vCH-cell was developed which is able to mimic the time course of the cell’s electrophysiologically determined time-dependent responses to the optic flow that is generated on the fly’s eyes during free-flight maneuvers. The saccadic flight strategy is particularly reflected in the characteristic responses of the analyzed cells and the corresponding models. The vCH-cell achieves the biggest depolarizations during saccadic turns that lead to image displacements in the cells’ preferred directions. In the model these depolarizations are mediated by the contralateral H1-model. Because of similar properties (Horstmann et al., 2000; Haag and Borst, 2003) of the H1-cell and the H2-cell we lumped both into one model cell.
As a consequence, (1) the relative contribution of either cell to the overall vCH response and (2) the relevance of the different location of the output terminals of H1- and H2-cell on the vCH-cell remain unresolved. Nevertheless, the model suggests that the pronounced responses of the left H1- and H2-cell to fast turns to the left can account for the corresponding saccadic depolarizations of the right vCH-cell.
The size of the depolarizations during saccades is clearly larger than that during translatory flight. This finding suggests that information about preferred direction saccades might be functionally important for the vCH-cell. The fly would probably not invest energy into generating pronounced saccadic depolarizations without reason.
Two HS-cells, major ipsilateral input elements of the vCH-cell, reach their highest response level during translatory flight sections. Their contribution to the overall response of the vCH-cell is weaker than that of the H1-cell. Nonetheless, the HS-cells’ impact on the vCH-cell is obvious during translatory flight sections. In accordance with the electric coupling between HS-cells and vCH-cell (Haag and Borst, 2002), the depolarization of the vCH-cell is attenuated when compared to the depolarizations of the HS-cells. The relative contributions of the HSE- and the HSS-cell to the overall vCH-cell response could not be identified in this study. The excitation of vCH is superimposed with an inhibition presumably originating from the Hu-cell, especially during translatory forward motion and during rightward saccades.
Beyond these essential input elements with horizontal preferred directions, the V1-cell with sensitivity to vertical motion is known to project onto the vCH-cell (Haag and Borst, 2003). This cell is assumed to be responsible for the vCH-cell’s sensitivity to downward motion in parts of its frontal receptive field (Krapp et al., 2001). Because the naturalistic flight sequences that were replayed here for visual stimulation are dominated by forward translations and rotations around the vertical eye axis, only a minor contribution of the V1-cell to the vCH-cell response is expected under these conditions. Consistent with this expectation, including V1-responses into our model simulations did not improve the model performance (data not shown).
On the whole, the model cells mimic, within the range of experimentally established variability, the time course not only of the vCH responses, but also the responses of its input elements, the H1-cell and the HSE- and HSS-cell. The models of the different circuit elements perform almost as well even when only parts of the visual field are stimulated, although the model parameters were optimized with full stimulation. This result indicates that the model vCH responses reflect the proper contribution from its different input elements.
Spatial Integration
All analyzed input elements of the vCH-cell integrate visual information from large parts of the visual field. However, stimulation of only parts of the visual field revealed different spatial integration properties of the analyzed cells. Whereas the responses of H1 to stimulation of different parts of the visual field add almost linearly, HS-cells show clear sub-linear addition of responses between different stimulated dendritic fields: linear superposition of responses to partial stimulation of selected regions of the receptive field are always larger than the response to simultaneous stimulation of these regions. These interactions of the responses originating in different parts of the dendrite of HS limit the overall cell response amplitude, most likely as a consequence of the established gain control properties of these cells (Borst et al., 1995).
The contributions of HS-cells and the H1-cell to the vCH-cell response, as reflected in the model, might suggest that the integration properties of the HS-cells are at least partly reflected in the vCH-cell responses. Surprisingly, the physiology revealed different properties: (1) the impact of stimulation of one part of the receptive field of vCH-cell is not affected by stimulation of an additional part, (2) linear superposition of responses to partial stimulation of selected regions of the receptive field is similar to the responses to simultaneous stimulation of these regions. This finding is consistent with observations made when stimulating only lateral parts of the visual field of both eyes with experimenter designed stimuli (Egelhaaf et al., 1993).
This finding hints at computations possibly arising from the spatial structure of the respective cells, which are beyond the scope of the present model. Most importantly, HS-cells are synaptically connected to the vCH-cell via dendro-dendritic gap junctions that lead to a still retinotopic, though spatially blurred, information transmission (Haag and Borst, 2002; Cuntz et al., 2003). This feature is not taken into account in our current version of the vCH-model. Moreover, the recording site in the HS-cells is far away from the connections to the vCH-cell. The analyzed axonal HS-cell signal reflects only a spatially pooled version of the activity distribution in the dendrite near the gap junctions to the vCH-cell. Active processes such as the voltage dependent calcium channels in the HS dendrite (Egelhaaf and Borst, 1995) or conductances in the major dendritic branches of the HS-cells far away from the input site are likely to be essential for the experimentally analyzed axonal HS-cell signal and important for the HS-cell’s spatial integration properties. On the other hand, these active and passive properties of the HS-cells have possibly only a small influence on the signals propagated to the vCH-cell. In addition, the input signals originating from the H1-cell, the HSS-cell, and the HSE-cell might interact in the dendrite of the vCH-cell and thus also shape the vCH response.
Model Abstraction Level
The model circuit possesses a high abstraction level and primarily addresses the contribution of different parts of the visual field and of the different input elements of the vCH-cell to the cells’ overall response. The abstractions concern properties of the network as well as of the individual cells and their response mode.
The cells of the lobula plate are known to be interconnected as a recurrent network (Haag and Borst, 2001; Farrow et al., 2006). However, the present model is entirely feed forward. Nevertheless, differences between the time course of the experimentally determined responses and the model responses are to a large extent in the range of the inter-cell variability. This is possibly a consequence of the stimuli used, which are based on real flight sequences and, for instance do not contain backward translations since such flight situations do not occur naturally in blowflies. For example, the known inhibition of the left H1-cell by the left vCH-cell (which is supposed to be mirror symmetric to the analyzed right vCH-cell) would presumably have the highest impact on the left H1-cell during backward motion. The dominant movements of blowflies during flight are forward translations with some sideward components interspersed by fast saccadic rotations (Schilstra and van Hateren, 1999; van Hateren and Schilstra, 1999; Braun et al., 2010). These movements either do not elicit a clear activity of the H1-cell, or the inhibiting ipsilateral vCH-cell has only a moderate activation level. Under these conditions the recurrences in the circuit are unlikely to have large impacts on the responses.
Our model simulates neural activity as graded membrane potential changes or spike rates, but not individual spikes. Thus, information carried solely by the spike timing is not reflected by the model. Precise timing of spikes is known to be critical in some tasks. For example, auditory systems use the tiny time difference between a sound arriving at the two ears to localize its direction, and thus depend critically on the precise timing of action potentials (Jeffress, 1948; Joris and Yin, 2007). The fly’s visual system, on the other hand, has to deal with signals on a different time scale. Though the fly’s movements are fast, time differences at millisecond-level precision seem unlikely to be functionally relevant. Several studies on the spiking H1-cell suggest that the information rate and coding efficiency are mainly set by the firing rate, rather than by the firing precision (Warzecha et al., 2000; Warzecha and Egelhaaf, 2001; Spavieri et al., 2010; see however de Ruyter van Steveninck et al., 2001). In contrast to their contralateral input elements, i.e., H1, H2, and Hu that are modeled here, the ipsilateral input elements of vCH, i.e., HSE and HSS, but also vCH itself, mainly respond to visual stimulation with graded membrane potential changes (Hausen, 1984).
At its retinal input site, the model elements that mimic the processing in the peripheral visual system are fitted to the luminance conditions of the physiological experiments. In its current version, the model thus does not contain features like adaptation to contrast or luminance changes. This is not expected to be a severe limitation in the context of identifying the contributions of the input elements to the vCH, since all input elements share the same early processing. Detailed models of the peripheral visual processing stages including light adaptation have already been investigated (Juusola et al., 1995; van Hateren and Snippe, 2001). When inserted into the input lines of the movement detectors that are presynaptic to the input elements of the vCH-cell, they seem to be appropriate to adjust models to a wide range of luminance conditions (Brinkworth and O’Carroll, 2009; Wiederman et al., 2010).
Functional Aspects
Computational strategies operating with input from both hemispheres of an animal’s surroundings are used by several animals. The owl’s auditory system, for example, owes its excellent localization ability to the comparison of signals from both ears (Konishi, 2000). Decision-making may profit as well from combining the information from the two hemispheres. The inhibition of dragonfly neurons sensitive to small objects by their contralateral counterparts is thought to be “a neural substrate for directing attention to single targets in the presence of distracters” (Bolzon et al., 2009).
The visual input of the vCH-cell from both eyes presumably has its need in the saccadic flight strategy of the fly. The vCH-circuit is thought to play an important role in behaviors where objects, such as obstacles or landing sites, are to be detected. The vCH-cell is an inhibitory element to the FD1-cell, a cell that responds preferentially to this sort of object (Egelhaaf, 1985; Kimmerle and Egelhaaf, 2000a,b). After combining information from both eyes, the vCH-cell inhibits the FD1-cell and helps to tune this cell to small objects (Warzecha et al., 1993). The inhibition probably takes place via a spatially distributed inhibition of the FD1-cell’s retinotopic input elements (Hennig et al., 2008). The HS-cells and the H1-cell contribute to the network in different ways. The HS-cells mediate the vCH-cell’s ipsilateral motion sensitivity, especially during forward translation. The inhibition of the FD1-cell during saccades to the left might be the main functional significance of the pronounced saccadic responses of the vCH-cell mediated by its H1-input. Without the H1-cell (or the H2-cell) the FD1-cell would otherwise possibly wrongly signal the detection of an object during a saccade, since the FD1-cell responds not only strongly to small objects but also to fast wide-field motion (Egelhaaf, 1985; Kimmerle and Egelhaaf, 2000a,b; van Hateren et al., 2005).
Conclusion
By combining electrophysiological recordings and a computational model of a neuronal circuit we were able to identify the contribution of different input elements and different parts of the visual field to the complex responses of the vCH-cell, an inhibitory neuron in the blowfly visual motion pathway. The model has predictive power as it can account for the neural response to stimuli it was not adjusted to. This is valid for partly masked original stimuli but also for stimuli generated from control flights. The successful performance of the model circuit will allow us to make functional predictions, for example, for experiments where individual elements of the neural circuit are blocked pharmacologically or genetically. Such an experiment on the H1-cell could strengthen the hypothesis that the saccadic responses of vCH mediated by H1 prevents the object sensitive FD1-cell to wrongly signal a small object. Further examinations will include a detailed analysis of the contribution of the vCH-cell and its presynaptic elements to the FD1-cell responses and its role in object detection tasks.
Conflict of Interest Statement
The authors declare that the research was conducted in the absence of any commercial or financial relationships that could be construed as a potential conflict of interest.
Acknowledgments
We are grateful to Norbert Böddeker and Nicole Carey for critically reading drafts of the paper and making helpful suggestions, to Jens Lindemann and Ralf Möller for contributing software, and to Grit Schwerdtfeger for technical assistance. This study was supported by the Deutsche Forschungsgemeinschaft (DFG).
References
Bolzon, D. M., Nordström, K., and O’Carroll, D. C. (2009). Local and large-range inhibition in feature detection. J. Neurosci. 29, 14143–14150.
Borst, A., Egelhaaf, M., and Haag, J. (1995). Mechanisms of dendritic integration underlying gain control in fly motion-sensitive interneurons. J. Comput. Neurosci. 2, 5–18.
Borst, A., Reisenman, C., and Haag, J. (2003). Adaptation of response transients in fly motion vision. II. Model studies. Vision Res. 43, 1309–1322.
Braun, E., Geurten, B., and Egelhaaf, M. (2010). Identifying prototypical components in behaviour using clustering algorithms. PLoS ONE 5, e9361. doi: 10.1371/journal.pone.0009361
Brinkworth, R. S. A., and O’Carroll, D. C. (2009). Robust models for optic flow coding in natural scenes inspired by insect biology. PLoS Comput. Biol. 5, e1000555. doi: 10.1371/journal.pcbi.1000555
Collett, T., and Land, M. (1975).Visual control of flight behaviour in the hoverfly Syritta pipiens L. J. Comp. Physiol. A Neuroethol. Sens. Neural Behav. Physiol. 99, 1–66.
Cuntz, H., Haag, J., and Borst, A. (2003). Neural image processing by dendritic networks. Proc. Natl. Acad. Sci. U.S.A. 100, 11082–11085.
de Ruyter van Steveninck, R., Borst, A., and Bialek, W. (2001). “Real-time encoding of motion: answerable questions and questionable answers from the fly’s visual system,” in Motion Vision, eds J. Zanker and J. Zeil (Berlin: Springer), 279–306.
Eckert, H., and Dvorak, D. R. (1983). The centrifugal horizontal cells in the lobula plate of the blowfly, Phaenicia sericata. J. Insect Physiol. 29, 547–560.
Egelhaaf, M. (1985). On the neuronal basis of figure-ground discrimination by relative motion in the visual system of the fly. II. Figure-detection cells a new class of visual interneurones. Biol. Cybern. 52, 195–209.
Egelhaaf, M. (2006). “The neural computation of visual motion information,” in Invertebrate Vision, eds E. Warrant and D. E. Nielsson (Cambridge: Cambridge University Press), 399–461.
Egelhaaf, M., and Borst, A. (1995). Calcium accumulation in visual interneurons of the fly: stimulus dependence and relationship to membrane potential. J. Neurophysiol. 73, 2540–2552.
Egelhaaf, M., Borst, A., Warzecha, A. K., Flecks, S., and Wildemann, A. (1993). Neural circuit tuning fly visual neurons to motion of small objects. II. Input organization of inhibitory circuit elements revealed by electrophysiological and optical recording techniques. J. Neurophysiol. 69, 340–351.
Egelhaaf, M., Kern, R., Kurtz, R., and Warzecha, A.-K. (2004). “Fly: processing of visual motion information and its role in visual orientation,” in Encyclopedia of Neuroscience, eds G. Adelman and B. H. Smith (Amsterdam: Elsevier).
Exner, S., and Hardie, R. (1989). The Physiology of the Compound Eyes of Insects and Crustaceans: A Study. Berlin: Springer-Verlag.
Farrow, K., Haag, J., and Borst, A. (2003). Input organization of multifunctional motion-sensitive neurons in the blowfly. J. Neurosci. 23, 9805–9811.
Farrow, K., Haag, J., and Borst, A. (2006). Nonlinear, binocular interactions underlying flow field selectivity of a motion-sensitive neuron. Nat. Neurosci. 9, 1312–1320.
Franceschini, N. (1975). “Sampling of the visual environment by the compound eye of the fly: fundamentals and applications,” in Photoreceptor Optics, eds A. Snyder and R. Menzel (Berlin: Springer), 98–125.
Frost, B. J., and Wylie, D. R. (2000). A common frame of reference for the analysis of optic flow and vestibular information. Int. Rev. Neurobiol. 44, 121–140.
Gauck, V., Egelhaaf, M., and Borst, A. (1997). Synapse distribution on VCH, an inhibitory, motion-sensitive interneuron in the fly visual system. J. Comp. Neurol. 381, 489–499.
Haag, J., and Borst, A. (2001). Recurrent network interactions underlying flow-field selectivity of visual interneurons. J. Neurosci. 21, 5685–5692.
Haag, J., and Borst, A. (2002). Dendro-dendritic interactions between motion-sensitive large-field neurons in the fly. J. Neurosci. 22, 3227–3233.
Haag, J., and Borst, A. (2003). Orientation tuning of motion-sensitive neurons shaped by vertical-horizontal network interactions. J. Comp. Physiol. A 189, 363–370.
Hausen, K. (1981). Monocular and binocular computation of motion in the lobula plate of the fly. Verh. Dtsch. Zool. Ges. 74, 49–70.
Hausen, K. (1982a). Motion sensitive interneurons in the optomotor system of the fly. I. The horizontal cells: structure and signals. Biol. Cybern. 45, 143–156.
Hausen, K. (1982b). Motion sensitive interneurons in the optomotor system of the fly. II. The horizontal cells: receptive field organization and response characteristics. Biol. Cybern. 46, 67–79.
Hausen, K. (1984). “The lobula-complex of the fly: structure, function and significance in visual behaviour,” in Photoreception and Vision in Invertebrates, ed. M. A. Ali (New York: Plenum Press), 523–559.
Hennig, P., Möller, R., and Egelhaaf, M. (2008). Distributed dendritic processing facilitates object detection: a computational analysis on the visual system of the fly. PLoS ONE 3, e3092. doi: 10.1371/journal.pone.0003092
Horstmann, W., Egelhaaf, M., and Warzecha, A. K. (2000). Synaptic interactions increase optic flow specificity. Eur. J. Neurosci. 12, 2157–2165.
Ibbotson, M. R. (1991). Wide-field motion-sensitive neurons tuned to horizontal movement in the honeybee, Apis mellifera. J. Comp. Physiol. A 168, 91–102.
Joris, P., and Yin, T. C. T. (2007). A matter of time: internal delays in binaural processing. Trends Neurosci. 30, 70–78.
Juusola, M., Weckström, M., Uusitalo, R. O., Korenberg, M. J., and French, A. S. (1995). Nonlinear models of the first synapse in the light-adapted fly retina. J. Neurophysiol. 74, 2538–2547.
Kern, R. (1998). Visual position stabilization in the hummingbird hawk moth, Macroglossum stellatarum L.: II. Electrophysiological analysis of neurons sensitive to widefield image motion. J. Comp. Physiol. 182, 239–249.
Kern, R., Nalbach, H. O., and Varju, D. (1993). Interactions of local movement detectors enhance the detection of rotation. Optokinetic experiments with the rock crab, Pachygrapsus marmoratus. Vis. Neurosci. 10, 643–652.
Kimmerle, B., and Egelhaaf, M. (2000a). Detection of object motion by a fly neuron during simulated flight. J. Comp. Physiol. A 186, 21–31.
Kimmerle, B., and Egelhaaf, M. (2000b). Performance of fly visual interneurons during object fixation. J. Neurosci. 20, 6256–6266.
Kimmerle, B., Warzecha, A., and Egelhaaf, M. (1997). Object detection in the fly during simulated translatory flight. J. Comp. Physiol. A 181, 247–255.
Konishi, M. (2000). Study of sound localization by owls and its relevance to humans. Comp. Biochem. Physiol. A Mol. Integr. Physiol. 126, 459–469.
Krapp, H. G., Hengstenberg, R., and Egelhaaf, M. (2001). Binocular contributions to optic flow processing in the fly visual system. J. Neurophysiol. 85, 724–734.
Lindemann, J. P., Kern, R., Michaelis, C., Meyer, P., van Hateren, J. H., and Egelhaaf, M. (2003). FliMax, a novel stimulus device for panoramic and highspeed presentation of behaviourally generated optic flow. Vision Res. 43, 779–791.
Lindemann, J. P., Kern, R., van Hateren, J. H., Ritter, H., and Egelhaaf, M. (2005). On the computations analyzing natural optic flow: quantitative model analysis of the blowfly motion vision pathway. J. Neurosci. 25, 6435–6448.
Petrowitz, R., Dahmen, H., Egelhaaf, M., and Krapp, H. G. (2000). Arrangement of optical axes and spatial resolution in the compound eye of the female blowfly Calliphora. J. Comp. Physiol. A 186, 737–746.
Price, K. V. (1999). “An introduction to differential evolution,” in New Ideas in Optimasation, eds D. Corne, M. Dorigo, F. Glover, D. Dasgupta, and P. Moscato (Maidenhead: McGraw-Hill Ltd.), 79–108.
Schilstra, C., and van Hateren, J. H. (1998). Stabilizing gaze in flying blowflies. Nature 395, 654.
Schilstra, C., and Hateren, J. H. (1999). Blowfly flight and optic flow. I. Thorax kinematics and flight dynamics. J. Exp. Biol. 202, 1481–1490.
Spavieri, D. L., Eichner, H., and Borst, A. (2010). Coding efficiency of fly motion processing is set by firing rate, not firing precision. PLoS Comput. Biol. 6, e1000860. doi: 10.1371/journal.pcbi.1000860
Tammero, L. F., and Dickinson, M. H. (2002). The influence of visual landscape on the free flight behavior of the fruit fly Drosophila melanogaster. J. Exp. Biol. 205, 327–343.
van Hateren, J. H., Kern, R., Schwerdtfeger, G., and Egelhaaf, M. (2005). Function and coding in the blowfly H1 neuron during naturalistic optic flow. J. Neurosci. 25, 4343–4352.
van Hateren, J. H., and Schilstra, C. (1999). Blowfly flight and optic flow. II. Head movements during flight. J. Exp. Biol. 202, 1491–1500.
van Hateren, J. H., and Snippe, H. P. (2001). Information theoretical evaluation of parametric models of gain control in blowfly photoreceptor cells. Vision Res. 41, 1851–1865.
Wagner, H. (1986). Flight performance and visual control of flight of the free-flying housefly (Musca domestica). I. Organization of the flight motor. Philos. Trans. R. Soc. Lond. B Biol. Sci. 312, 527–551.
Warzecha, A. K., and Egelhaaf, M. (2001). “Neuronal encoding of visual motion in real-time,” in Motion Vision, eds J. Zanker and J. Zeil (Berlin: Springer), 239–277.
Warzecha, A.-K., Egelhaaf, M., and Borst, A. (1993). Neural circuit tuning fly visual interneurons to motion of small objects. 1. Dissection of the circuit by pharmacological and photoinactivation techniques. J. Neurophysiol. 69, 329–339.
Warzecha, A. K., Kretzberg, J., and Egelhaaf, M. (1998).Temporal precision of the encoding of motion information by visual interneurons. Curr. Biol. 8, 359–368.
Keywords: motion vision, modeling, electrophysiology, network interactions
Citation: Hennig P, Kern R and Egelhaaf M (2011) Binocular integration of visual information: a model study on naturalistic optic flow processing. Front. Neural Circuits. 5:4. doi: 10.3389/fncir.2011.00004
Received: 23 December 2010;
Paper pending published: 13 January 2011;
Accepted: 21 March 2011;
Published online: 04 April 2011.
Edited by:
Takao K. Hensch, Harvard University, USAReviewed by:
Bing Zhang, University of Oklahoma, USAMinmin Luo, National Institute of Biological Sciences, China
Copyright: © 2011 Hennig, Kern and Egelhaaf. This is an open-access article subject to a non-exclusive license between the authors and Frontiers Media SA, which permits use, distribution and reproduction in other forums, provided the original authors and source are credited and other Frontiers conditions are complied with.
*Correspondence: Patrick Hennig, Department of Neurobiology and Center of Excellence ‘Cognitive Interaction Technology’, Bielefeld University, Universitätsstraße 25, D-33615 Bielefeld, Germany. e-mail: phennig@uni-bielefeld.de