
- Department of Biological Science, Columbia University, New York, NY, USA
We performed comprehensive data mining to explore the vomeronasal receptor (V1R and V2R) repertoires in mouse and rat using the mm5 and rn3 genome, respectively. This bioinformatic analysis was followed by investigation of gene expression using a custom designed high-density oligonucleotide array containing all of these receptors and other selected genes of interest. This array enabled us to detect the specific expression of V1R and V2Rs which were previously identified solely based on computational prediction from gene sequence data, thereby establishing that these genes are indeed part of the vomeronasal system, especially the V2Rs. One hundred sixty-eight V1Rs and 98 V2Rs were detected to be highly enriched in mouse vomeronasal organ (VNO), and 108 V1Rs and 87 V2Rs in rat VNO. We monitored the expression profile of mouse VR genes in other non-VNO tissues with the result that some VR genes were re-designated as VR-like genes based on their non-olfactory expression pattern. Temporal expression profiles for mouse VR genes were characterized and their patterns were classified, revealing the developmental dynamics of these so-called pheromone receptors. We found numerous patterns of temporal expression which indicate possible behavior-related functions. The uneven composition of VR genes in certain patterns suggests a functional differentiation between the two types of VR genes. We found the coherence between VR genes and transcription factors in terms of their temporal expression patterns. In situ hybridization experiments were performed to evaluate the cell number change over time for selected receptor genes.
Introduction
Mammals possess at least two independent but interrelated olfactory systems situated in two distinct tissues, the main olfactory epithelium and the vomeronasal organ (VNO). Since the 1970s the VNO has been known to play an essential role in the detection of chemical stimuli of a social nature including pheromones. However, the traditional distinction that the mammalian main olfactory system recognizes general odors and the vomeronasal system detects pheromones is no longer valid. Recent evidence has shown that, in rodents, the detection of pheromones leading to behavioral and endocrine changes relies on the activity of both the main olfactory system and the vomeronasal system. Similarly accumulated evidence has demonstrated that the VNO can detect non-phenomenal odorants and has more diverse functions than previously imagined (Dulac and Axel, 1995; Ryba and Tirindelli, 1997).
The rodent VNO has two distinct compartments of sensory neuronal populations which express two types of receptors, the V1Rs and V2Rs, respectively. The sensory neurons of the apical compartment of the VNO express members of the V1R gene family, which are believed to transduce signals via a coupled Gαi protein; neurons of the basal compartment express members of V2R gene family, which seem likely to transduce signals via a Gαo protein (Dulac and Axel, 1995; Matsunami and Buck, 1997; Ryba and Tirindelli, 1997). Upon receptor activation, signals are relayed through a G-protein-regulated transient receptor potential (trp) ion channel (Liman et al., 1999). The trp2 gene (The β isoform of which is exclusively expressed in VNO neurons) is required for VNO sensory neuronal responses (Hofmann et al., 2000; Stowers et al., 2002).
Like OR genes, vomeronasal receptors (VR) are also G-protein coupled receptors with seven-transmembrane domains, but they belong to two different classes of GPCR. The coding region of V1R genes are ∼1 kb long encoded in a single exon. They are typical Class A GPCRs. V1R receptors, like olfactory receptors, appear to play a dual role: (1) they are expressed on the dendritic endings of vomeronasal sensory neurons where they detect (i.e., bind) ligands that enter the VNO from the outside world and (2) expression of V1Rs, presumably on the axons of the sensory neurons, is necessary for the formation of discrete glomeruli in the accessory olfactory bulb (Belluscio et al., 1999; Rodriguez et al., 1999). Experimental evidence has shown that V1Rs function as receptors for both pheromones and environmental signals, such as those from prey and predators (Hagino-Yamagishi et al., 2001; Sam et al., 2001; Boschat et al., 2002; Del Punta et al., 2002). The genomic structure and expression pattern of V1Rs appear to have undergone rapid change during the process of evolution. Computational data mining results revealed a remarkable V1R repertoire size variation of over 20-fold in placental mammals, corresponding to a functional repertoire size ranging from 8 genes in dogs to nearly 200 genes in mice (Grus et al., 2005; Zhang et al., 2007).
The V2R receptors are of the Class C type of GPCR, characterized by a long N-terminus encoded by multiple exons that are often alternatively spliced. As a result much less is known about the V2R family of receptors since their initial discovery by three groups (Dulac and Axel, 1995; Matsunami and Buck, 1997; Ryba and Tirindelli, 1997). Yang et al. predicted the exon/intron junctions by comparing candidate sequences to cDNAs of known V2Rs. Their results, solely based on computational data mining, identified 61 intact V2R ORFs in mice and 57 in rats (Yang et al., 2005). V2R genes were also identified in other vertebrates, such as frogs and zebrafish. Notably, in contrast with the extremely limited number of V1Rs, zebrafish have over 50 V2R genes (Hashiguchi and Nishida, 2005). However, in the human genome, no intact V2R genes have been found; there appear to be 12 V2R pseudogenes, suggesting that V2Rs have been changing even more dramatically than V1Rs (Kouros-Mehr et al., 2001).
It has been thought that V2Rs function as detectors for non-volatile pheromones. The potential ligands for V2Rs include peptide pheromones such as mouse major urine proteins (MUPs), major histocompatibility complex (MHC) peptides, and exocrine gland-secreting peptide (ESPs) (Krieger et al., 1999; Leinders-Zufall et al., 2004). V2R receptors co-express and interact with MHC molecules, mainly MHC class I M10 and M6 families (Ishii et al., 2003; Loconto et al., 2003). In addition, ESPs, a category of pheromone modulated through facial contacts (and thought to be contained in saliva and tears), function as sex-specific pheromones mediated by V2Rs. Male-specific ESP1, which is recognized by the specific receptor, V2Rp5, can induce c-Fos expression in V2R-expressing neurons in female mice (Kimoto et al., 2005, 2007). These studies provide direct evidence of interactions between peptide pheromones and single V2Rs, indicating a narrow ligand spectrum for individual VR. V2Rs for other peptide pheromones remain to be identified.
Materials and Methods
Ethics Statement
All animal work were conducted according to Columbia University institutional animal care guidelines. Animals were anesthetized by a combination of Ketamine and Xylazine before sacrifice.
Array Probe Design
Polyadq (Tabaska and Zhang, 1999) and Genescan (Burge and Karlin, 1997) were used to predict the polyA sites. For mouse genes, all positive and negative predictions by polyadq were selected; for rat genes, only positive ones were used. About 700 nt sequences upstream of each selected putative polyA site were used to select specific probe sets with consultation from Affymetrix Genechip designing group. All probe sequences are pruned against their proprietary databases for specificity. Each probe set was given a score to indicate it quality. Designed probe sets were screened and selected manually before being submitted to Affymetrix for array production.
Tissue Preparation
All mouse tissues were prepared from C57/BL6 mice (The Jackson Laboratory) and all rat tissues were collected from BN rats (Taconic) according to protocols described in the Expression Analysis Technical Manual (Affymetrix). Aging mice at 18 month were ordered from NIA.
Data Analysis
We used DCHIP software (version 2004 and 2008) to do the normalization and model-based expression value calculation. Based on invariant difference selection (IDS) algorithm, invariant probe sets were chosen for normalization between different samples. The PM-MM difference model was applied for expression value calculation. When comparing different tissues, expression values obtained from DCHIP were exported, SAM (significance analysis of microarrays) which was added in Microsoft EXCEL was applied to do differential analysis. Two-class unpaired analysis with logged values was accomplished after permutation for 200 times. False discovery rate (FDR) was used as one of the cutoff criteria. To classified genes as being enriched in any tissue, two other tissues were used as references for comparison. For example, to identify VRs enriched in VNO, VNO samples were compared to OE and brain respectively. Positive probe sets with FDR less than 1% from SAM were selected, following by checking the present calls assigned by MAS5.0 (Affymetrix software). Probe sets only have absent calls in all five VNO samples were excluded. Those selected probe sets that were not overlapped between VNO-OE and VNO-brain comparisons were selected if they have four present calls out of five samples. The detailed criteria used to classify VRs enriched in other non-VNO tissues are in the Supplementary Material.
To analysis the time course data, only VNO samples at different time points were grouped for normalization and model-based expression value calculation in DCHIP. Raw expression values were exported to EDGE software for differential analysis. For each gene, only one representative probe set was chosen for pattern analysis based on the score given by SAM. Genes without significant change (p-value cutoff at 0.05) over time course were excluded. We used the bioinfomatics toolbox in Matlab to standardize the expression value at different time points. For each gene, the mean of all time points was standardized to zero, z-score was smoothed by factor 0.9 considering the variation of data for each time point. K-means clustering function in Matlab was used for pattern classification. We did trial and error test to set the number of clusters at the beginning, then calculated the Pearson correlation (PC) between any two clusters. Clusters with PC value lower than 0.6 were merged into one until no merging is necessary.
In situ Hybridization
Chromogenic in situ hybridizations were performed on 10 μm thick coronal sections of mouse VNO as described in Ishii et al. (2004) with the following considerations. Probes targeting VR were labeled with digoxigenin (Roche, Mannheim, Germany). Digoxigenin-labeled probes were detected using BCIP/NBT Color Development Substrate (Promega, Madison, WI) according to the instructions of the manufacturer. Sections were mounted in Vectamount AQ (Vector Laboratories, Inc., Burlingame, CA). VR probe templates, were generously provided by Peter Mombaerts Lab (Max Planck Institute, Frankfurt, Germany) (Rodriguez et al., 2002; Ishii et al., 2003).
Microscopy
Tissue sections were imaged on an Olympus confocal microscope (Olympus FluoView 600) and analyzed by using Adobe Photoshop. Images were not modified other than to balance brightness and contrast. Showed here are representative images for each experiment.
Results
Data Mining of V1R and V2R Genes
We performed comprehensive data mining for V1R and V2R repertoires for both mouse and rat in the updated genomes from UCSC1. Pursuing a similar method as Zhang (Zhang and Firestein, 2002), we conducted exhaustive TBLASTN searches to ensure high sensitivity for putative V1R/V2R sequences using known mammalian V1Rs/V2Rs as queries. To update the mouse V1R repertoire, a high-speed BLAT tool was used to replace TBLASTN to perform searches in the updated version of genome assembly. The output sequences were subject to a series of further analyses incorporating conceptual translation, profile HMM searches and BLASTP searches to determine which were reliable V1R/V2R sequences. FASTY3, along with a database of ∼170 previously identified rodent full-length V1Rs, was used to perform conceptual translation to identify the coding region of all candidate V1Rs. The identified rodent full-length V1Rs were also used to build an HMM model for profile searches to determine the probability that these are true V1Rs. For V2Rs, with five upstream exons, we used only the transmembrane (TM) domains of known V2Rs to investigate the putative sixth exon of V2Rs, thus eliminating the high FDR likely to be associated with the upstream exons. Except for the initial TBLASTN search, which was done using the Ensembl server2, all other analysis steps were automated by investigator-developed programs (for details, see Materials and Methods).
From the comprehensive data mining, we identified the nearly complete V1R repertoires for mouse and rat, which contain 308 and 186 genes respectively (see Table 1: V1R and V2R gene3). However, of this number, pseudogenes constitute a high percentage (∼38%) of the V1R repertoires in both species, resulting in 191 and 115 intact genes for mouse and rat respectively. Using the same strategy, we explored the TM domains of V2Rs in rodents. One hundred twenty-three mouse V2Rs with intact TMs were found, while 101 V2Rs with intact TMs were identified in rat. Compared to the V1Rs, these V2R TMs have an even higher percentage of pseudogenes at ∼60%. We used the same criteria to define pseudogenes versus intact genes for ORs, V1Rs, and V2R TMs (Zhang and Firestein, 2002): they contain no less than two frame-shifts or stop codons within the coding region. Compared to ORs, where pseudogenes consist of ∼18% in mouse and ∼13% in rat, V1Rs and V2R TMs have a much higher percentage of pseudogenes. This is not due to genome sequence quality since the same genome version was used in the data mining, but probably due to distinct processes of evolution for the three gene families. Another possible reason is that the V1R/V2R gene families are very diverse, and some sequences are too distinct from the known V2Rs to be annotated as intact genes. In this case, a frame-shift was wrongly added to the sequence to make it more V1R/V2R-like. Thus, it should be noted that the size of V1R/V2R repertoires could be underestimated if some highly specific V1R/V2R genes exist.
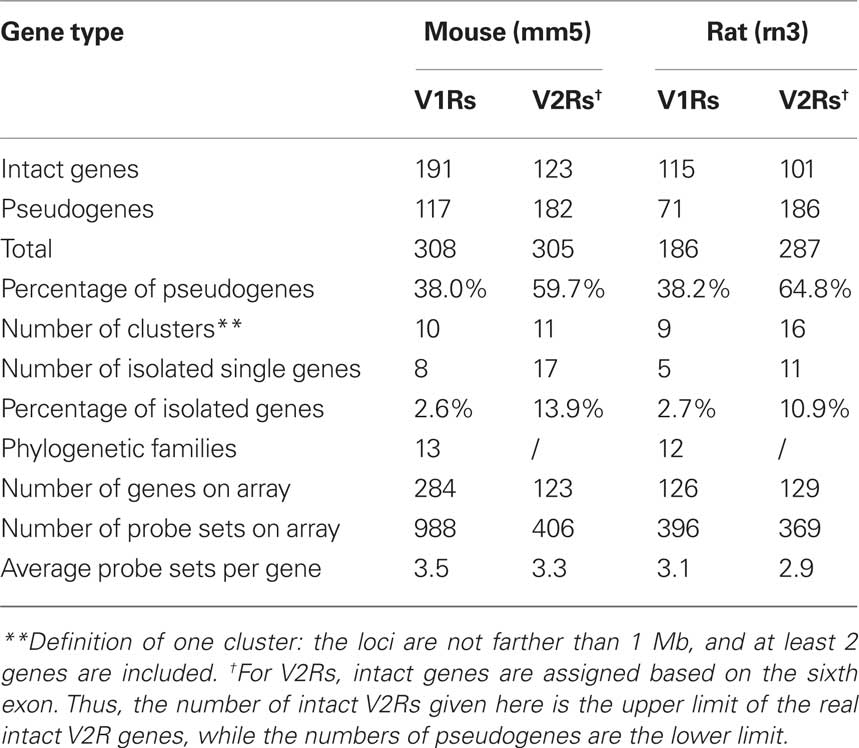
Table 1. Summary of genomic data mining and probe design for V1R/V2R genes.
We explored only the TMs of V2Rs instead of the full-length because we aimed to increase the sensitivity of gene prediction at the first step which would then be verified by microarray experiments at the second step. We compared our data mining results for V2Rs with Yang et al.’s (2005) publication in which 61 intact mouse V2Rs and 57 intact rat V2Rs were identified through computational methods. The overlap between our results is shown in Figure S1 in Supplementary Material. Include a statement of what it is here. As we designed our custom array before their publication, we are not able to verify those non-overlapped genes through our custom arrays.
Genomic Characteristics of V1R/V2R Genes
In the mouse mm5 assembly, 253 V1Rs and 106 intact V2R TMs are mapped to specific genomic locations, while 53 V1Rs and 17 V2R TMs could not be mapped. For V1Rs, the 253 mapped genes are found on five chromosomes. However, the 106 V2R genes are dispersed on 12 chromosomes (Figure 1A). In terms of genomic location, most of the mouse V1Rs form 10 clusters while 8 genes (2.6%) are solitary. The V2Rs form 11 clusters with 17 solitary genes (13.9%). Thus by genomic location, mouse V2R genes are more dispersed on chromosomes and clusters than the V1R genes.
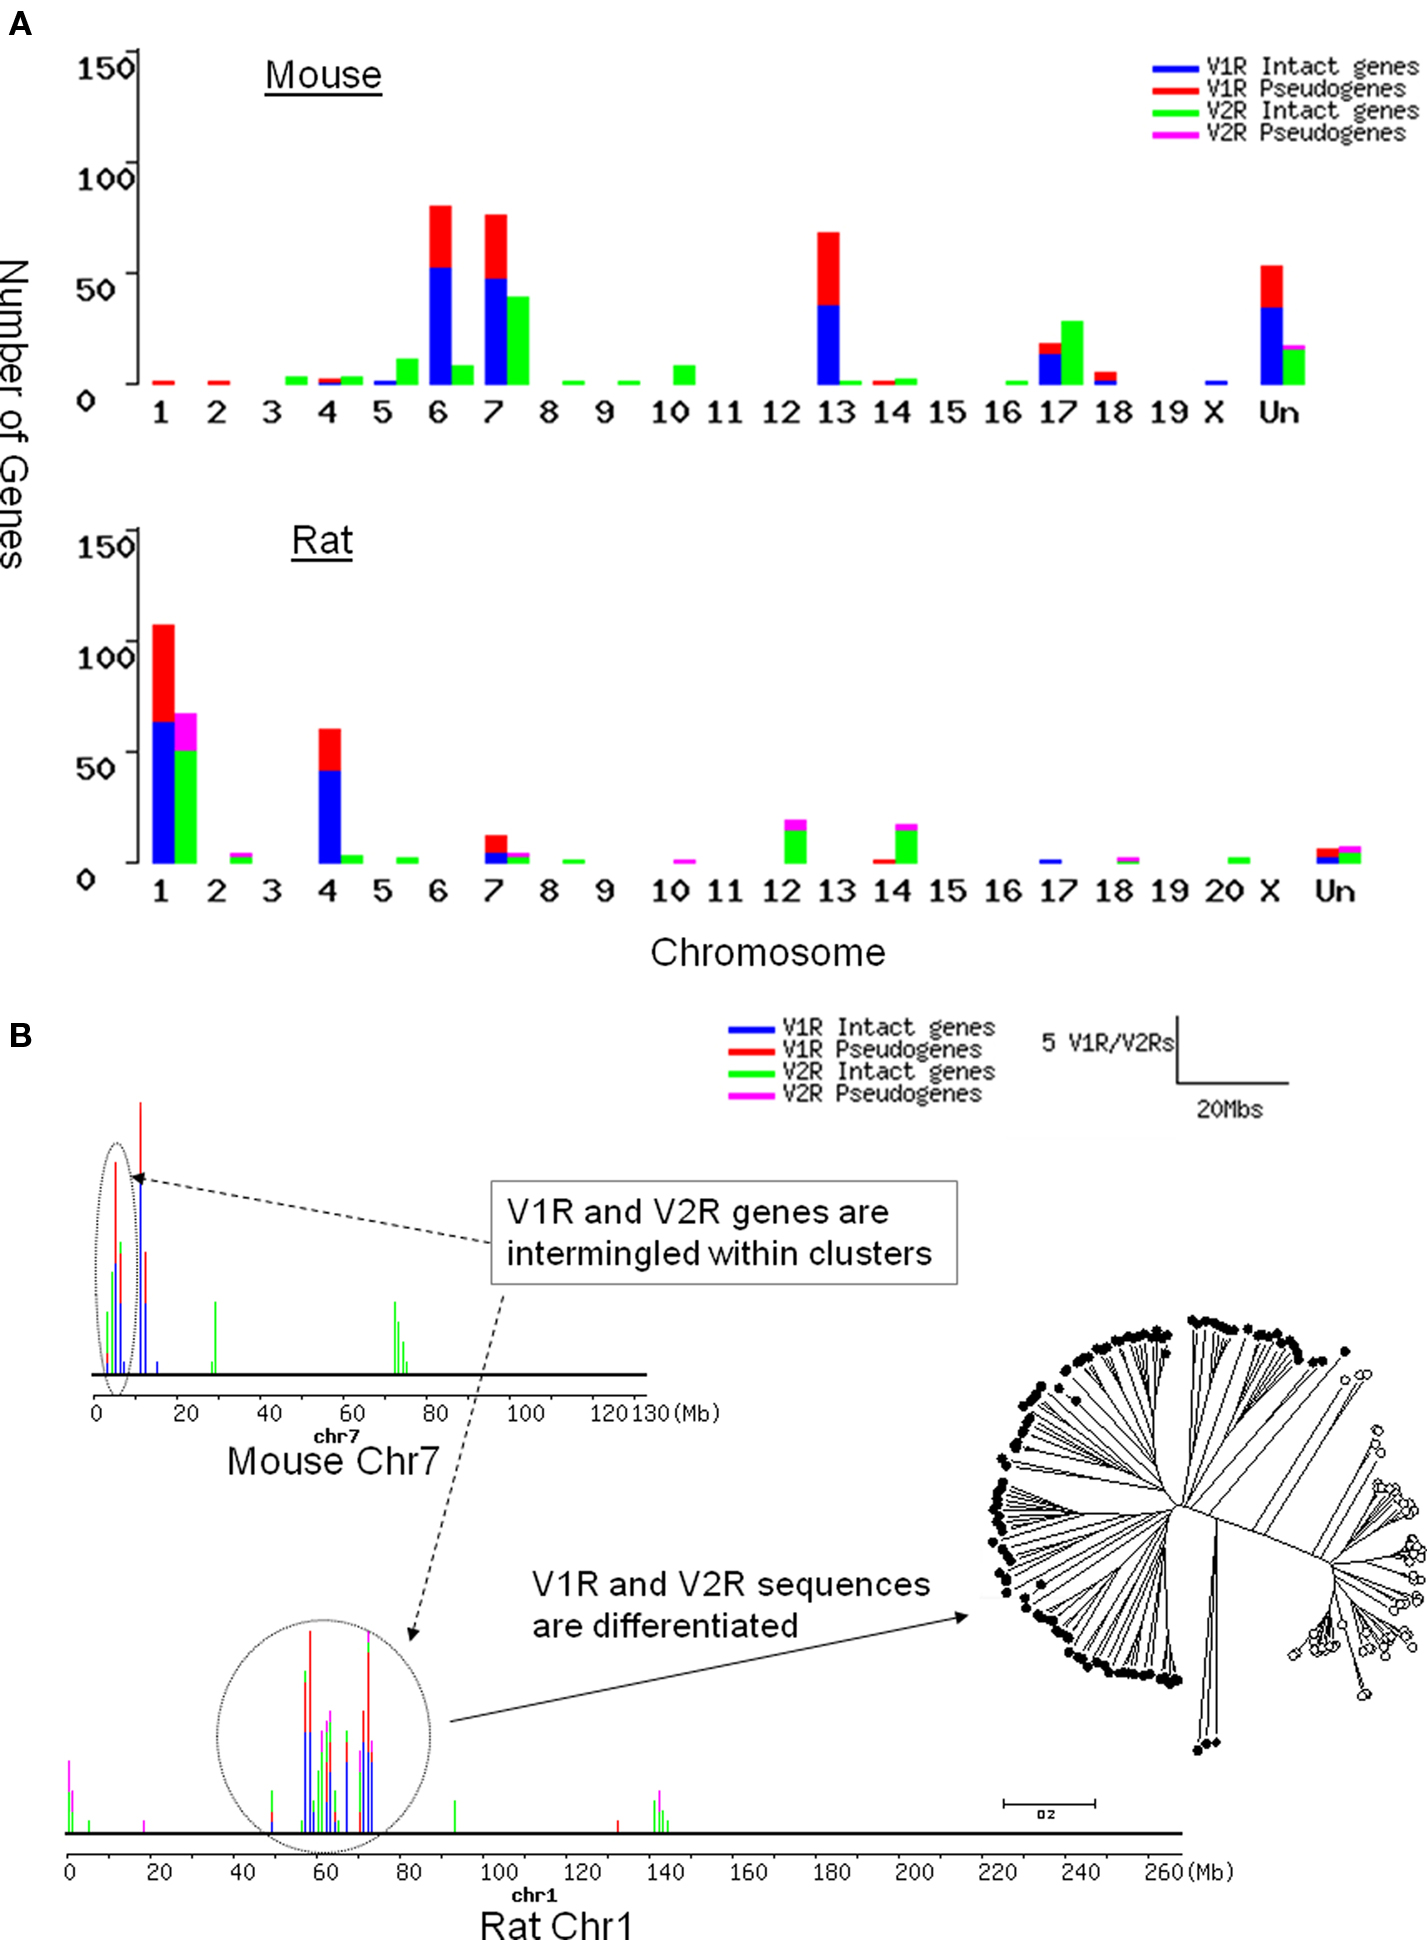
Figure 1. Chromosomal distribution of rat and mouse V1R/V2R genes. Blue, intact V1R genes; red, V1R pseudogenes; green, intact V2R TMs; purple, V2R pseudo-TMs. (A) The number of OR/V1R genes on each chromosome of mouse (top) and rat (bottom). “Un” represents the sequences unmapped in current mm5 and rn3 assembly. Even though there are fewer V2Rs than V1Rs in rodents, V2R genes are dispersed on more chromosomes than V1Rs. (B) V1R and V2R genes are intermingled with each other in clusters, which does not occur between VRs and ORs. The number of V1R/V2R genes per 1 Mb is shown as bars on each chromosome. The height of each bar is proportional to the number of genes in that locus. Rat chromosome 1 and mouse chromosome 7 are drawn according to the rn3 and mm5 assembly respectively. The number of V1R/V2R genes per 1 Mb is shown as bars on each chromosome. The ellipse and circle in dotted line are drawn to point out the cluster with intermingled V1Rs and V2Rs. Phylogenetic tree with VRs in the circled cluster on rat chromosome 1 was drawn to illustrate that their sequences are still differentiated clearly as V1R or V2Rs, even though their genomic locations are intermingled.
In the rat rn3 assembly, 181 V1Rs and 96 intact V2R TMs are mapped to definite genomic locations, while only 5 V1Rs and 5 V2R TMs could not be mapped. The mapped 176 V1Rs are located on five chromosomes. However, 96 V2Rs are dispersed over 11 chromosomes (Figure 1B). Rat V1Rs form 9 clusters with 5 solitary (2.7%) genes. Rat V2Rs form 16 clusters with 11 solitary genes (10.9%). Similar to the mouse V1R/V2R genes, rat V2R genes are more dispersed on chromosomes and clusters than V1R genes.
Evolutionary analysis indicated that OR genes, which form extremely tight clusters on chromosomes, have expanded through recent duplications (Niimura and Nei, 2003). Our finding that V2R genes are more dispersed than ORs and V1Rs, suggests that they could be the most ancient chemosensory receptors, which is also supported by the fact that fish possess a relatively large family of V2Rs (Hashiguchi et al., 2008). We examined the details of VR gene distribution within each cluster. To our surprise, we found that V1R genes intermingle with V2Rs within one cluster, which never occurs between OR and VR genes. Sequence analysis with those intermingled VR genes revealed that their sequences are clearly differentiated (Figure 1B).
Expression of V1R/V2R Genes in Mouse and Rat VNO
Because the majority of VR sequences were obtained through computational prediction, it remains possible that some of them do not function as VRs as they are not expressed in vomeronasal tissue. Their specific expression in the sensory organ would confirm their identity as chemosensory receptors. Using the same strategy we employed for the ORs, we designed multiple probe sets for VR genes with full coverage on our custom array. After extensive tests for optimization and quantification, our custom array proved to be a sensitive and reliable tool to detect VR expression efficiently.
In the first generation MOR array, only about 40 V1Rs were classified as enriched in VNO because no UTR probes were designed for V1R genes, which may have lead to high false negative results for mRNAs with a long 3′UTR. In our second version array, we improved the probe design and increased length coverage for 3′UTRs. The polyA site predictions by polyadq and Genscan were combined to decrease false negatives. Predictions that are less than 500 bp away from each other were merged into one. In summary, on our custom MOR array, 988 probe sets were designed to represent 284 mouse V1R genes which have no more than five frame-shifts and stop codons within their coding regions. Thus on average, about three to four probe sets were selected for each mouse V1R (see Table 1). Four hundred six probe sets were designed for 123 mouse V2Rs which have intact TMs, at similar coverage as the V1Rs. Not knowing the correct polyA site for each gene, we included probe sets close to each putative polyA site to provide the highest likelihood that an expression signal would be observed. Using the same strategy and technique, we designed a second array which contains VR genes for rat and OR genes for four mammalian species: rat, canine, chimpanzee, human. Because of space limitations, only those rat VR genes which have no more than two frame-shift and stop codons are included on the array, with lower probe coverage than mouse. For rat genes, negative predictions by polyadq were not considered for UTR probe design, which may result in a higher false negative rate than for the mouse genes.
VR genes and other signal transduction genes that have been examined thoroughly by biological experiments were used as positive controls. Genes involved in vomeronasal signal transduction, such as Trp2, are found to be exclusively expressed in VNO, but not in olfactory epithelium and other tissues. Another olfactory specific gene, olfactory marker protein (OMP), known to be expressed only in olfactory tissues, is clearly observed by our custom array in olfactory epithelium, VNO and olfactory bulb, but not in other non-olfactory tissues. Housekeeping genes, such as ß-actin and GAPDH, are expressed in all tested tissues at comparatively consistent levels. We also randomly selected several V1R and V2R genes which were verified by in situ hybridization in other laboratories. As anticipated, all of them are highly expressed in VNO, but not in other tissues (Figure 2A). In our second array (rat), only receptor genes are included. We randomly selected known rat VR genes as positive controls. As expected, all of them are enriched in VNO compared to OE while housekeeping genes are expressed equally in both tissues (Figure 2B). Overall, these results show that our array design, combined with optimized tissue preparation and data analysis methods, enabled us to reveal biological expression signals, even for genes at a low expression level.
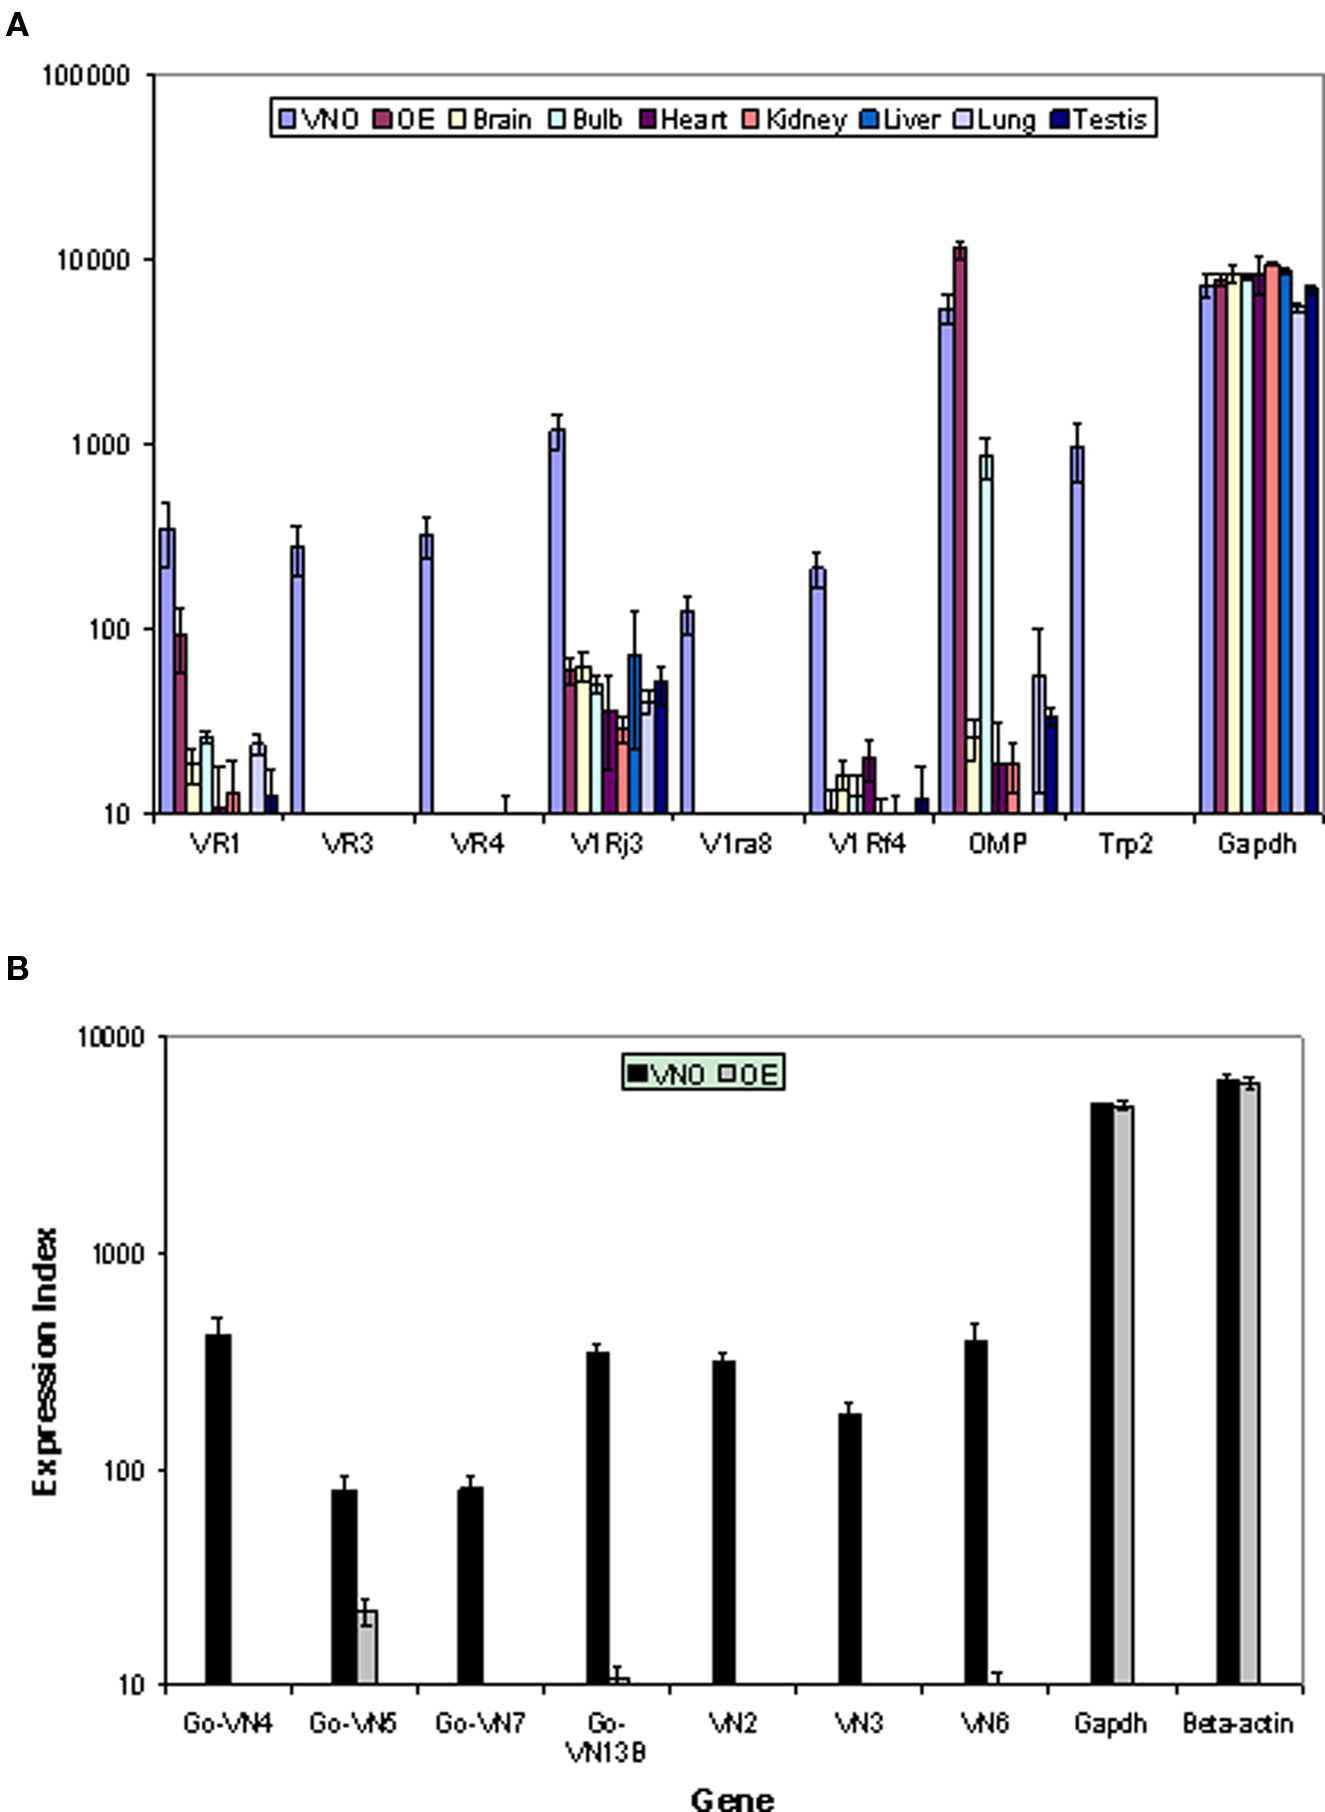
Figure 2. Validation of the custom array by examining differential gene expression for control and vomeronasal receptor genes across tissues in mouse (A) and rat (B). The mean expression values and standard errors are shown with sample numbers n = 5 for OE and VNO, n = 3 for other tissues. Control genes show expression profiles consistent with known data. Receptor genes show clear differential expression in the appropriate olfactory tissue despite the relatively low signal levels.
The expression of VR genes was first compared between the VNO and the main olfactory epithelium. To avoid neglecting VR genes that may be expressed in the MOE, we also selected brain as another reference tissue for comparison. SAM (Tusher et al., 2001) (significance analysis of microarrays), which is a supervised learning software for genomic data analysis, was used to estimate the FDR of differential analysis between different samples. Samples were randomly permuted for 100 times to estimate FDRs. Different numbers of VR genes would have been classified as significantly enriched in VNO under distinct cutoffs of FDRs. A summary of such comparisons are listed in Table S1 in Supplementary Material. To make our analysis as accurate as possible, we also considered the present and absent call assigned by MAS5.0 as a second criteria. (for details of data analysis, see Materials and Methods). Under these stringent criteria, we detected 168 V1Rs significantly enriched in mouse VNO at FDR less than 0.16% (see Figure 3A). One hundred thirty-eight of them, which constitute 84% of the detected V1Rs, are putative intact genes by computational data mining. The remaining 27 genes are pseudogenes, which represents only 23% of all putative pseudogenes. It is not surprising that a higher percentage of putative intact V1Rs were detected by our custom array to be real V1R genes with specific expression signal in VNO, since it is very possible that most of the putative pseudogenes are not functional at all and even the mRNA may not be expressed.
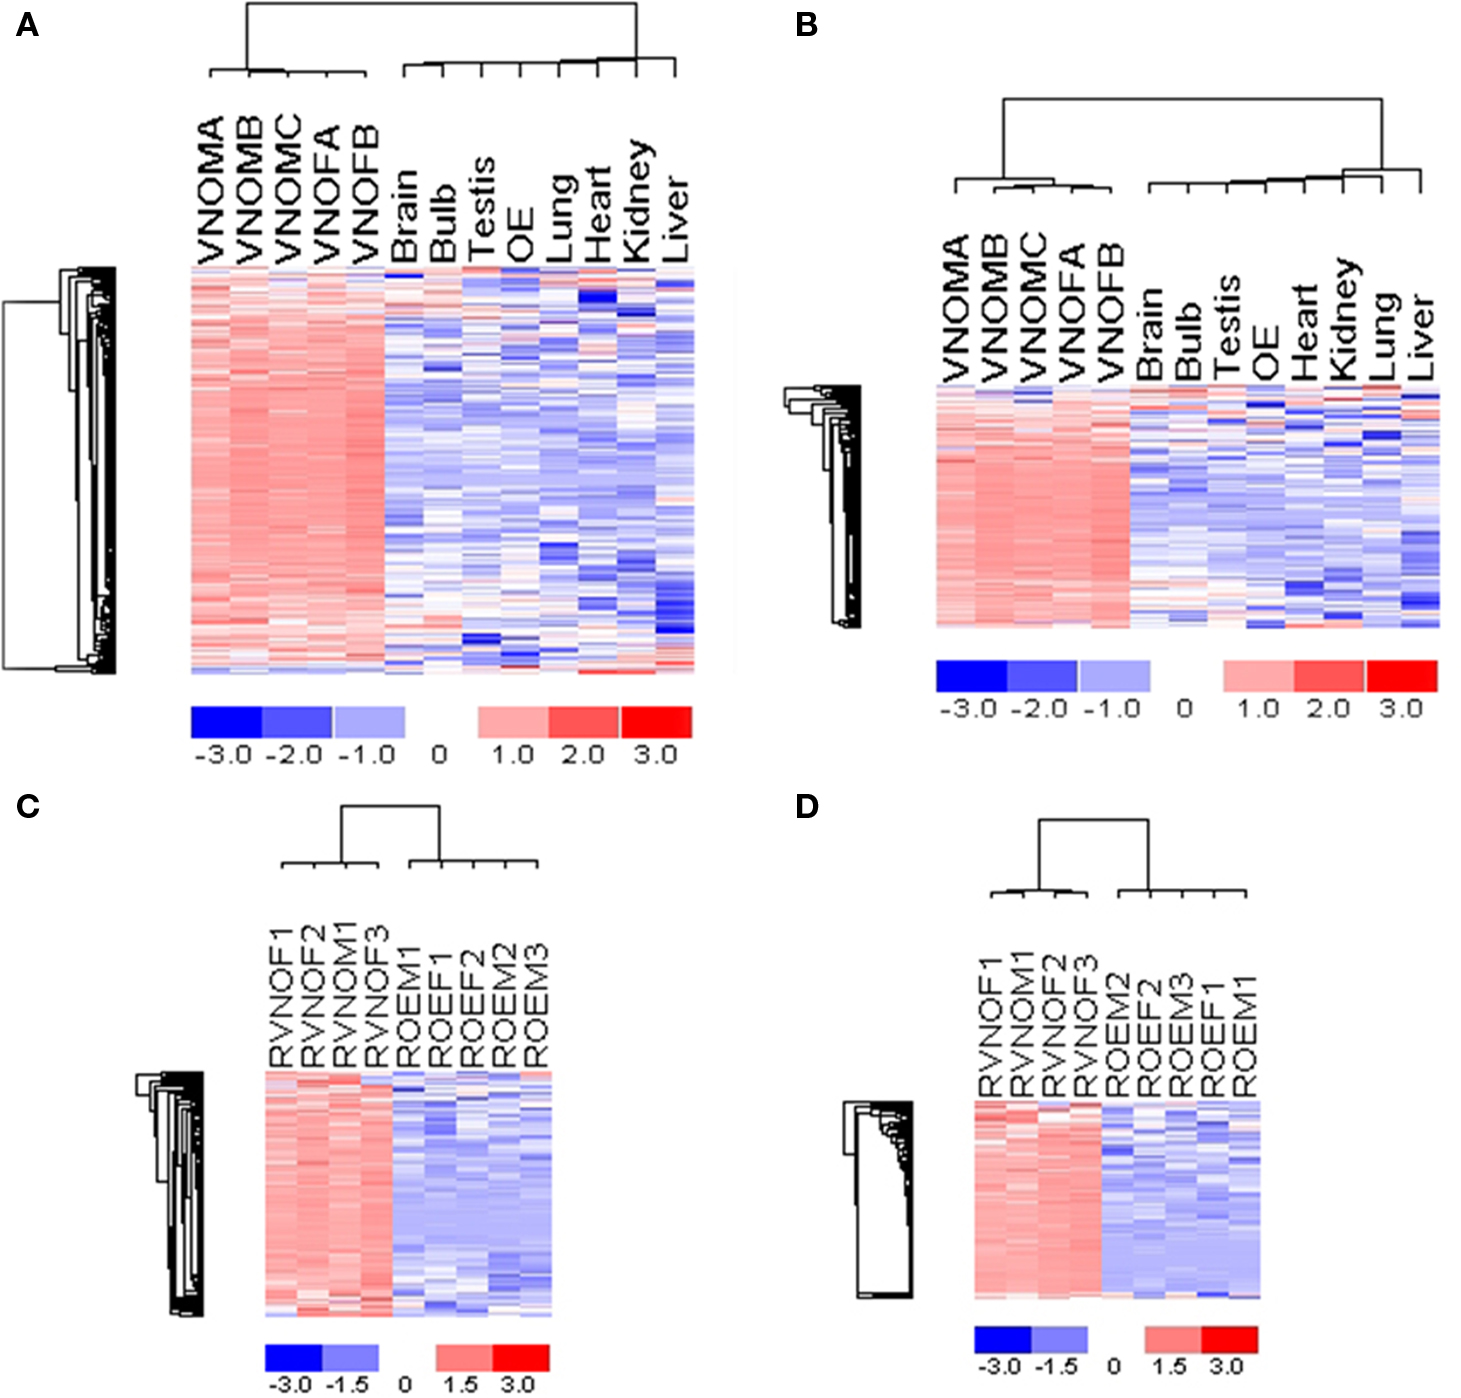
Figure 3. Expression profiles of V1R genes and V2R genes across tissues, showing VNO-specific expression of mouse V1R genes (A) and V2R genes (B), rat V1R genes (C) and V2R genes (D). All tissues are from 2-month-old adult mice. For OE and VNO tissues, the suffix “M” or “F” denotes that the tissue was from male or female animals, respectively. The gene expression values are standardized such that the mean is 0 and standard deviation is 1 for each gene. The color represents expression values as shown in the scale bar, with red corresponding to higher-than-mean expression values and blue corresponding to lower-than-mean values. The dendrogram on the left shows clustering of genes, and the top dendrogram shows clustering of samples based on the expression data. Genes with at least two present calls and high variation across samples are chosen for the clustering analysis and are shown in the figure. In (A), 179 probe sets representing 168 mouse V1R genes are shown; in (B), 107 probe sets representing 98 mouse V1R genes are shown; in (C), 108 probe sets representing 108 rat V1R genes are shown; in (D), 87 probe sets representing 87 rat V2R genes are shown.
Similarly, 98 V2Rs were detected to be highly enriched in VNO at FDR less than 0.16% (Figure 3B). To our knowledge, this is the first time that expression in the VNO was confirmed for such a large number of V2Rs. Since our custom array is sensitive to signals from the 3′ rather than 5′ portion of genes, our ignorance about the long N-terminals of V2Rs had no effect on the detection of their expression in the VNO. Making exon choices in the N-terminal of V2R genes has been the most difficult problem for computational gene prediction. We purposely avoided this task to increase the sensitivity of gene prediction, which proved to be a useful strategy since we detected many more V2R genes than predicted by Zhang and coworkers (Yang et al., 2005).
Our second array contains rat VR genes and OR genes for four species. Using MOE and VNO tissues and the same methods for data analysis, we detected 108 rat V1Rs and 87 V2Rs significantly enriched in VNO compared to OE with FDR at 1.91% (Figures 3C,D). Among the detected V1R genes, there were nine pseudogenes. This is more than we expected considering there are only 11 rat V1R pseudogenes on the array. One explanation is that those V1R pseudogenes contain no more than two frame-shifts or stop codons inside the coding regions. Some of them may be functional as intact genes but wrongly assigned as pseudogene because of a sequencing error. From the mouse array data, about 23% of mouse V1R pseudogenes are expressed in the VNO. If the same percentage holds for rat, we would have missed seven rat V1Rs because there were no probes designed for them on our array, a trade off due to our space limitations on the array.
To evaluate the detection sensitivity, we collected 29 mouse V1R genes from the literature that had been verified by in situ hybridization in VNO. We found that 26 of them were reported as enriched significantly in VNO from our custom array. This finding gives a sensitivity value of 90%. The remaining three V1Rs are from random chromosomes, which are pieces of incorrectly assembled genome sequences. They were not detected by our array most probably because their downstream flanking sequences are incorrect, making our probe design for them mistaken. The array specificity was more difficult to estimate because it is not known how many VR genes that were classified as enriched in VNO are false positives. The FDR calculated by SAM through permutations can be used as an approximation of false positives. For VR genes, it is as low as 0.16%, which indicates the false positive rate is 99.8%. It should be noted that this is an overestimate since random permutations can not exclude some sources of false positives, such as cross-hybridization between VR genes.
Expression of VR Genes in Non-VNO Tissues
VR genes expressed in VNO had been thought to detect substances carrying specific information concerning gender, species and identity of an animal. Recent evidence suggests that the neurons in the VNO may also respond to general volatile odorants as well (Sam et al., 2001; Trinh and Storm, 2003). To our knowledge there is no data on VR expression in non-olfactory tissue, and there are only a few data concerning VR expression in the MOE. These reports were generally based on single gene expression data by RT-PCR or in situ hybridization.(Rodriguez et al., 2000; Karunadasa et al., 2006) The custom array is a potentially useful tool to discover possible expression in multiple tissues.
Total RNAs were extracted from nine mouse tissues as shown in Figure 4 and processed for RNA hybridization with our custom array. To minimize false positives, we used very stringent criteria to classify a gene as enriched in each tissue (see Materials and Methods). For each non-olfactory tissue, MOE or VNO were used as the background references respectively. Compared to either MOE or VNO, we found about 5–20 VR genes elevated in each non-VNO tissue (see Table S1 in Supplementary Material). Since these are a small number of genes, to avoid technical glitches, we checked all 11 probes for each probe set. Only those with a consistent signal among all probes were selected as being expressed in other non-VNO tissues. To our surprise, we found 10 VR genes having mRNA signal both in the VNO and main olfactory bulb, but not in the MOE. Normally, vomeronasal sensory neurons expressing VR genes project to the accessory olfactory bulb where they form glomeruli. These 10 outliers could be functional in combination with other ORs, thus being part of the olfactory projection mechanism. For those several VRs showing specific expression in non-VNO tissues (see Table S1 in Supplementary Material) we suggest that these may be VR-like GPCRs. They were identified as VRs by computational data mining mainly because their sequences are more similar with known VR genes than other GPCRs, however if they are not expressed in the VNO they cannot be considered as VR receptors. As an unexpected supplement this work may have identified previously unknown GPCRs, which are common targets for many drugs. Functions of these new VR-like GPCRs are yet to be explored.
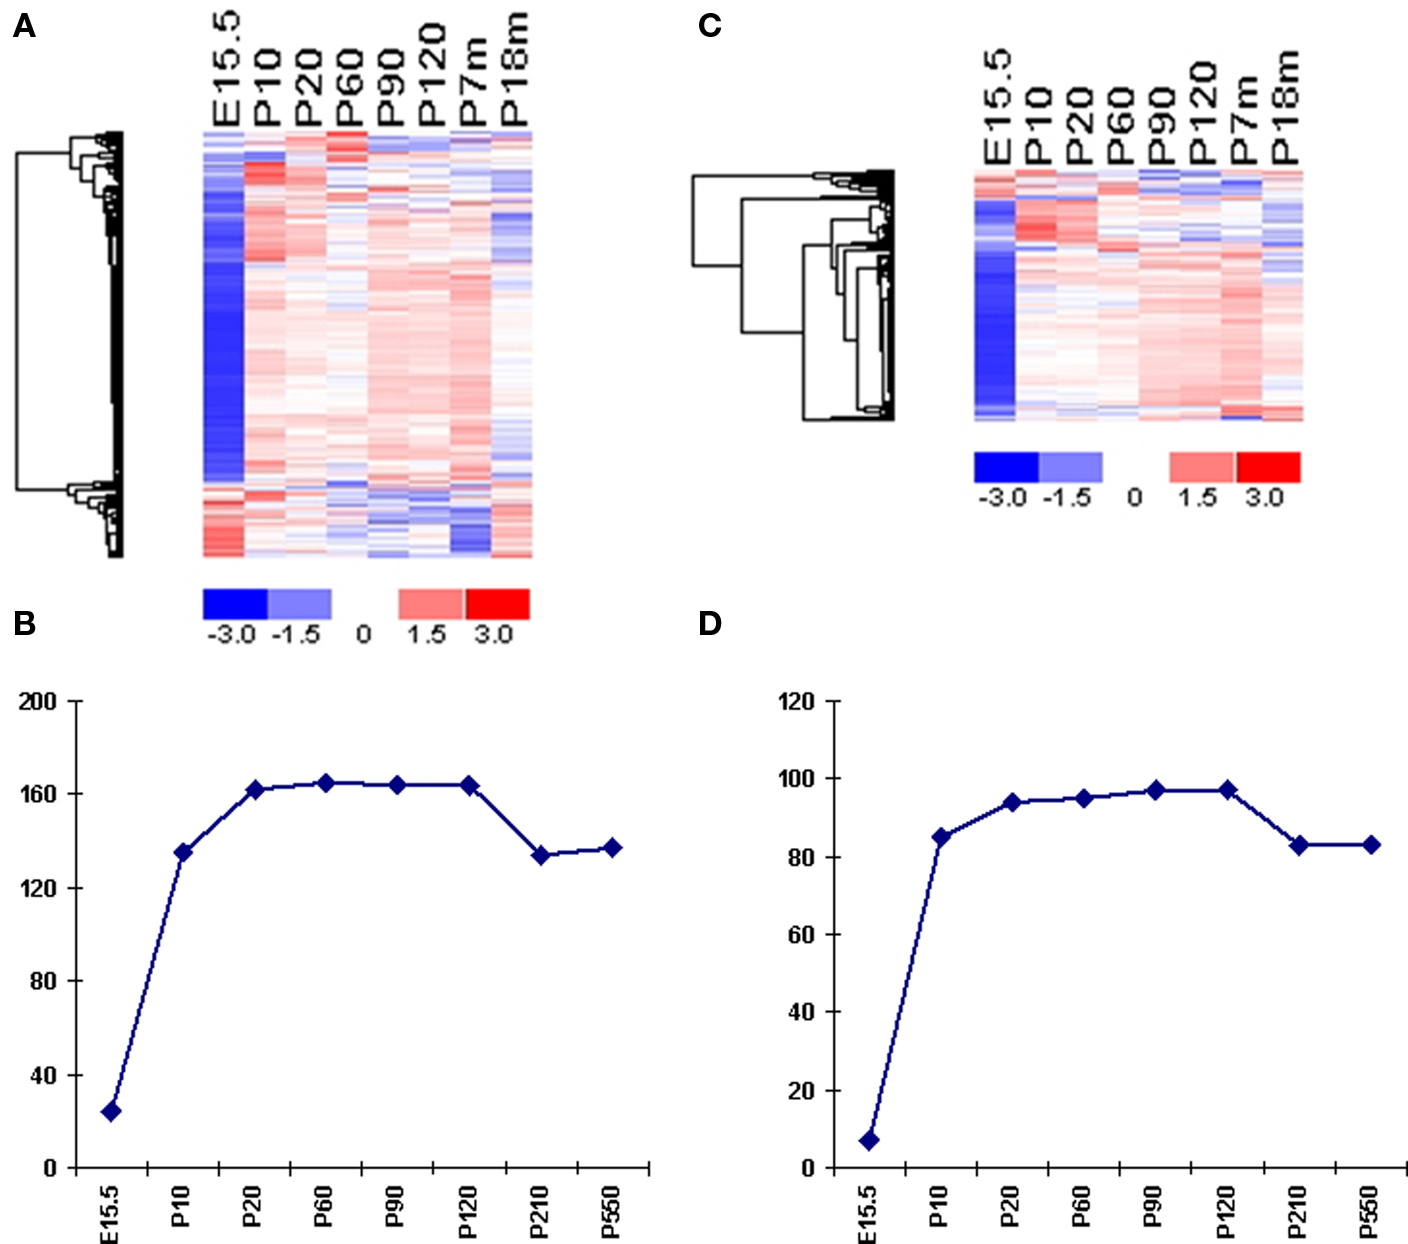
Figure 4. Temporal expression of VR genes. (A) Expression profiles of mouse V1R genes from different ages are plotted in the same manner as in Figure 2. Samples are listed according to the age, and genes are shown according to the clustering result. One sample per time point is used in this analysis. Mean of the expression values at each time pointed were used for clustering. One representative probe set was used for each VR gene. In total, 168 probe sets representing 168 mouse V1R genes are shown. (B) The numbers of expressed mouse V1R genes (using OE as background) during different stages. (C) Expression profiles of mouse V2R genes from different ages are plotted in the same manner as in Figure 2. (D) The numbers of expressed mouse V2R genes (using OE as background) during different stages.
It remains possible that some level of cross-hybridization with non-VR genes is responsible for false positives in other tissues. We consider that possibility very low because only probes with sufficient specificity were included on the array. All probe sequences had been pruned against the whole genome databases to ensure their specificity. Furthermore, if there was cross-reactivity, it should have arisen from other VR genes whose sequences share the most similarity. Since very stringent criteria were used to classify their enrichment, we can not rule out the possibility that some VRs are indeed expressed at a marginal level or in a small number of cells in some samples. Those would be the false negatives of our data, which require more in-depth experiments to address fully.
Temporal Expression Pattern of VR Genes
The developmental course of VR gene expression remains largely undocumented. While the morphological development of the vomeronasal epithelium has been examined through histochemistry in early development (Jia et al., 1997; Matsuoka et al., 2000; Salazar et al., 2003) there are few data regarding VR gene temporal expression at embryonic ages (Karunadasa et al., 2006). As far as we know, this is the first time that the development of VR genes was explored by high-throughput methods. Starting from embryonic day 15.5, mouse VNO tissues were collected from animals at eight age intervals and the level of VR expression was analyzed. We performed two-dimensional comparison using two sets of normalization groups: group i containing all VNO and OE tissues for comparison between the VNO and OE samples to identify VRs enriched in VNO at each time point; group ii containing only VNO samples at all ages to explore VR expression level changes over time. From group i analysis, a number of VR genes were classified as being enriched in VNO at different ages. Only those VRs showing enrichment in VNO were subject to group ii analysis.
Mouse VNO tissues from eight time points were collected and differential analysis were accomplished to identify the number of expressed VRs at each time point. The earliest age tested was embryonic 15.5 days, when the VNO can barely be seen under a dissection microscope. From our differential analysis, we identified 24 V1Rs and 7 V2Rs elevated in the VNO compared to OE (Figures 4A,B). It has been reported that one mouse V1R gene, namely V1Rab, was detected as early as E12.5 through nested RT-PCR experiments. Another two V1R genes, V1Rd and V1Rc were found at E14.5 and E16.5 respectively (Karunadasa et al., 2006). Considering the low expression level and few VR-positive cells at that early age, VRs with marginally different signal from the background would be difficult to detect by microarray. The expression level of VRs increases dramatically between E15.5 and early postnatal days. At postnatal 10 day (P10), the number of expressed VRs reaches about 80% of that in the plateau seen from P20 to P120. Although the number of detected VRs reaches a peak at P20 and remains high until P120, their expression level is generally not steady. At P210, we found about a 15% decrease in the number of expressed VRs, which included 30 V1Rs and 14 V2Rs. At a much older age, P550 (18 months), mice maintained the same number of VR genes as at 7 months, although their expression level decreased significantly with aging. The number of lost genes is not statistically significantly biased to either type of the VR genes. It appeared to be a common phenomenon among aged mice because the VR loss occurred across all biological replicates. It should be noted that the loss of some VRs at old age might not actually reflect their complete disappearance but rather an extremely low expression level which can not be differentiated from background noise. Although these methods do not provide a day-to-day or even week-to-week view of alterations in gene expression, they do point to a significant change in VR expression occurring between 4 and 7 months of age – the most reproductive time of the animal’s life. These experiments for the first time characterize the expression profile of VR genes at different developmental stages.
We could also ask if there are patterns to the gain and loss of VRs over time. To analyze the data for these patterns we used EDGE (Leek et al., 2006) software to perform a differential analysis selecting genes with statistically significant difference among all time points for pattern classification. Standardized values of the average signal, which are comparable between different genes, were used for pattern classification. Excluding 30 VRs that showed no significant fluctuation over time, the remaining 236 VR genes can be classified into seven temporal patterns reflecting their expression profiles (Figures 5A–G) (see Materials and Methods for details). The seven patterns were ordered according to the number of harboring genes. It is interesting to find that different VR genes follow into distinct patterns, showing variable developmental dynamics. For example, V2rp1 (Kimoto et al., 2005), which was thought to identify the male-specific 7-kd peptide secreted from the extraorbital lacrimal gland, followed into pattern a (Figure 5A) which contains the most number of VR genes. VR1-5 (Matsunami and Buck, 1997), initially identified as pheromone receptors expressed in mouse VNO, belonged to patterns a, b, d respectively. Few annotated VR genes were found in pattern c, probably due to that fact that adult mice were commonly used for gene cloning while VRs in pattern c has very low expression level at adult age.
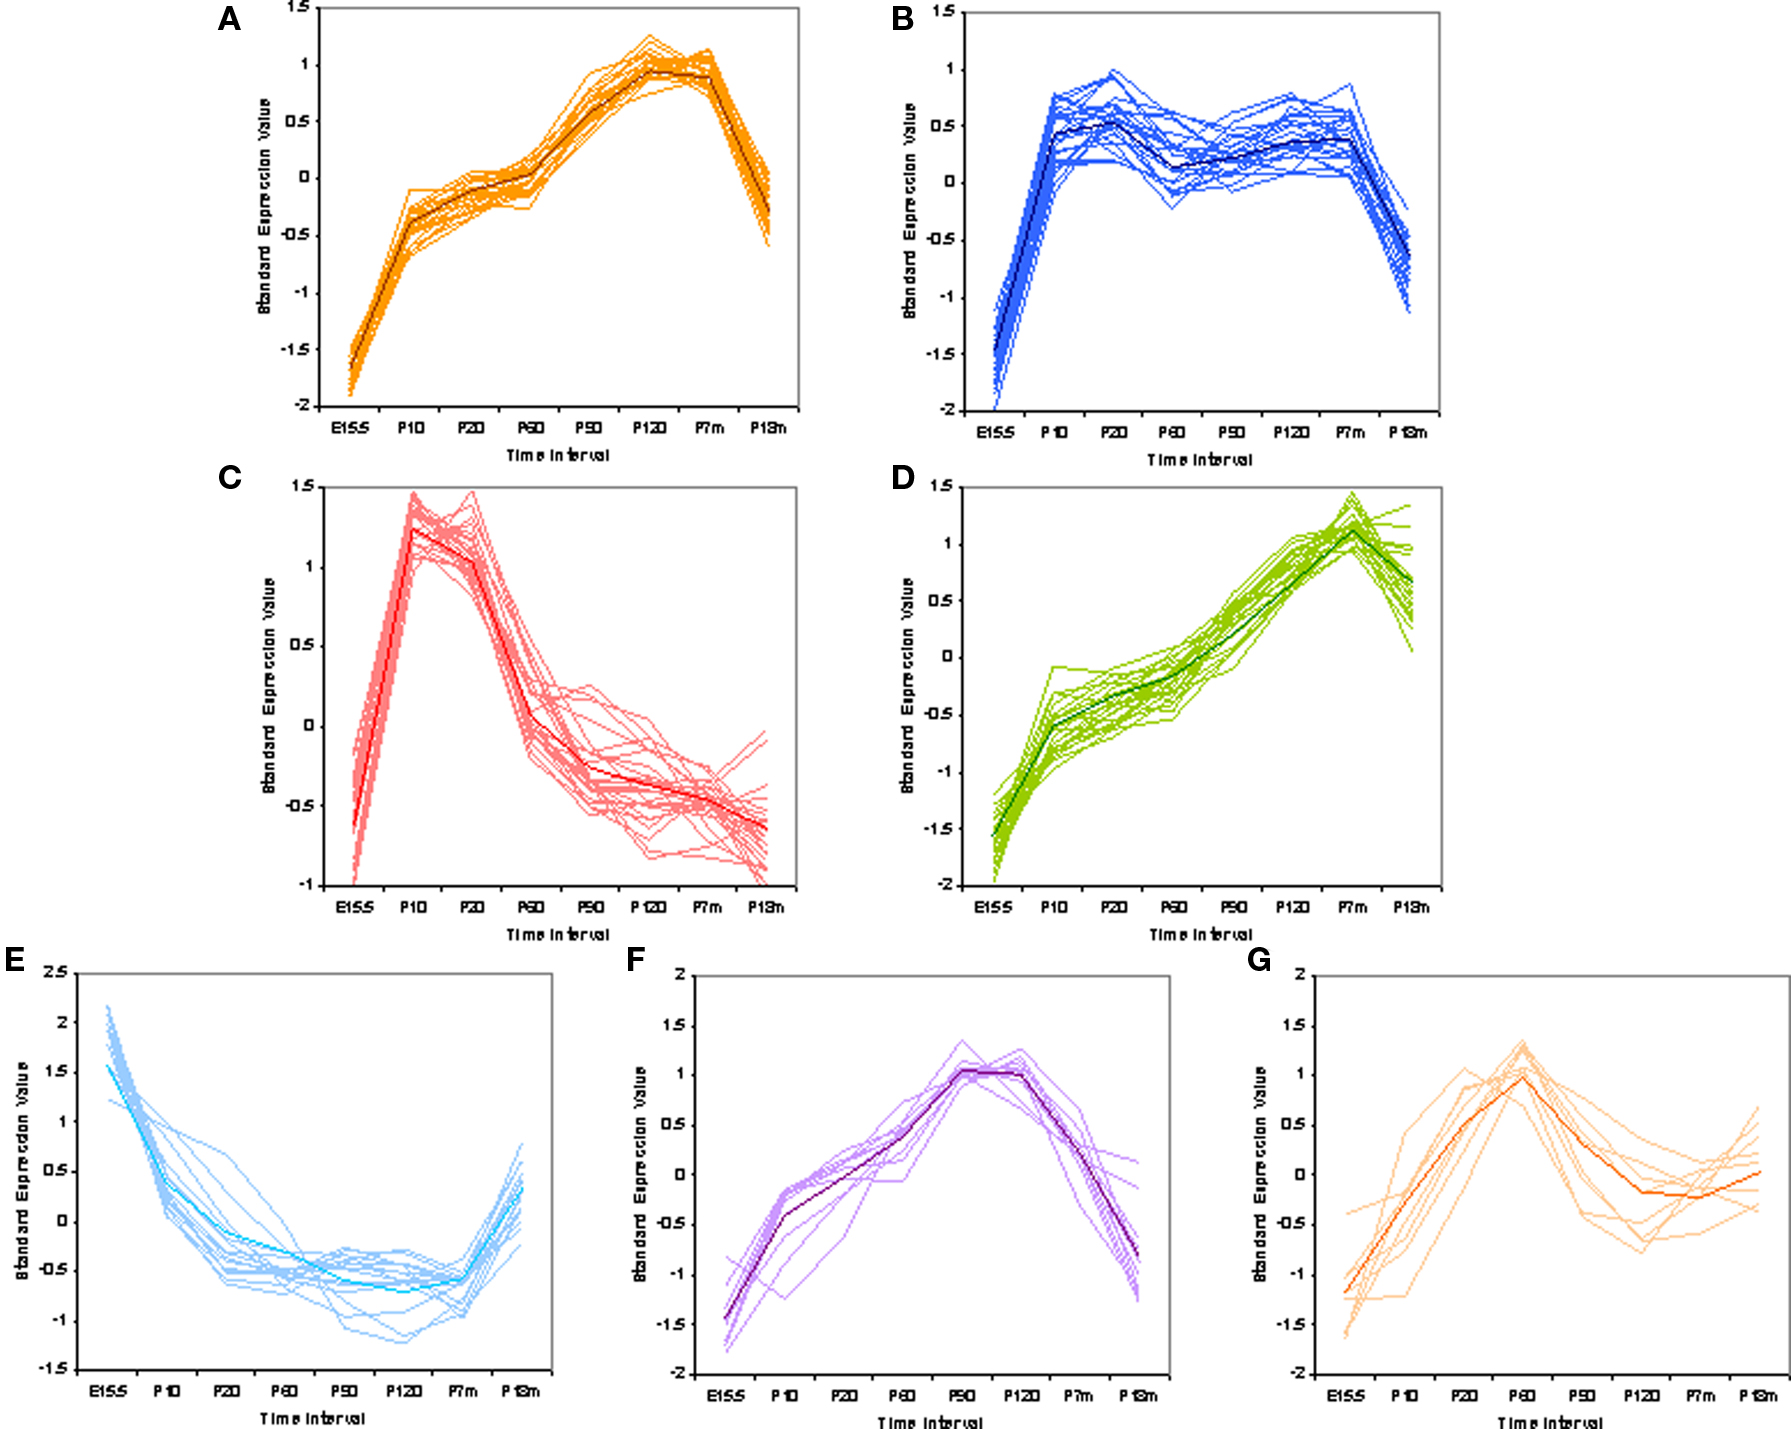
Figure 5. Pattern classification of mouse V1R and V2R genes. Standardized expression values were used to do pattern classification. Mean of the raw expression signal over all time points were standardized to zero. This is the composition of VR genes in each pattern: (A) 67 VRs, not biased to V1R or V2R; (B) 53 VRs, biased to V1Rs with hypogeometric p-value at 0.00033; (C) 36 VRs, even; (D) 35 VRs, biased to V2Rs with hypogeometric p-value at 1.95e-07; (E) 22 VRs, marginally biased to V1Rs with hypogeometric p-value at 0.03; (F) 14 VRs, even; (G) 11 VRs, even. The shape of the pattern seems to correlate with mouse behaviors, such as VRs in pattern (C) are probably functional in nursing for pumps; VRs in pattern (E) are possibly important for VR expression onset.
It was not observed that VR genes from the same family or chromosome cluster share the same pattern. But the composition of two types of VR genes varies in different patterns. Some patterns are a composition of V1R and V2R genes, while others are significantly biased to one or the other type of receptor. For example, pattern d (Figure 5D) is highly biased to V2Rs with hyper-geometric p-value at 1.95e-07; but genes in patterns b (Figure 5B) and e (Figure 5E) tended to be only V1Rs with p-value at 0.00033 and 0.03 respectively. The other four patterns are evenly composed of V1Rs and V2Rs.
Both the composition of VR genes in each pattern, and the patterns themselves are interesting, indicating their possible functions. For example, VRs in pattern c (Figure 5C) have the highest expression level around postnatal days 10–20. We hypothesize that these VRs could be important for pup nursing while VRs in pattern a (Figure 5A) could be important for reproductive activity. Another interesting phenomenon is that VRs and ORs have distinct expression profiles at P210. VRs in pattern a, b, and d, which are 58% of all VRs, show higher expression levels at day P210 than at the standard adult age of P60. In ORs, we observed nearly the opposite pattern. Most ORs have a decreased expression level at P210 (see Figure S2 in Supplementary Material). It seems that half of the VR repertoire maintains their high expression level until the animal is 7 months old, while the other half of the VRs and a majority of the ORs do not. This observation is not contradictory to the loss of VRs at P210 since those lost VRs are in the other four patterns, in which VRs have a lower signal at P210 compared to P60–P120.
In addition to the VR genes, we also examined the expression patterns for a total of 1340 other genes of interest, including transcription factors (TFs) with basic helix-loop-helix (bHLH), olfactory signal transduction genes, and genes verified to be expressed in OSNs by other methods (Weiler and Farbman, 1997; Tabaska and Zhang, 1999). Seven hundred sixty out of these showed statistically significant difference in expression at all time points. Of these about 400 genes are bHLH TFs. Using the same methods as applied to the VR genes, these non-VR genes could be classified into 12 temporal expression patterns. In Figure 6, three patterns are shown as examples, and 25 genes for each pattern are listed in the corresponding table. All 12 patterns are shown in Figure S3 in Supplementary Material for reference. Interestingly, 6 of these 12 patterns, were also observed in VR genes, such as those in Figures 6A,B; others such as the pattern of Figure 6C were different from those seen for the receptors.
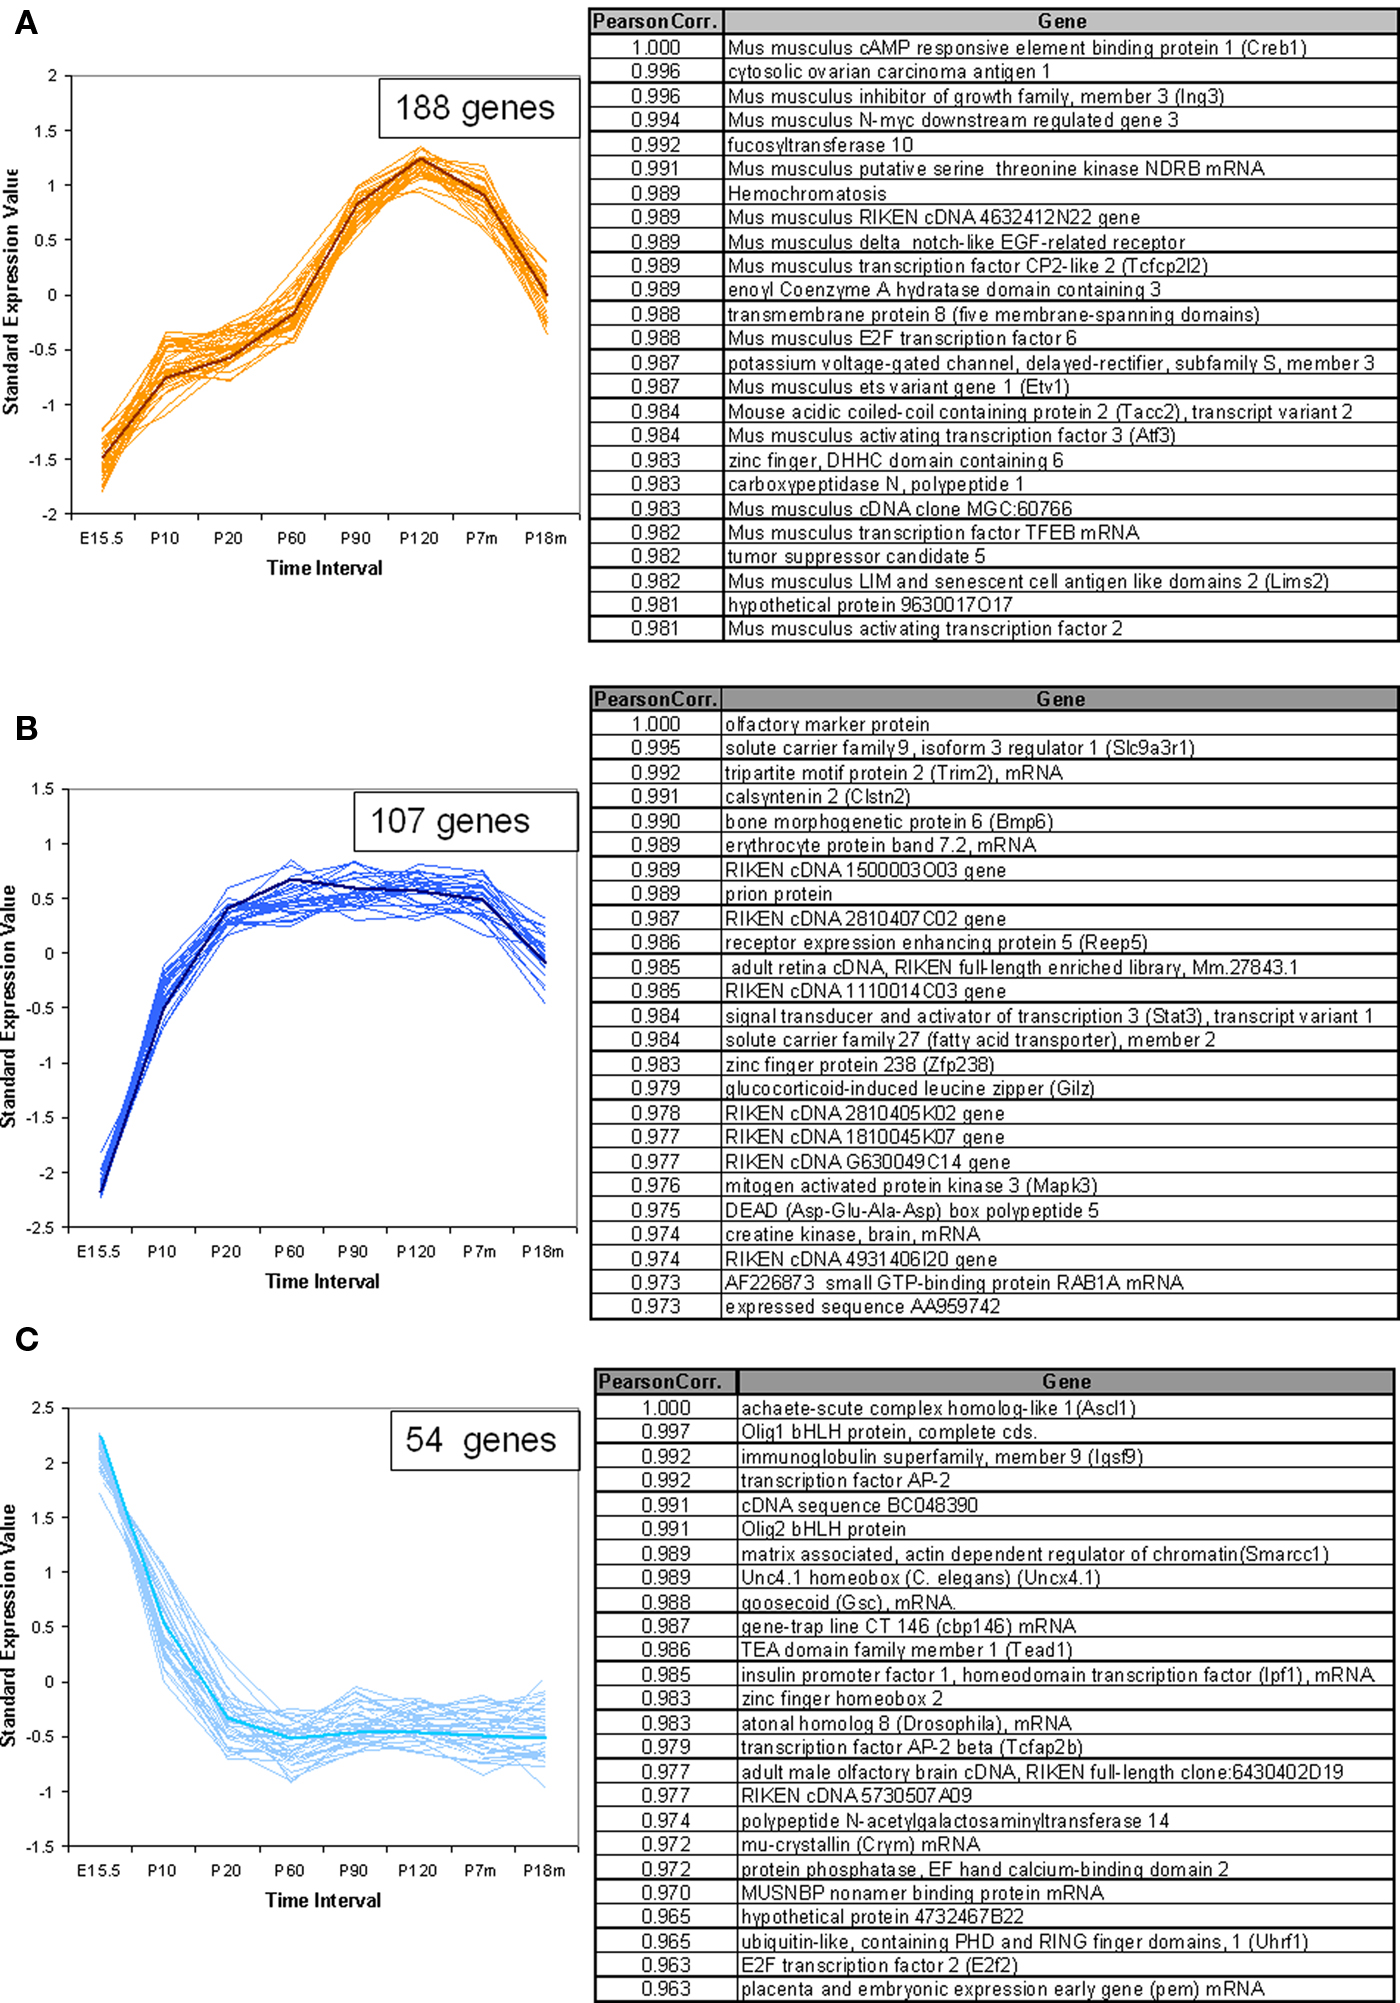
Figure 6. Temporal expression patterns for other genes of interest. The expression pattern of 1340 non-VR genes in VNO were analyzed. Seven hundred sixty out of them showed significantly different expression level over time course, and were classified into 12 patterns. Three examples were shown here, the full version in Figure S3 in Supplementary Material. The top 25 genes were selected to draw the figures and the genes information were listed in the corresponding table. The representative gene, which was selected based on the correlation to the average trend over time, was highlighted in weighted line. (A) This pattern consisted of 188 genes, showing increasing expression level from embryonic age to 7 months, followed by a significant drop at 18 months. Creb1, was selected as the exemplary one. Genes in this pattern were categorized in regulation of cellular metabolism in Gene Ontology with p-value <0.0001. (B) This pattern was composed of 107 genes, with the olfactory marker protein as the representative gene. Genes in this pattern showed a plateau between P20 and P210, followed by a slight decrease at P550. (C) 54 genes followed into this pattern, with Ascl1 (with synonym of Mash1) as the typical gene. This pattern showed an obviously high expression level at embryonic age and a slope after birth. After P20, a low expression level was maintained. Together with Mash1, Olig1, were proved to be important for neuron differentiation from progenitor cells to different cell types. Genes in this pattern were significantly categorized in DNA-binding transcription regulation in Gene Ontology.
For ease in following the large number of genes represented one representative gene was highlighted in each pattern. Creb1, a TF known to be important for cell proliferation in other tissues (Mantamadiotis et al., 2002), followed pattern a (Figure 6A) in VNO development. OMP (Figure 6B), the OMP, which is considered to represent the number of mature olfactory sensory neurons (Monti Graziadei, 1983), showed an increasing expression level from embryonic age to P20 followed by a plateau until P210 and a slight decrease at P550. Mash1 (Figure 6C), an essential gene in cell differentiation of olfactory progenitor cells (Ishii et al., 2004), was expressed at extremely high levels during the embryonic period, followed by a significant decrease as the mice mature until P20, and a plateau afterwards.
We analyzed the Gene Ontology categories represented by genes in each pattern. It was not surprising to find that most of them were enriched in the category of transcriptional regulator activity since about half of the total genes are TFs. For example, the top category enriched by pattern a (Figure 6A) was regulation of cellular metabolism, and genes in pattern c (Figure 6C) were biased to DNA-dependent regulation of transcription. Because nearly half of the total genes are not well annotated, this enrichment analysis should be considered primarily as a reference.
Verification by in Situ Hybridization
It should be noted that the microarray signal is a multiplication of the number of positive cells and the signal intensity of each cell. The change of expression level over time therefore could be a result of a change in the number of positive cells or in the signal intensity in each cell, or both. This distinction is not easy to make for such a large number of genes. As a first attempt, we performed in situ hybridization experiments for four VRs selected from different patterns. Two developmental time points which showed expression level alteration were selected, and VNO tissues from littermates were dissected. The average number of positive cells in square micrometer was quantified in consecutive representative slices. We observed two situations: the number of gene expressing sensory neurons either changed or did not change, confirming that the contributing factors of developmental expression vary between receptor genes. As shown in Figure 7, no marked differences in positive cells were detected for V2R Gene1 from pattern a (Figure 7A) and V1rj3 from pattern b (Figure 7B), while we observed a remarkable decrease for gene V1rk1 between P10 and P550 (Figure 7C) and a significant increase for V2R Gene2r between P1 and P550 (Figure 7D). For Gene1 and V1rj3, the expression change over time could be due to the signal intensity per cell. From these experiments, we confirmed that a change in cell number is one of the factors contributing to the expression variation at different time points, even though the causative factors vary among different genes.
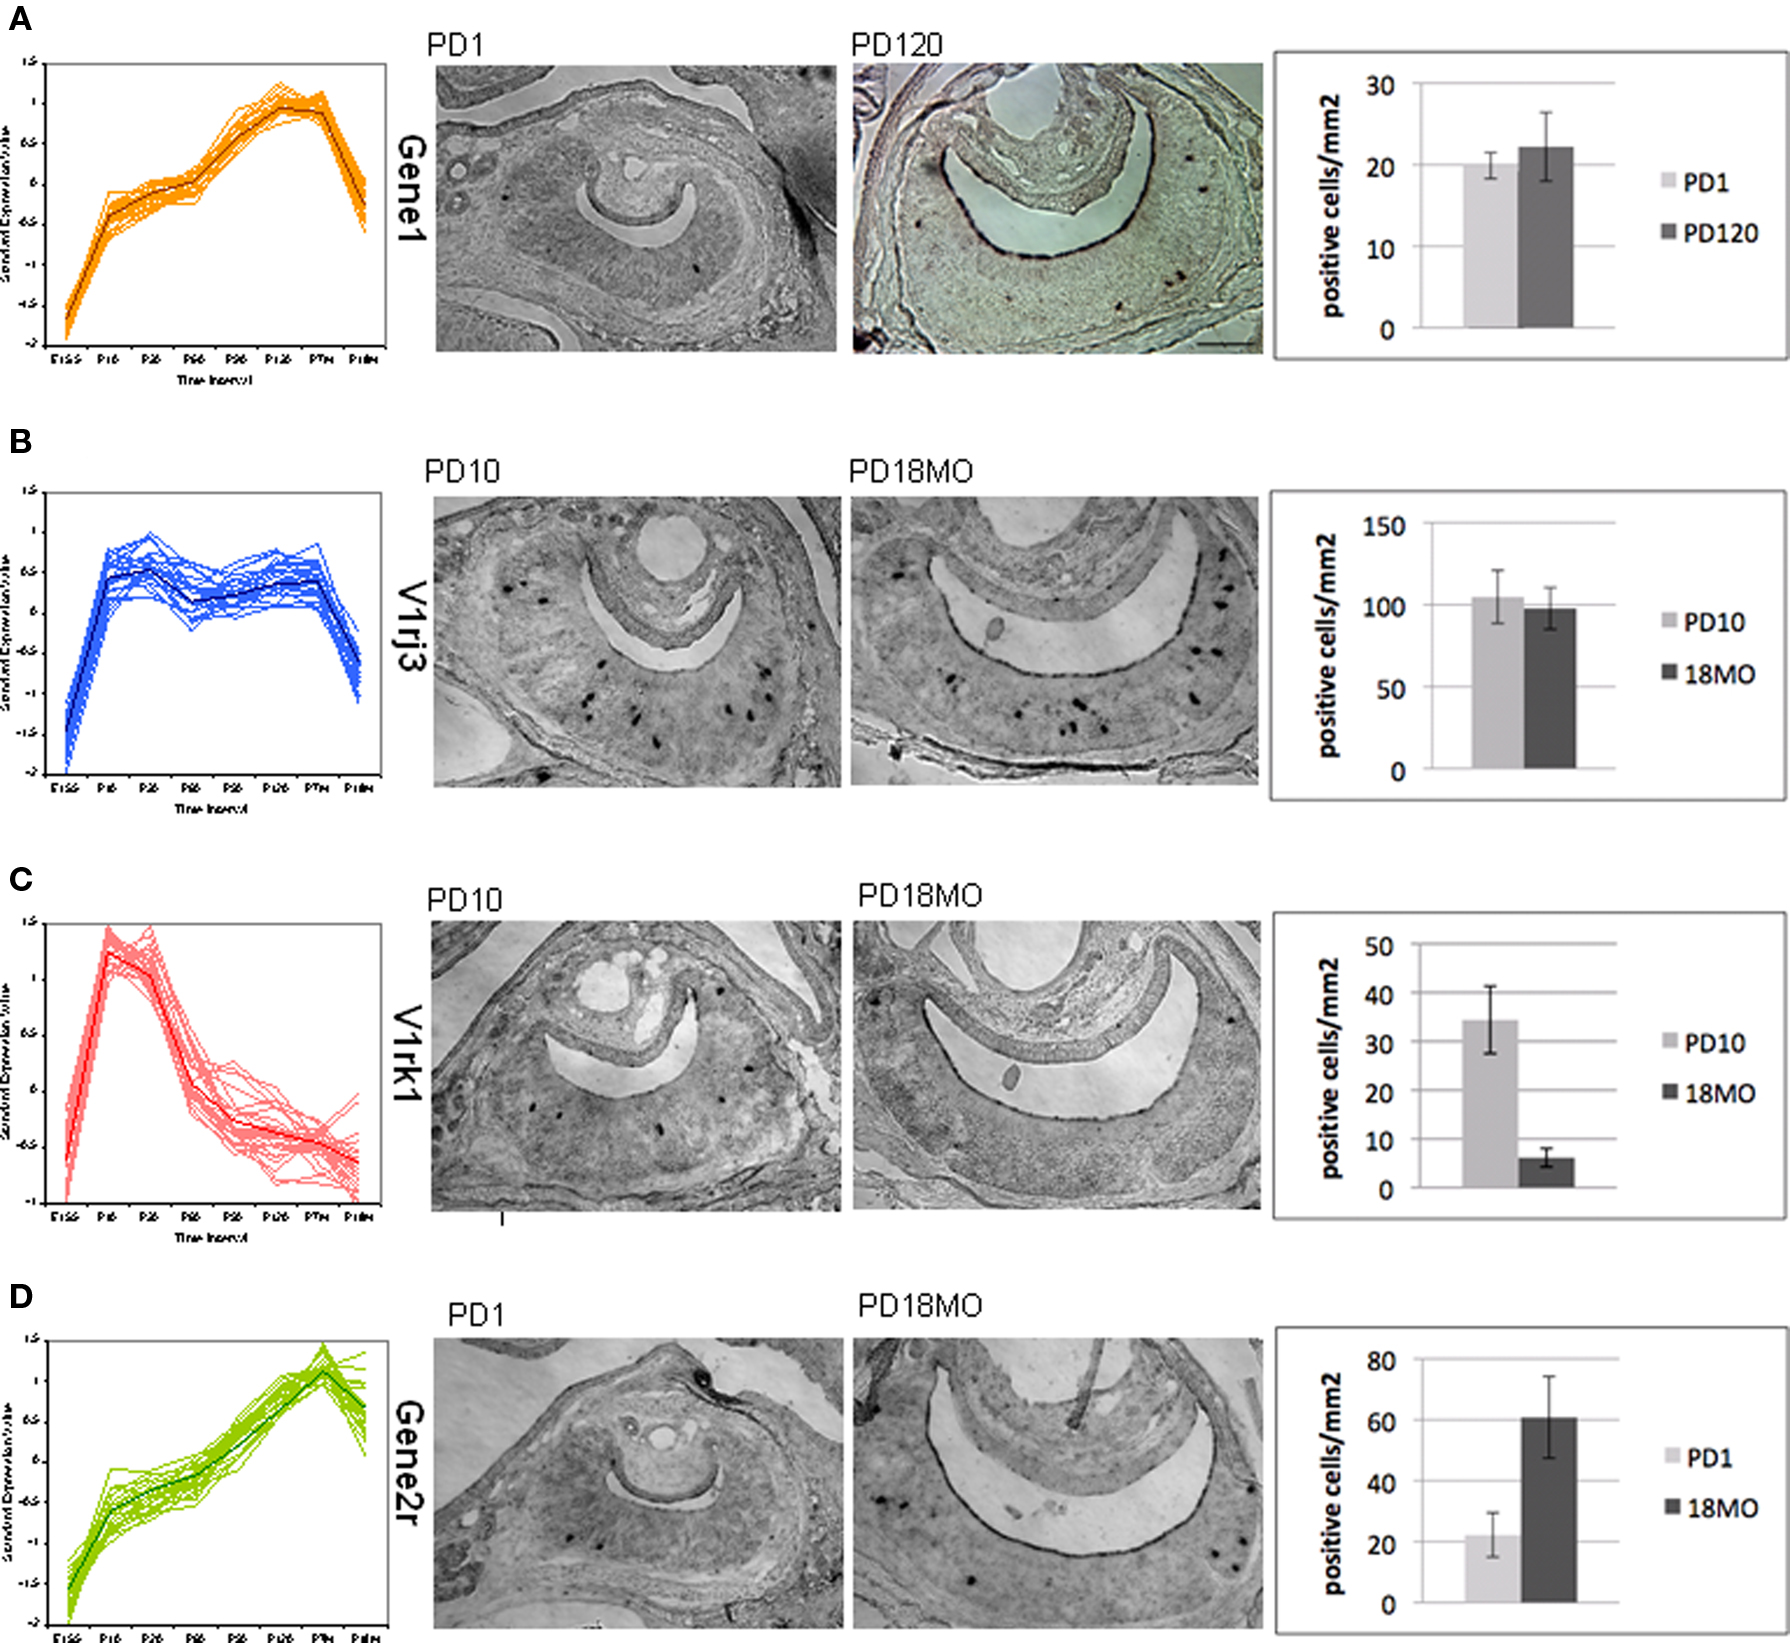
Figure 7. Temporal expression change of VR genes confirmed by in situ hybridization. One gene was selected from four main patterns shown in Figure 5 for in situ hybridization. The number of VR expressing vomeronasal sensory neurons at different developmental time points was counted with representative slides. In situ hybridization was performed in coronal sections of mouse VNO using digoxigenin-labeled antisense RNA probes. For each pattern from (A) to (D), the overall time course expression patterns were shown, followed by two representative sections with positive label cells at two ages, then summarized the quantification of the positive labeled cells for each VR gene at each age. For each bar, three replicate mice were used. Section scale bar = 100 μm. (A,B) p > 0.1. (C,D) p < 0.05.
Discussion
Using a custom microarray sensitive to olfactory and vomeronasal gene expression has allowed us to make a large scale investigation of these large gene families. Here we have confirmed that most VR genes are indeed chemosensory receptors by their specific expression in the VNO, while some VRs expressed only in non-VNO tissues were re-assigned as VR-like genes. Further we have characterized their developmental expression profiles highlighting the previously unsuspected temporal dynamics of VR genes and these patterns of expression suggested differing functions of the two major types for VRs during development.
Optimized Designing of Custom Arrays from Genomic Data
The probe quality is the major factor affecting the reliability of microarray data. For example, if reverse transcription is performed to synthesize cDNA from total RNA, the position of the probes will make a significant difference in the efficiency of signal detection. In this case, the closer the probe is to the polyA site, the more sensitively it will detect the original message level. Thus the strategy used for probe design plays a crucial role, especially for genes with low expression level, such as olfactory and vomeronasal receptors. Accordingly we developed a strategy to optimize our probe design, which improved our current array compared to the first generation array (Rodriguez et al., 2002).
One caveat is that the current algorithms for 3′UTR prediction (Tabaska and Zhang, 1999), may lead to false negatives. Our strategy was to use combined predictions by two un-related programs and include both positive and negative predictions from each program, which proved to be effective in increasing the detection sensitivity. Among all probes that are significantly enriched in VNO under stringent criteria, 63% of them are directed at the 3′UTRs. Probes designed for 3′UTRs generally have higher expression signals than those from the coding region. This is because the efficiency of reverse transcription decreases with increasing distance from the polyA sites. Since our probes are close to the polyA sites, we believe the observed expression signals are accurate representations of the original message level in vitro.
Genes with Negative Signals
There are a large number of genes with absent calls assigned by Affymetrix software based on the differences between perfect-match and miss-match probes. In addition, there are also many genes which cannot be classified as being enriched in VNO compared to other tissues. Are these genes really not expressed in VNO or are they just false negative signals?
Considering the stringency of our criteria and the generally low expression level for VR, we believe some of those genes are false negatives. Some VRs that were actually expressed in the VNO may have been labeled as absent because of weak signals. Some VRs with marginal elevation in the VNO were excluded arbitrarily since we could not discriminate whether it was background noise or a true low expression signal in vitro. Probe quality is another source of false negatives. As discussed above, the position of the probes makes a dramatic difference in the detection sensitivity. For some genes, no specific probes, or no probes with appropriate GC content, could be designed near the predicted polyA sites. In this case, selected probes may give artificially low signal or a non-specific hybridization signal resulting in no significant difference. Finally, negative signals could result from incorrect or false negative predictions of polyA sites. We combined predictions by two programs: polyadq and Genscan. From our results, we found that polyadq has much better sensitivity than Genscan in polyA site prediction. Nevertheless, 100% coverage cannot be guaranteed.
Insight of Temporal Expression Patterns
We examined the temporal expression pattern of all VR genes at successive developmental ages. Based on their expression profile, we were able uncover seven patterns that may indicate their possible functions related to behaviors.
Interestingly, in three of the patterns (Figures 5B,D,E), the numbers of V1Rs and V2Rs are not even. Pattern b and e are enriched in V1Rs while pattern d is enriched in V2Rs. V1R genes are expressed in the apical layer of the vomeronasal sensory epithelium closer to the lumen of the VNO. V1Rs in pattern e are highly expressed at embryonic ages, while few V2Rs are expressed at that early age. We hypothesize that this may be because neurons in the apical layer differentiate earlier than the basal layer and therefore that the onset of V1R genes would be earlier than that for V2Rs. V1R genes in pattern e show an opposite trend in relation to neuronal proliferation, suggesting they are probably important for neuron differentiation or VR gene choice at early development. This hypothesis gains some strength from the observation among the 23 genes in pattern e, 8 of them are short pseudogenes, which are thought to play some role in gene choice assuring that each neuron expresses only one receptor. Pattern d is mainly composed of V2Rs, which are thought to detect peptide pheromones. We are unable to offer an explanation for their increasing expression level until reaching a peak some time between 7 and 18 months. The rat olfactory epithelium has been shown to continue growing until nearly 1 year of age (Weiler and Farbman, 1997) and it may be that in a similar manner the continued addition of V2R-expressing cells is the result of continued post natal growth of the VNO.
Pattern a, shown in Figure 5A, consisted of the largest number of VR genes, showing increasing expression level from embryonic age until some time between 7 and 18 months and a marked decrease at 18 months. These expression changes over time could correlate with the level of mouse reproductive activity, with high expression levels at more vigorous ages and lower levels at young and old age. Pattern c, shown in Figure 5C, is composed of both V1Rs and V2Rs with an extremely high expression level between birth and postnatal day 20, the period of suckling. It has been shown that pups smell particular substances found only in the mother’s saliva (Teicher and Blass, 1976). Our data may have revealed some of the corresponding receptors for these substances.
Besides the VR genes, other genes of interest also showed interesting temporal expression patterns. Certain TFs shared the same temporal pattern with a group of VR genes, suggesting that these TFs may have a role in the regulation of VNO development or VR expression. This question could have been addressed if the binding sites for certain TFs could be identified in the upstream of VR genes. Unfortunately this is not currently as the transcription start site of most VR genes are unknown. Motif exploration in TFs is also impractical because the small number of genes represented in each pattern would only provide weak statistical power. The developmental regulation of VR genes remains an open field; the developmental dynamics for VRs and TFs shown here should be of value in future investigations regarding their regulatory mechanisms.
We have provided here the first indication that developmental and functional attributes may be associated with the temporal expression of VR genes. The finding that VR expression levels fluctuate over time suggests that these receptors may be tuned to fulfill specific functions at different ages. In particular the fact that the two major types of receptors are unequally represented in certain temporal expression patterns indicates an interesting functional segregation between the V1Rs and V2Rs. Finally these results should provide a foundation for future investigations involving promoter analysis to disclose the gene regulatory mechanisms underlying these expression patterns.
Conflict of Interest Statement:
The authors declare that the research was conducted in the absence of any commercial or financial relationships that could be construed as a potential conflict of interest.
Footnotes
- ^http://genome.ucsc.edu/
- ^http://www.ensembl.org/
- ^3summary.xls
References
Belluscio, L., Koentges, G., Axel, R., and Dulac, C. (1999). A map of pheromone receptor activation in the mammalian brain. Cell 97, 209–220.
Boschat, C., Pelofi, C., Randin, O., Roppolo, D., Luscher, C., Broillet, M. C., and Rodriguez, I. (2002). Pheromone detection mediated by a V1r vomeronasal receptor. Nat. Neurosci. 5, 1261–1262.
Burge, C., and Karlin, S. (1997). Prediction of complete gene structures in human genomic DNA. J. Mol. Biol. 268, 78–94.
Del Punta, K., Leinders-Zufall, T., Rodriguez, I., Jukam, D., Wysocki, C., Ogawa, J. S., Zufall, F., and Mombaerts, P. (2002). Deficient pheromone responses in mice lacking a cluster of vomeronasal receptor genes. Nature 419, 70–74.
Dulac, C., and Axel, R. (1995). A novel family of genes encoding putative pheromone receptors in mammals. Cell 83, 195–206.
Grus, W. E., Shi, P., Zhang, Y. P., and Zhang, J. (2005). Dramatic variation of the vomeronasal pheromone receptor gene repertoire among five orders of placental and marsupial mammals. Proc. Natl. Acad. Sci. U.S.A. 102, 5767–5772.
Hagino-Yamagishi, K., Matsuoka, M., Ichikawa, M., Wakabayashi, Y., Mori, Y., and Yazaki, K. (2001). The mouse putative pheromone receptor was specifically activated by stimulation with male mouse urine. J. Biochem. 129, 509–512.
Hashiguchi, Y., Furuta, Y., and Nishida, M. (2008). Evolutionary patterns and selective pressures of odorant/pheromone receptor gene families in teleost fishes. PLoS ONE 3, e4083. doi: 10.1371/journal.pone.0004083.
Hashiguchi, Y., and Nishida, M. (2005). Evolution of vomeronasal-type odorant receptor genes in the zebrafish genome. Gene 362, 19–28.
Hofmann, T., Schaefer, M., Schultz, G., and Gudermann, T. (2000). Cloning, expression and subcellular localization of two novel splice variants of mouse transient receptor potential channel 2. Biochem. J. 351, 115–122.
Ishii, T., Hirota, J., and Mombaerts, P. (2003). Combinatorial coexpression of neural and immune multigene families in mouse vomeronasal sensory neurons. Curr. Biol. 13, 394–400.
Ishii, T., Omura, M., and Mombaerts, P. (2004). Protocols for two- and three-color fluorescent RNA in situ hybridization of the main and accessory olfactory epithelia in mouse. J. Neurocytol. 33, 657–669.
Jia, C., Goldman, G., and Halpern, M. (1997). Development of vomeronasal receptor neuron subclasses and establishment of topographic projections to the accessory olfactory bulb. Brain Res. Dev. Brain Res. 102, 209–216.
Karunadasa, D. K., Chapman, C., and Bicknell, R. J. (2006). Expression of pheromone receptor gene families during olfactory development in the mouse: expression of a V1 receptor in the main olfactory epithelium. Eur. J. Neurosci. 23, 2563–2572.
Kimoto, H., Haga, S., Sato, K., and Touhara, K. (2005). Sex-specific peptides from exocrine glands stimulate mouse vomeronasal sensory neurons. Nature 437, 898–901.
Kimoto, H., Sato, K., Nodari, F., Haga, S., Holy, T. E., and Touhara, K. (2007). Sex- and strain-specific expression and vomeronasal activity of mouse ESP family peptides. Curr. Biol. 17, 1879–1884.
Kouros-Mehr, H., Pintchovski, S., Melnyk, J., Chen, Y. J., Friedman, C., Trask, B., and Shizuya, H. (2001). Identification of non-functional human VNO receptor genes provides evidence for vestigiality of the human VNO. Chem. Senses 26, 1167–1174.
Krieger, J., Schmitt, A., Lobel, D., Gudermann, T., Schultz, G., Breer, H., and Boekhoff, I. (1999). Selective activation of G protein subtypes in the vomeronasal organ upon stimulation with urine-derived compounds. J. Biol. Chem. 274, 4655–4662.
Leek, J. T., Monsen, E., Dabney, A. R., and Storey, J. D. (2006). EDGE: extraction and analysis of differential gene expression. Bioinformatics 22, 507–508.
Leinders-Zufall, T., Brennan, P., Widmayer, P., P. C. S., Maul-Pavicic, A., Jager, M., Li, X. H., Breer, H., Zufall, F., and Boehm, T. (2004). MHC class I peptides as chemosensory signals in the vomeronasal organ. Science 306, 1033–1037.
Liman, E. R., Corey, D. P., and Dulac, C. (1999). TRP2: a candidate transduction channel for mammalian pheromone sensory signaling. Proc. Natl. Acad. Sci. U.S.A. 96, 5791–5796.
Loconto, J., Papes, F., Chang, E., Stowers, L., Jones, E. P., Takada, T., Kumanovics, A., Fischer Lindahl, K., and Dulac, C. (2003). Functional expression of murine V2R pheromone receptors involves selective association with the M10 and M1 families of MHC class Ib molecules. Cell 112, 607–618.
Mantamadiotis, T., Lemberger, T., Bleckmann, S. C., Kern, H., Kretz, O., Martin Villalba, A., Tronche, F., Kellendonk, C., Gau, D., Kapfhammer, J., Otto, C., Schmid, W., and Schutz, G. (2002). Disruption of CREB function in brain leads to neurodegeneration. Nat. Genet. 31, 47–54.
Matsunami, H., and Buck, L. B. (1997). A multigene family encoding a diverse array of putative pheromone receptors in mammals. Cell 90, 775–784.
Matsuoka, M., Yoshida-Matsuoka, J., Costanzo, R. M., and Ichikawa, M. (2000). Surface changes in the rat vomeronasal epithelium during degeneration and regeneration of sensory receptor cells. Anat. Embryol. 201, 467–473.
Monti Graziadei, G. A. (1983). Experimental studies on the olfactory marker protein. III. The olfactory marker protein in the olfactory neuroepithelium lacking connections with the forebrain. Brain Res. 262, 303–308.
Niimura, Y., and Nei, M. (2003). Evolution of olfactory receptor genes in the human genome. Proc. Natl. Acad. Sci. U.S.A. 100, 12235–12240.
Rodriguez, I., Del Punta, K., Rothman, A., Ishii, T., and Mombaerts, P. (2002). Multiple new and isolated families within the mouse superfamily of V1r vomeronasal receptors. Nat. Neurosci. 5, 134–140.
Rodriguez, I., Feinstein, P., and Mombaerts, P. (1999). Variable patterns of axonal projections of sensory neurons in the mouse vomeronasal system. Cell 97, 199–208.
Rodriguez, I., Greer, C. A., Mok, M. Y., and Mombaerts, P. (2000). A putative pheromone receptor gene expressed in human olfactory mucosa. Nat. Genet. 26, 18–19.
Ryba, N. J., and Tirindelli, R. (1997). A new multigene family of putative pheromone receptors. Neuron 19, 371–379.
Salazar, I., Lombardero, M., Aleman, N., and Sanchez Quinteiro, P. (2003). Development of the vomeronasal receptor epithelium and the accessory olfactory bulb in sheep. Microsc. Res. Tech. 61, 438–447.
Sam, M., Vora, S., Malnic, B., Ma, W., Novotny, M. V., and Buck, L. B. (2001). Neuropharmacology. Odorants may arouse instinctive behaviours. Nature 412, 142.
Stowers, L., Holy, T. E., Meister, M., Dulac, C., and Koentges, G. (2002). Loss of sex discrimination and male-male aggression in mice deficient for TRP2. Science 295, 1493–1500.
Tabaska, J. E., and Zhang, M. Q. (1999). Detection of polyadenylation signals in human DNA sequences. Gene 231, 77–86.
Teicher, M. H., and Blass, E. M. (1976). Suckling in newborn rats: eliminated by nipple lavage, reinstated by pup saliva. Science 193, 422–425.
Trinh, K., and Storm, D. R. (2003). Vomeronasal organ detects odorants in absence of signaling through main olfactory epithelium. Nat. Neurosci. 6, 519–525.
Tusher, V. G., Tibshirani, R., and Chu, G. (2001). Significance analysis of microarrays applied to the ionizing radiation response. Proc. Natl. Acad. Sci. U.S.A. 98, 5116–5121.
Weiler, E., and Farbman, A. I. (1997). Proliferation in the rat olfactory epithelium: age-dependent changes. J. Neurosci. 17, 3610–3622.
Yang, H., Shi, P., Zhang, Y. P., and Zhang, J. (2005). Composition and evolution of the V2r vomeronasal receptor gene repertoire in mice and rats. Genomics 86, 306–315.
Zhang, X., and Firestein, S. (2002). The olfactory receptor gene superfamily of the mouse. Nat. Neurosci. 5, 124–133.
Keywords: vomeronasal receptor, V1R, V2R, microarray, gene expression profiling, developmental dynamics, bioinformatics, neuroscience
Citation: Zhang X, Marcucci F and Firestein S (2010) High-throughput microarray detection of vomeronasal receptor gene expression in rodents. Front. Neurosci. 4:164. doi: 10.3389/fnins.2010.00164
Received: 09 April 2010;
Paper pending published: 19 July 2010;
Accepted: 18 August 2010;
Published online: 01 November 2010.
Edited by:
Jocelyne Caboche, Universite Pierre et Marie Curie, FranceReviewed by:
Charles A. Greer, Yale University School of Medicine, USA;Francois Tronche, Universite Pierre et Marie Curie, France
Copyright: © 2010 Zhang, Marcucci and Firestein. This is an open-access article subject to an exclusive license agreement between the authors and the Frontiers Research Foundation, which permits unrestricted use, distribution, and reproduction in any medium, provided the original authors and source are credited.
*Correspondence: Stuart Firestein, Department of Biological Sciences, Columbia University, 600 Fairchild Center, 1212 Amsterdam Avenue, New York, NY 10027, USA. e-mail: sjf24@columbia.edu