
- 1 Laboratory of Brain and Cognition, National Institute of Mental Health, National Institutes of Health, Bethesda, MD, USA
- 2 Functional Magnetic Resonance Imaging Core Facility, National Institute of Mental Health, National Institutes of Health, Bethesda, MD, USA
- 3 Department of Psychology and Education, Freie Universität Berlin, Berlin, Germany
Perceptual decision making is a multi-stage process where incoming sensory information is used to select one option from several alternatives. Researchers typically have adopted one of two conceptual frameworks to define the criteria for determining whether a brain region is involved in decision computations. One framework, building on single-unit recordings in monkeys, posits that activity in a region involved in decision making reflects the accumulation of evidence toward a decision threshold, thus showing the lowest level of BOLD signal during the hardest decisions. The other framework instead posits that activity in a decision-making region reflects the difficulty of a decision, thus showing the highest level of BOLD signal during the hardest decisions. We had subjects perform a face detection task on degraded face images while we simultaneously recorded BOLD activity. We searched for brain regions where changes in BOLD activity during this task supported either of these frameworks by calculating the correlation of BOLD activity with reaction time – a measure of task difficulty. We found that the right supplementary eye field, right frontal eye field, and right inferior frontal gyrus had increased activity relative to baseline that positively correlated with reaction time, while the left superior frontal sulcus and left middle temporal gyrus had decreased activity relative to baseline that negatively correlated with reaction time. We propose that a simple mechanism that scales a region’s activity based on task demands can explain our results.
Introduction
In the decision-making literature, two main hypotheses have been proposed to describe the relationship between brain activity and task difficulty. One hypothesis makes the prediction that during easier decisions activity will be greater in brain regions involved in the computation of a decision (Heekeren et al., 2008; Rolls et al., 2010). This hypothesis is derived from the idea that the computation of a perceptual decision requires a comparison of the activity of two or more populations of neurons whose responses reflect the accumulated sensory evidence in support of different options (Shadlen and Newsome, 1996; Heekeren et al., 2004; Gold and Shadlen, 2007). Thus, in a situation where there is clear sensory evidence in support of one option, activity in a decision-making area will reach threshold faster and will lead to greater integrated activity. Evidence for the accumulation of sensory evidence in higher-level brain regions has been demonstrated in both non-human primates (Kim and Shadlen, 1999; Shadlen and Newsome, 2001; Romo et al., 2004) and human subjects (Heekeren et al., 2004, 2006, 2008; Ploran et al., 2007; Tosoni et al., 2008; Gross and Ploner, 2009; Ho et al., 2009). A competing hypothesis makes the opposite prediction, namely, that during difficult decisions, activity will be greater in brain regions involved in the computation of a decision. This hypothesis is derived from the idea that, during difficult decisions, increased task demands will require greater activation in decision-making regions to successfully compute a decision (Binder et al., 2004; Grinband et al., 2006; Thielscher and Pessoa, 2007).
Because these frameworks predict changes in the fMRI signal of opposite sign, it is not surprising that studies investigating perceptual decision making have drawn disparate conclusions. In an attempt to reconcile these models and gain a better understanding of the brain regions involved in computing perceptual decisions, we used a face detection task with degraded stimuli that had parametrically varied amounts of face strength (i.e., sensory evidence) while we measured subjects’ reaction times. We used two ranges of stimulus variability in alternating experimental runs to test whether the regions we identified were engaged during decisions under different sensory contexts. We identified regions where activity was significantly different from baseline during both ranges of the detection task, and determined which of these regions exhibited activity that correlated with reaction time. This analysis allowed us to identify brain regions that met the criteria established by both hypotheses.
Based on previous studies we expected to find two sets of brain regions with activation patterns that were opposite in their relationship to reaction time. Indeed, we found that the right supplementary eye field (SEF), right frontal eye field (FEF), and right inferior frontal gyrus (IFG) exhibited increased activity relative to baseline during the detection task, which positively covaried with reaction time. By contrast, activity in the left superior frontal sulcus (SFS) in the DLPFC and the left middle temporal gyrus (MTG) showed decreased activity relative to baseline during the task, which negatively covaried with reaction time. The task related changes in these two sets of regions are consistent with results from previous studies, but the sign of these negative activations has not been previously reported. We suggest that both of these patterns of activation can be accounted for by a simple mechanism, whereby increased task difficulty leads to larger deviations of activity, either positively or negatively, from baseline during task performance.
Materials and Methods
Subjects
Twelve right-handed healthy subjects (6 female, age 30.75 ± 2.07 years) participated. All had normal or corrected vision, no neurological or psychiatric history and no structural brain abnormality evident on MRI. Written consent was obtained according to procedures approved by the National Institute of Mental Health Intramural Research Program (NIMH-IRP) Institutional Review Board.
Stimuli
A set of 38 male face images (face database, MPI for Biological Cybernetics, Germany) were degraded by noise as described previously (Heekeren et al., 2004). Briefly, the fast Fourier transforms (FFT) of the images were computed, producing 38 magnitude and 38 phase matrices. Each stimulus was produced by calculating the inverse FFT (IFFT) using the average magnitude matrix of the stimulus set and individual phase matrices. The phase matrix used for the IFFT was a linear combination of a random noise matrix with the original phase matrix computed during the forward FFT. This process resulted in a stimulus set where all images had an identical frequency power spectrum (corresponding to the average magnitude matrix) with graded amounts of noise. Additionally, a weighted mean phase correction was implemented as suggested by Dakin et al. (2002).
Task
Subjects indicated with a button press whether stimuli contained a face or not (Figure 1). Stimuli were presented in two run types that consisted of different noise ranges. High variability (HV) runs contained noise levels from 20 to 100% noise in steps of 20% and low variability (LV) runs contained noise levels from 40 to 60% noise in steps of 5%. These noise levels were selected based on pilot data as being on either the flanks (HV runs) or steep portion (LV runs) of subjects’ psychometric functions as well as being roughly balanced around the point of subjective equality, such that subjects responded roughly equally to either choice. Each noise level appeared 21 times in each run for a total of 105 trials per run and both run types contained stimuli that were degraded to 40 and 60% noise. This task design was originally employed to test for differences in BOLD signal in decision-making regions to these identical stimuli when they occurred during different ranges of stimulus variability, i.e., in different contexts. Because no significant differences were detected between these two run types in the fMRI data, we combined the data from both to test the predictions from the decision-making frameworks described above.
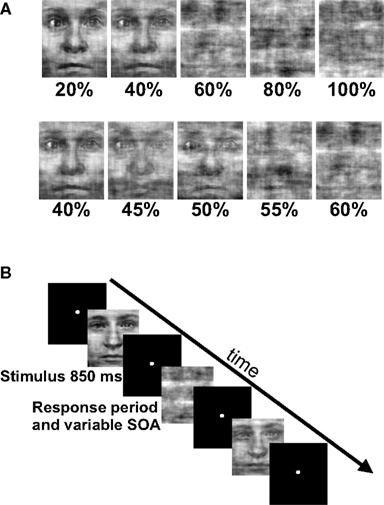
Figure 1. Experimental task and stimuli. (A) In the fMRI experiment we used a rapid event-related design that consisted of phase scrambled face images. Subjects were instructed to respond with a button press as quickly and as accurately as possible as to whether they perceived a face in the phase scrambled image. Each run consisted of five noise levels and 21 exemplars from each noise level. (B) Stimuli appeared for 850 ms followed by a variable SOA that averaged 6 s and ranged from 4 to 10 s. There were two run types: high variability (HV) runs that contained noise levels that ranged from 20 to 100% noise in steps of 20% and low variability (LV) runs that contained noise levels that ranged from 40 to 60% noise in steps of 5%. Note that there were two identical noise levels between the run types, the 40 and 60% trials.
Subjects performed three runs of each type (HV and LV), except for one subject who only completed two of each type due to time constraints. Subjects were not informed about the difference between run types and the order of the two run types was counterbalanced across subjects. Subjects were instructed to fixate a central spot and respond as quickly and as accurately as possible by pressing one of two buttons with their right hand to indicate their decision. Stimuli were projected onto a back-projection screen by an LCD projector (Sharp) for 850 ms using Presentation software (Neurobehavioral Systems Inc, Albany, California). Images subtended a visual angle of approximately 5°. The sequence of events was optimized using OPTSEQ21. Stimuli were presented with stimulus onset asynchronies that averaged 6 s and ranged from 4 to 10 s. The jittering of stimulus onsets allowed for an accurate modeling of the baseline for analysis purposes. In a separate functional localizer run, subjects performed a 1-back discrimination task that was used to map category-selective regions in the brain. The functional localizer run consisted of blocks of images that were either faces, houses and places, or objects and subjects were instructed to press a button when the current image was identical to the previously displayed image. The images used for the localizer were the same as those used by Kriegeskorte et al. (2003).
Data Acquisition and Analysis
Behavioral data
Response choice and response time (RT), defined as the time between the appearance of the stimulus and the button response, were recorded while subjects were in the scanner. An ANOVA was used to test for the main effect of noise for both the HV and LV runs and paired t-tests were used to compare detection performance and RT between the identical stimuli (images of 40 and 60% noise) from both HV and LV runs.
fMRI data acquisition
Whole-brain MRI data were collected on a 3T GE Signa (GE Medical Systems) using an 8-channel phased array coil. Echoplanar imaging (EPI) data were acquired using standard parameters (field of view, 200 mm; matrix, 64 × 64; 32 axial slices, 3.5 mm thick; in-plane resolution, 3.281 mm; repetition time, TR, 2.0 s; echo time, TE, 30 ms; flip angle, 90°). Six runs of 274 volumes each were acquired. An additional run of 292 volumes was collected as a functional localizer. The first four volumes of each run were discarded to allow for magnetization equilibration. A T1-weighted volume (MP-RAGE) was acquired for anatomical comparison (flip angle: 10°, resolution: 0.98 × 0.98 × 1.2 mm3).
fMRI data analysis
fMRI data were analyzed using a mixed-effects approach within the framework of the general linear model (GLM) as implemented in FSL 5.63 (Smith et al., 2004). EPI data pre-processing included slice time correction (Cox, 1996), motion correction using MCFLIRT (FSL), non-brain removal using BET (FSL), spatial smoothing using a Gaussian kernel of 6 mm FWHM, mean-based intensity normalization of all volumes by the same factor and high pass temporal filtering (Gaussian-weighted LSF straight line fitting, with sigma = 50.0 s). Registration to high resolution and standard space images was carried out using FLIRT (Jenkinson et al., 2002). Time-series statistical analysis was carried out using FILM with local autocorrelation correction (Woolrich et al., 2001).
To determine which brain regions were involved in the detection task we first searched for regions where activity was significantly different from baseline during either run type. Next, we searched for regions that were activated during both run types as a way to identify regions that might be generally involved in decision computations, regardless of stimulus variability. Then, we tested these regions for significant correlations with subjects’ RTs to determine which might be involved in decision computations. To address the first issue, contrast maps were computed for each stimulus type, for each subject, using two-thirds of each subject’s data. The third run of each type was left out of the mapping analysis and used as independent data, to avoid selection bias, for use in subsequent analysis (Kriegeskorte et al., 2009). Data from the subject with only two runs of each type was split in half for this purpose. After spatial normalization, contrast images were transformed into standard (MNI152) space using BET and FLIRT from the FSL package2. Group effects (N = 12) were computed by using the transformed contrast images in a mixed-effects model, treating subjects as a random variable and conditions as fixed variables. Trials with no recorded response were modeled as a regressor of no interest. A group level contrast was computed to determine the voxels where activity was significantly different from baseline for both the HV and LV runs separately. Higher-level analysis was carried out using FLAME (fMRIB’s Local Analysis of Mixed Effects) (Beckmann et al., 2003; Woolrich et al., 2004). In the higher-level analysis, we report clusters of maximally activated voxels that (i) survived statistical thresholding at Z > 2.59 and (ii) had a cluster volume of at least 1725 mm3, resulting in a corrected p < 0.05 as determined using AlphaSim in AFNI (Cox, 1996). This analysis yielded two independently corrected maps, one for the HV runs and one for the LV runs (see Tables 1 and 2 for regions). To determine the brain regions that were involved in the detection task regardless of the amount of stimulus variability contained in an experimental run, we computed the conjunction of the two independently corrected maps (Nichols et al., 2005) and the intersecting voxels were used as ROIs (see Table 3) for the subsequent analysis.
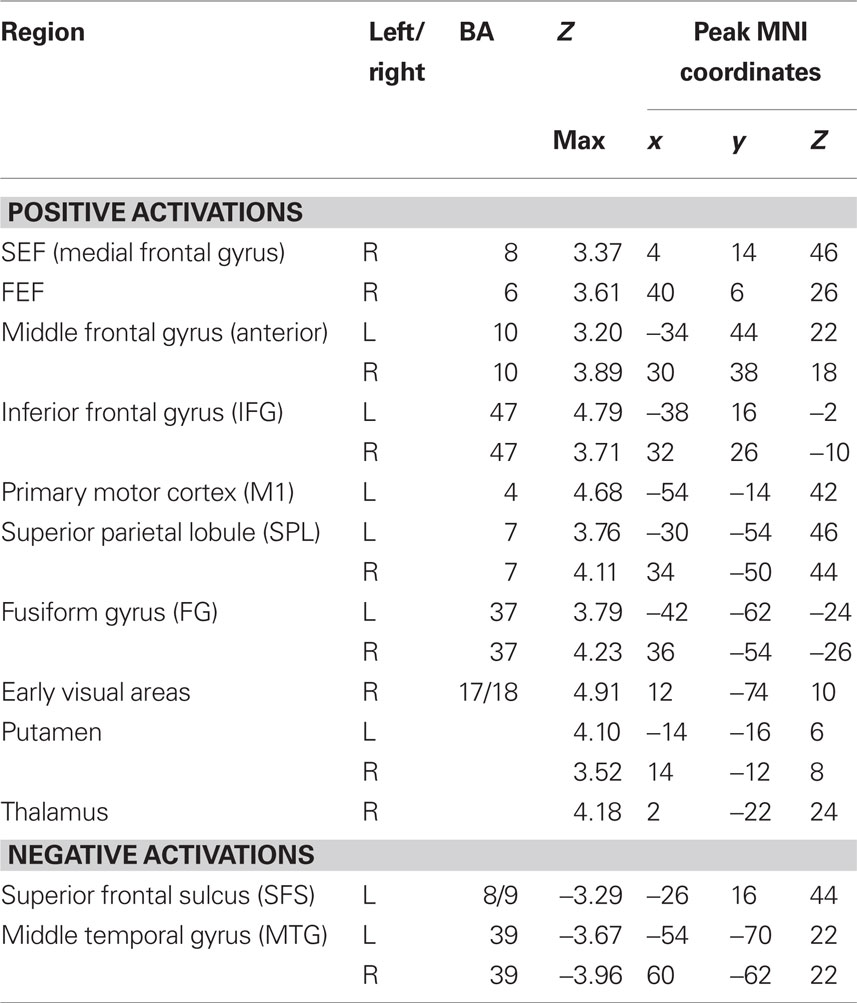
Table 1. Anatomical locations and coordinates of activations during HV runs.
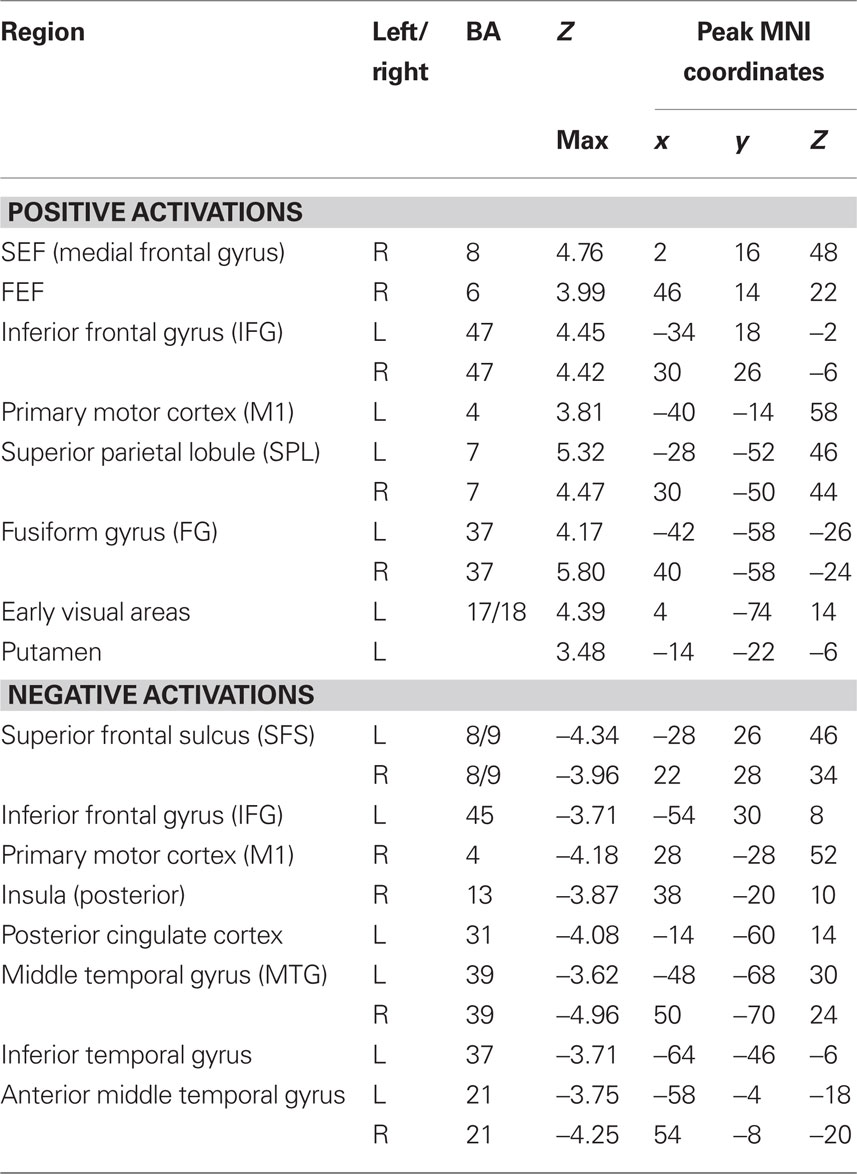
Table 2.Anatomical locations and coordinates of activations during LV runs.
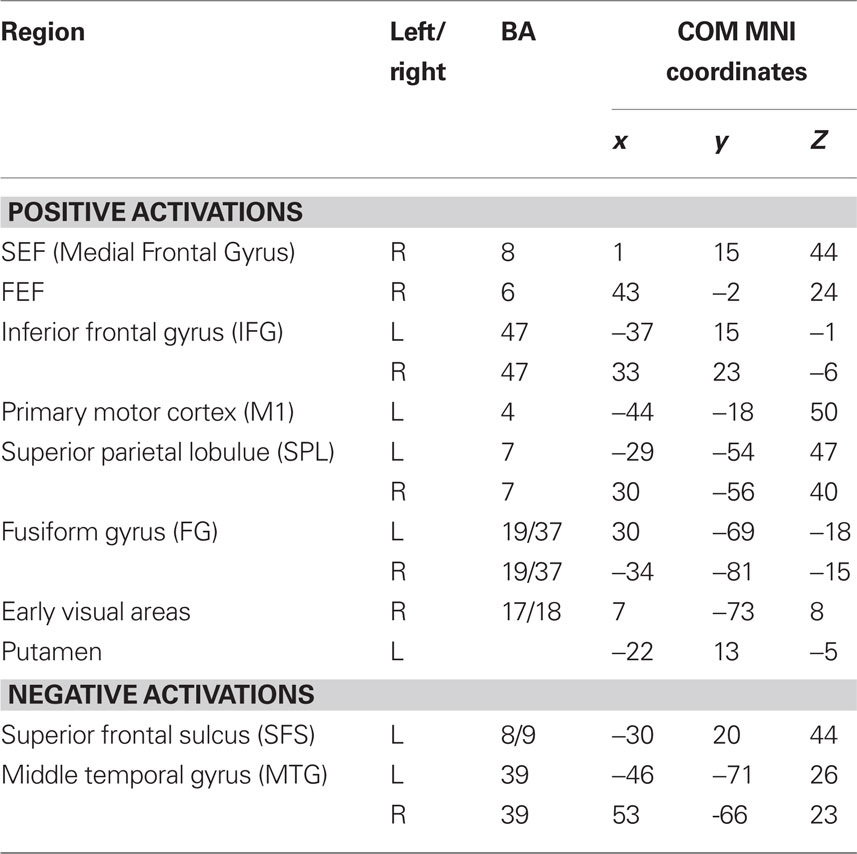
Table 3. Anatomical locations and center of mass coordinates of intersection regions.
The ROIs that were obtained from the previous analysis were used as masks to determine the percent signal change values from each subject from the independent data that were set aside prior to the mapping analysis. The group-averaged percent signal change was then computed and plotted against the group-averaged RTs from those same runs. Linear regression fits were computed for each ROI and the resulting r2, slope and p-values are reported in Table 4.
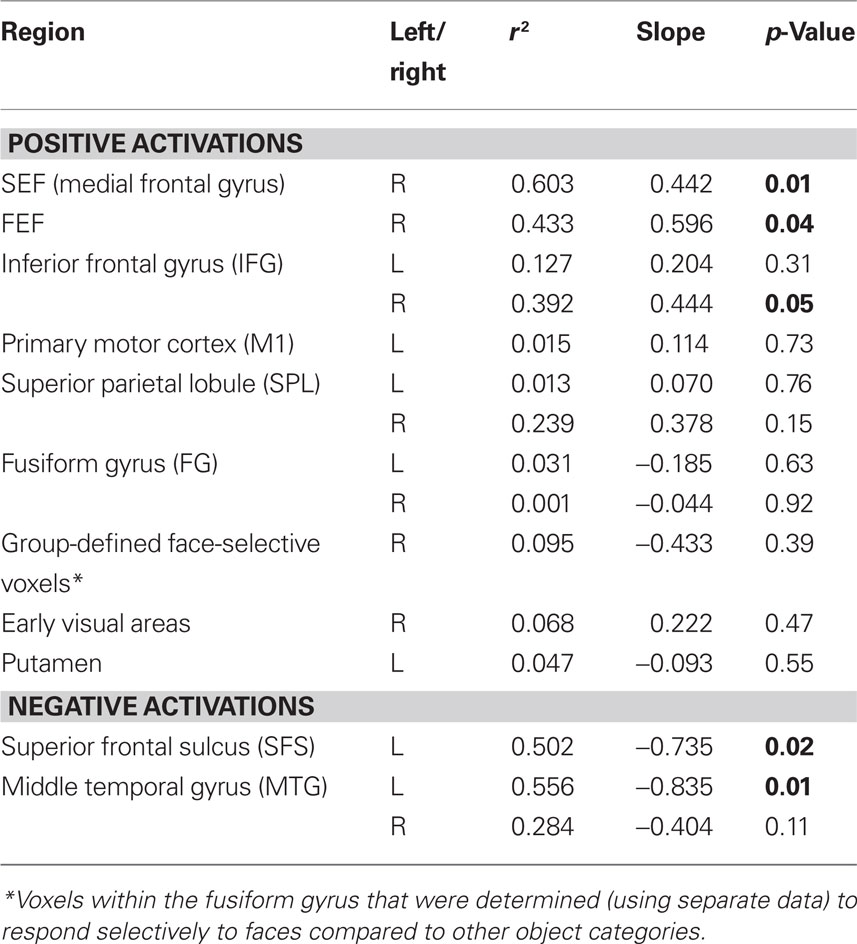
Table 4. Regression values for the relationship between fMRI signal change and response time in commonly activated regions.
Three further analyses were performed to address other aspects of our data. First, to test for differences in brain activity due to stimulus variability, contrasts between the identical stimuli (40 and 60% noise) from both run types were computed using all of the experimental runs. A 2 × 2 model tested for a main effect of stimulus variability, the pair-wise difference between identical stimuli (both 40 and 60%, separately) in different ranges, and the interaction of noise level and the amount of variability. This analysis was carried out and thresholded identically to the previous mapping analysis and no significant voxels clusters were found.
The data from the separate functional localizer runs were used to generate ROIs for the two remaining analyses. In contrast to the activation in ventral temporal cortex that we acquired during our task, the localizer data allowed us to identify voxels that responded selectively to faces. Thus we could relate these signals to a commonly studied portion of visual cortex, often referred to as the “fusiform face area” (Kanwisher et al., 1997). Additionally, the use of these independent data allowed us to average across all of our experimental data to obtain a sufficient number of trials for both hits and misses. For both analyses, the localizer data were preprocessed and analyzed similarly to the data from the main experiment. The first analysis determined the correlation between the percent signal change values in group-defined face-selective voxels and RT. These face-selective voxels were identified by computing a contrast of faces greater than objects from each subject’s localizer run and applying a threshold to a group map at Z = 3.1 (p < 0.001 uncorrected). This resulted in a group-averaged ROI in ventral temporal cortex that was defined in an analogous way to the ROIs made from the main experimental data. This ROI was used as a mask to plot the group-averaged percent signal change values against RT. A second analysis determined whether the activity in face-selective voxels reflected subjects’ perceptual judgments about the stimuli. To select face-selective voxels from each subject, a contrast between face and object images was thresholded at Z = 2.59 and voxels that intersected with a hand-drawn mask covering ventral temporal cortex were used as an ROI. All subjects had voxels that survived these criteria. Percent signal change values were computed from all runs of each subject’s main experimental data for both detected and rejected trials. Values from each subject’s individually defined ROI were averaged at the group level. An ANOVA was used to determine the main effect of detection and pair-wise comparisons were made between the HV and LV runs for the identical stimuli on both detected and rejected trials.
Results
Behavioral Data
Figure 2 shows that subjects’ mean detection frequency decreased and mean RT increased as noise in the stimuli increased. Detection frequency on both HV and LV runs showed a significant main effect of noise (both p < 0.001) as did RT (LV, p < 0.001, HV, p < 0.016). There was a very small but significant difference in the detection rate of the 60% noise stimuli between the HV and LV runs (p < 0.05), but not between the 40% noise stimuli ( p < 1) and there were no significant RT differences between the two identical stimuli (40%, p < 0.47 and 60%, p < 0.42). Thus, overall, the amount of stimulus variability in a run had little effect on behavioral measures for the identical stimuli.
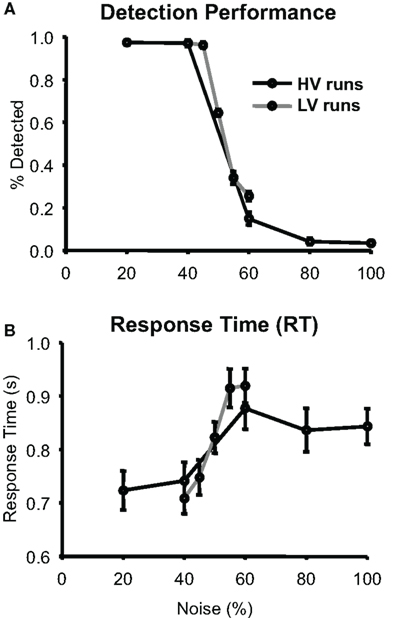
Figure 2. Behavioral Performance. (A) Group average of detection performance (N = 12) as a function of noise measured during the scan sessions; error bars are standard error of the mean (SEM). (B) Group average of response times (RT) are plotted with the same conventions as (A).
fMRI Results
Comparisons of identical stimuli across run types
A whole-brain mapping analysis comparing activations to the identical stimuli in the two different run types revealed no significant regions (see Materials and Methods). Further, there were no significant differences in the responses of face-selective voxels to the identical stimuli in HV and LV runs for trials that were either detected or rejected.
Main task effect
Tables 1 and 2 list the anatomical locations of the voxel clusters where BOLD signal was significantly different from baseline during the HV and LV runs, respectively. Overall, more brain regions exhibited significantly different activity relative to baseline during the LV runs than the HV runs. This is particularly true for regions where we observed a decrease in BOLD signal relative to baseline, such as the posterior insula and posterior cingulate cortex.
Commonly activated regions
A conjunction analysis of the thresholded maps from these two run types identified regions where activity was significantly different from baseline during only one range of variability and also yielded several intersecting regions (Figure 3 and Table 3). Voxels within the right SEF, right FEF, bilateral IFG, left primary motor cortex (M1), bilateral superior parietal lobule (SPL), bilateral fusiform gyrus (FG), early visual areas (including Brodmann area [BA] 17 and 18), and left putamen showed significant increases in their activity relative to baseline during both experimental run types. Voxels within the left SFS and bilateral MTG showed significant decreases in activation relative to baseline during both experimental run types.
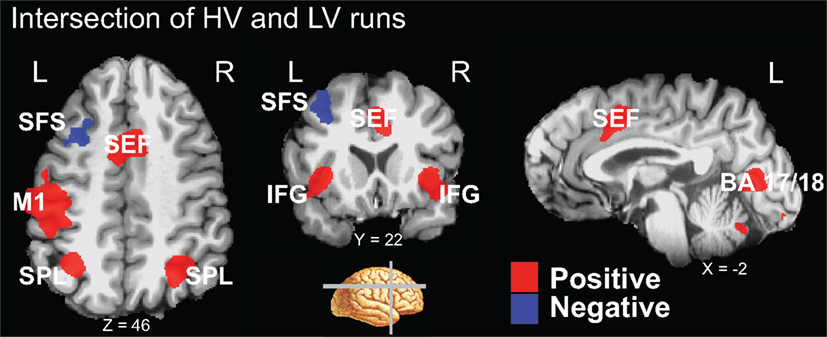
Figure 3. Intersection of activation from the HV and LV runs. Regions that survived correction from both the HV and LV runs were used in a conjunction analysis to determine those regions commonly activated between noise ranges. HV runs consisted of noise levels that ranged from 20 to 100% noise in steps of 20% while LV runs consisted of noise levels than ranged from 40 to 60% in steps of 5% (see Figure 1). Regions that intersected are plotted on a single subject’s brain converted to standard space (see Table 3). Regions that commonly exhibited activity greater than baseline, shown in red, included the right SEF, bilateral IFG, left motor cortex (M1), bilateral SPL, and early visual areas (including BA 17 and 18). Not shown are the right FEF, bilateral fusiform gyrus, and left putamen. Regions that commonly exhibited activity less than baseline, shown in blue, included the left SFS, and bilateral MTG (not shown).
Correlation with RT
Using the ROIs derived from the conjunction analysis, we determined the percent signal change evoked by each stimulus from independent data (see Materials and Methods). The percent signal change values from each ROI were then plotted against the group-averaged RTs and fit by linear regression (Figure 4; Table 4). Three of the areas that showed an increase in BOLD signal relative to baseline had a significant positive relationship between RT and percent signal change: right SEF (r2 = 0.603, p < 0.01), right FEF (r2 = 0.433, p < 0.05), and the right IFG (r2 = 0.392, p < 0.05). Two of the regions that showed a decrease in BOLD signal relative to baseline had a significant negative relationship between RT and percent signal change: the left SFS (r2 = 0.502, p < 0.05) and left MTG (r2 = 0.556, p < 0.05).
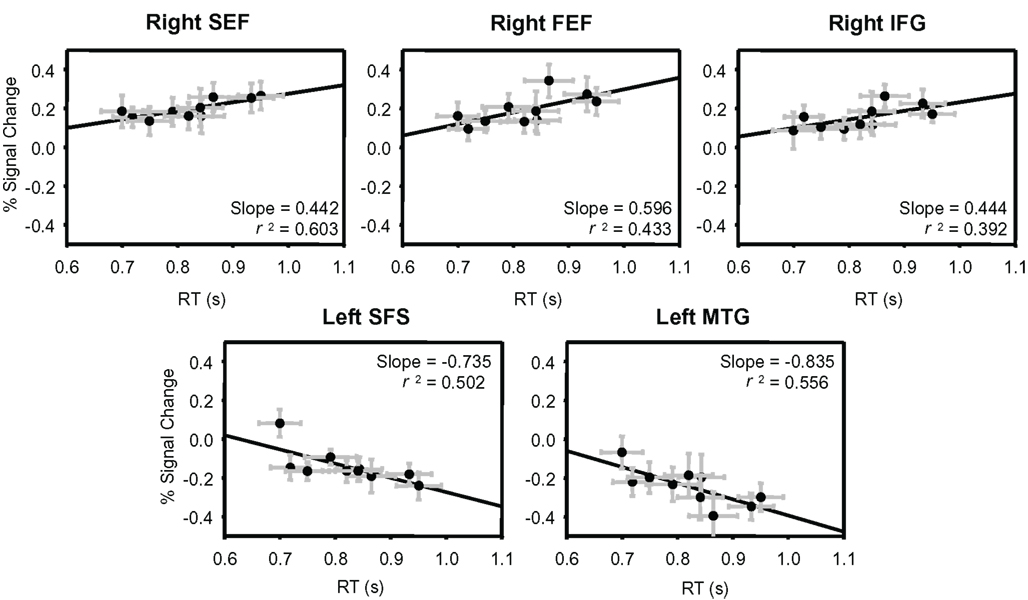
Figure 4. Percent signal change plotted against group-averaged RT. Independent data were used to plot percent signal change values from the ROIs determined from the conjunction analysis. These percent signal change values are plotted against the group-averaged RTs from those same runs. The five regions that showed a significant correlation between percent signal change and RT are shown: right SEF, right FEF, right IFG, left SFS, and left MTG. All ROIs and their correlation values are listed in Table 4. Error bars are SEM.
Face responsive voxel analysis
Voxels in the FG where activity was significantly greater than baseline during the main experiment showed no significant relationship between the BOLD signal and RT (Table 4). Additionally, face-selective voxels, as defined from the separate functional localizer data, showed no significant relationship between the BOLD signal and RT (Table 4).
We also investigated the relationship between detection performance and noise in face-selective voxels (Figure 5). Consistently, in both run types, and for all but one noise level, trials where a face was detected led to a greater response in face-selective voxels than did trials where the subject reported not seeing a face at the same noise level (p < 0.01 for both HV and LV).
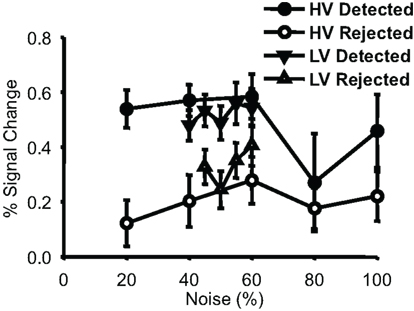
Figure 5. Percent signal change values from localizer-defined face-selective voxels. Group-averaged percent signal change values (plotted with SEM) are shown for each behavioral response to each condition. Data points are displayed for every noise level where there were at least four subjects that had 5 or more trials per condition (there were insufficient numbers to plot rejected 40% noise trials from the narrow runs). Detected trials had a larger response in these face-selective voxels than did rejected trials for both run types.
Discussion
We sought to determine regions of the brain that are involved in the computation of perceptual decisions. We searched for regions that showed either increased or decreased activity relative to baseline during a face detection task with experimental runs that contained different ranges of stimulus variability. Of the regions where activity was significantly different from baseline during runs of both variability levels, we determined which might be involved in the computation of perceptual decisions by investigating which exhibited activity that correlated with reaction times. We found that five regions exhibited activity that correlated with reaction times: activity in the right SEF, right FEF, and right IFG positively correlated with RT, whereas activity in the left SFS in the DLPFC and left MTG negatively correlated with RT. Finally, we showed that during the face detection task, activation in face-selective voxels reflected subjects’ perceptual judgments by being greater on trials when subjects detected the presence of a face compared to trials when they rejected the presence of a face at the same noise level.
Representation of Stimulus Evidence
Identical stimuli
Our design allowed us to test whether there were any significant differences in BOLD signal in response to identical stimuli (face images degraded to 40 or 60% noise) that occurred during runs with different ranges of stimulus variability. Whole-brain analysis revealed no voxel clusters that exhibited significantly different activity in response to these identical stimuli during different runs. Further, comparing the responses in face-selective voxels to these identical stimuli on HV and LV runs for either detected or rejected trials revealed no significant differences. Although not the major focus of this paper, this latter result may have important implications for models of decision making. Despite the large difference in variability of the stimuli between run types, our findings demonstrate that, in this task, stimulus variability does not significantly alter how the brain represents sensory information provided by identical stimuli nor does it affect, in any major way, how this information is processed by decision-making regions.
Face responsive activations during the detection task
A comparison of the change in BOLD signal in face-selective voxels on trials where subjects classified the images as containing a face or not revealed larger responses, on average, on trials when the subjects detected a face. The activation on these detected trials did not show a strong effect of noise, as had been demonstrated on correct trials in face-selective voxels in our previous study (Heekeren et al., 2004). This is likely due to the change of task between the two studies; whereas Heekeren et al. (2004) used a categorical discrimination task with noisy faces and houses, we employed a face detection task with noisy faces only. The imagining, or misperception, of a face has been shown to activate face-selective brain regions (Ishai et al., 2000; O’Craven and Kanwisher, 2000; Summerfield et al., 2006) and it is possible that the search for a face in a noisy image leads to increased activity in face-selective regions during a face detection task. Additionally, the larger activity on detected trials could reflect a combination of both bottom-up sensory processing and subsequent, top-down or post-decision activity that reflects a subject’s perceptual judgment. In a contrast detection task, Ress and Heeger (2003) demonstrated that the amplitude of the BOLD signal to near-threshold stimuli in early visual cortex better reflected a subject’s perceptual judgment than it did the physical properties of the stimulus. Here, we have shown a similar effect in face-selective voxels during a face detection task.
Decision Computation
Commonly Activated Regions – Positive Activations
The right SEF, right FEF and right IFG showed an increase in BOLD signal relative to baseline during both HV and LV runs and the degree of activation in these regions was positively correlated with RT, i.e., the activation was larger on trials that had a longer RT. Using different tasks and different analysis techniques, several groups have found similar results. Grinband et al. (2006, 2008) using a method that explicitly models differences in reaction times, reported a relationship between the BOLD signal and uncertainty in a network of fronto-striatal-thalamic regions that included bilateral medial frontal gyrus and bilateral anterior insula. The peak coordinates they reported for the medial frontal gyrus (x = −8, y = 36, z = 36) are slightly anterior to the center of mass of activation that we found in the SEF (x = 1, y = 15, z = 44), but the peak coordinates they reported for the right anterior insula (x = 36, y = 26, z = 8) are very close to the center of mass of activation that we found in the right IFG (x = 33, y = 23, z = −6). Similarly, Thielscher and Pessoa (2007) found that the BOLD signal in the anterior cingulate cortex (x = 0, y = 20, z = 40) and right IFG (x = 35, y = 23, z = −5) covaried positively with RT during a fear-disgust discrimination. Both of those peak coordinates are very close to the peak coordinates that we found in the SEF and IFG, respectively. Activations in the SEF and bilateral IFG were also reported in our previous studies as regions that responded more on trials with low-coherence compared to those with high-coherence stimuli (Heekeren et al., 2004, 2006). The proximity of these peak activation coordinates across studies suggests that they represent elements of a common network of brain regions. In fact, these regions have been associated with the attentional network and may play a role in attentional processing (Corbetta and Shulman, 2002; Pessoa et al., 2003). It is possible that differential eye movements, or covert attention, has led to increased activation during more difficult trials in these areas. However, the roughly 200 ms difference in RTs between the easiest and hardest trials could at best account for only one additional saccade, which does not seem long enough to fully account for these differences in activation. Additionally, we cannot rule out the possibility that these higher-level brain regions are actually encoding stimulus strength rather than task difficulty – as these two properties are correlated in our task. While we cannot disentangle these factors in our data, Grinband et al. (2006) demonstrated that similar regions represent stimulus uncertainty (i.e., task difficulty) during a categorization task.
A number of other regions showed increased BOLD signal in both HV and LV runs, but activations in these regions did not correlate significantly with RT (see Table 3). Two examples are the left IFG and bilateral SPL. These regions may therefore be more generally involved in attention, visual processing or response selection rather than playing a critical role in the formation of perceptual decisions. Additionally, activity in early visual areas (BA 17 and 18), the bilateral FG, and face-selective voxels in the FG showed no correlation with RT. It was surprising that activity in face-selective regions did not correlate with RT as, in our task, stimulus evidence and RT were correlated. Activations in primary motor cortex (M1) and the left putamen also did not correlate with RT and instead likely reflected the button press that subjects used to render their response.
Commonly activated regions – negative activations
BOLD signals in the left SFS and bilateral MTG decreased relative to baseline during both HV and LV runs and the amount of decrease in the left SFS and left MTG significantly correlated with RT. Significant activity in bilateral MTG was not found in our previous studies, but the peak coordinates from the left SFS activation from the HV (x = −26, y = 16, z = 44 ) and LV (x = −28, y = 26, z = 46) runs as well as the center of mass of the intersecting region (x = −30, y = 20, z = 44) are in strikingly similar locations to the region observed in our previous reports [peak voxels were at x = −24, y = 24, z = 36 (Heekeren et al., 2004) and x = −23, y = 29, z = 37 (Heekeren et al., 2006)]. In these previous studies, we demonstrated that the activity in the left SFS within the DLPFC (i) is greater in response to high-coherence than to low-coherence stimuli; (ii) covaries with the difference signal between face- and house-selective regions in ventral temporal cortex; (iii) predicts behavioral performance in a categorization task; and (iv) reflects the computation of a decision in a way that is not tied to a specific motor response (Heekeren et al., 2004, 2006). In the present study, we have additionally demonstrated that the BOLD signal in the left SFS is negatively correlated with RT across different ranges of stimulus variability during a face detection task. This negative correlation means that as RT increased with more difficult trials, the region showed a progressive decrease in BOLD signal. This is similar to our previous reports where we demonstrated greater BOLD signal in the left SFS on trials with high-coherence stimuli (i.e., easier trials with faster RTs).
These negatively activating regions show significant overlap with regions that have been referred to as the “default mode network” whose activity has been shown to be more active during rest periods than during task periods across a wide variety of conditions (Raichle et al., 2001). It is unclear whether regions in the “default mode network” disengage during task performance or are actually involved in sensory processing (Morcom and Fletcher, 2007), but McKiernan et al. (2003) have demonstrated that the BOLD signal in these regions parametrically decreases with changes in task difficulty. Among the regions in the human brain that were reported to deactivate by McKiernan et al. is the middle occipital gyrus, which partially overlaps with the region we found in the MTG, and the left SFS (x = −23, y = 25, z = 46), which is very close to the SFS coordinates in the present study. Aside from these similarities with our current study, these authors also reported numerous other regions in the default mode network (including the left anterior cingulate gyrus, left superior frontal gyrus, bilateral posterior cingulate gyrus, bilateral precuneus, and bilateral SPL), which did not exhibit significant decreases in activity relative to baseline during both ranges of stimulus variability in our face detection task.
Additional considerations
In the current study, activity in several areas was significantly different from baseline across two levels of stimulus variability and positively or negatively covaried with subjects’ reaction times. Previously we have argued, based on findings from single-unit studies, that regions showing a larger BOLD signal on trials with high stimulus coherence relative to trials with low stimulus coherence could be involved in the computation of a perceptual decision (Heekeren et al., 2004, 2006, 2008). By comparing the activity of sensory areas that represent evidence in support of different options, these regions would exhibit greater activity when there is clear evidence in support of one option relative to when sensory evidence is more ambiguous. However, regions that show the opposite profile (i.e., larger BOLD signal on trials with low stimulus coherence) have been implicated by other authors as being involved in decision making (Binder et al., 2004; Grinband et al., 2006; Thielscher and Pessoa, 2007). Our present data identify two networks of regions, each of which fits one of these criteria, suggesting that both networks may play a role in perceptual decision making.
One important observation from these data is that the regions where activity positively correlates with reaction times during the task all exhibit positive activations relative to baseline. Likewise, the regions where activity negatively correlates with reaction times during the task all exhibit negative activations relative to baseline. These patterns of activation suggest a common mechanism whereby increasing task demands lead to a larger deviation of a region’s activity from baseline during more difficult trials. This framework is an appealing explanation because it can completely account for the observation that regions that positively activate during the task exhibit larger activations on trials with longer reaction times while regions that negatively activate during the task exhibit larger deactivations (see Figure 4). This idea is also compatible with previous studies that have associated several of the regions that positively activated during this task with the attentional network (Corbetta and Shulman, 2002; Pessoa et al., 2003), while the regions that negatively activated in our study have been associated with the default mode network (Raichle et al., 2001).
While this interpretation differs from that of our previous work, it does not rule out the possibility that negatively activating regions are performing important functions during perceptual decisions. A central question is whether a diminished decrease in BOLD signal on easier trials is equivalent to an increase in BOLD signal? Are these default mode network regions being deactivated because of a reallocation of attentional resources – with less deactivation caused by less attentional demand, or is the increase above a negatively changed BOLD signal somehow indicative of additional computations taking place in these areas that are related to the task? It may be possible to gain answers to these questions by perturbations of the default mode network by methods such as TMS, or with electrical recordings from homologous regions in animals. Already, there is some evidence that regions of cat cortex thought to be homologous to the human default mode network can show decreases in LFP power, a measure linked to the BOLD signal (Logothetis et al., 2001; Mukamel et al., 2005) accompanied by increases in spike rates (Popa et al., 2009). Thus, changes in the BOLD signal, irrespective of sign, may indeed reflect task relevant changes in neuronal activity.
Conflict of Interest Statement
The authors declare that the research was conducted in the absence of any commercial or financial relationships that could be construed as a potential conflict of interest.
Footnotes
References
Beckmann, C. F., Jenkinson, M., and Smith, S. M. (2003). General multilevel linear modeling for group analysis in FMRI. Neuroimage 20, 1052–1063.
Binder, J. R., Liebenthal, E., Possing, E. T., Medler, D. A., and Ward, B. D. (2004). Neural correlates of sensory and decision processes in auditory object identification. Nat. Neurosci. 7, 295–301.
Corbetta, M., and Shulman, G. L. (2002). Control of goal-directed and stimulus-driven attention in the brain. Nat. Rev. Neurosci. 3, 201–215.
Cox, R. W. (1996). AFNI: software for analysis and visualization of functional magnetic resonance neuroimages. Comput. Biomed. Res. 29, 162.
Dakin, S. C., Hess, R. F., Ledgeway, T., and Achtman, R. L. (2002). What causes non-monotonic tuning of fMRI response to noisy images? Curr. Biol. 12, R476.
Gold, J. I., and Shadlen, M. N. (2007). The neural basis of decision making. Annu. Rev. Neurosci. 30, 535–574.
Grinband, J., Hirsch, J., and Ferrera, V. P. (2006). A neural representation of categorization uncertainty in the human brain. Neuron 49, 757–763.
Grinband, J., Wager, T. D., Lindquist, M., Ferrera, V. P., and Hirsch, J. (2008). Detection of time-varying signals in event-related fMRI designs. Neuroimage 43, 509–520.
Gross, J., and Ploner, M. (2009). Perceptual decisions: from sensory signals to behavior. Curr. Biol. 19, R847–R849.
Heekeren, H. R., Marrett, S., Bandettini, P. A., and Ungerleider, L. G. (2004). A general mechanism for perceptual decision-making in the human brain. Nature 431, 859–862.
Heekeren, H. R., Marrett, S., Ruff, D. A., Bandettini, P. A., and Ungerleider, L. G. (2006). Involvement of human left dorsolateral prefrontal cortex in perceptual decision making is independent of response modality. Proc. Natl. Acad. Sci. U.S.A. 103, 10023–10028.
Heekeren, H. R., Marrett, S., and Ungerleider, L. G. (2008). The neural systems that mediate human perceptual decision making. Nat. Rev. Neurosci. 9, 467–479.
Ho, T. C., Brown, S., and Serences, J. T. (2009). Domain general mechanisms of perceptual decision making in human cortex. J. Neurosci. 29, 8675–8687.
Ishai, A., Ungerleider, L. G., and Haxby, J. V. (2000). Distributed neural systems for the generation of visual images. Neuron 28, 979–990.
Jenkinson, M., Bannister, P., Brady, M., and Smith, S. (2002). Improved optimization for the robust and accurate linear registration and motion correction of brain images. Neuroimage 17, 825.
Kanwisher, N., McDermott, J., and Chun, M. M. (1997). The fusiform face area: a module in human extrastriate cortex specialized for face perception. J. Neurosci. 17, 4302–4311.
Kim, J. N., and Shadlen, M. N. (1999). Neural correlates of a decision in the dorsolateral prefrontal cortex of the macaque. Nat. Neurosci. 2, 176–185.
Kriegeskorte, N., Simmons, W. K., Bellgowan, P. S., and Baker, C. I. (2009). Circular analysis in systems neuroscience: the dangers of double dipping. Nat. Neurosci. 12, 535–540.
Kriegeskorte, N., Sorger, B., Naumer, M., Schwarzbach, J., van den Boogert, E., Hussy, W., and Goebel, R. (2003). Human cortical object recognition from a visual motion flowfield. J. Neurosci. 23, 1451–1463.
Logothetis, N. K., Pauls, J., Augath, M., Trinath, T., and Oeltermann, A. (2001). Neurophysiological investigation of the basis of the fMRI signal. Nature 412, 150–157.
McKiernan, K. A., Kaufman, J. N., Kucera-Thompson, J., and Binder, J. R. (2003). A parametric manipulation of factors affecting task-induced deactivation in functional neuroimaging. J. Cogn. Neurosci. 15, 394–408.
Morcom, A. M., and Fletcher, P. C. (2007). Does the brain have a baseline? Why we should be resisting a rest. Neuroimage 37, 1073–1082.
Mukamel, R., Gelbard, H., Arieli, A., Hasson, U., Fried, I., and Malach, R. (2005). Coupling between neuronal firing, field potentials, and FMRI in human auditory cortex. Science 309, 951–954.
Nichols, T., Brett, M., Andersson, J., Wager, T., and Poline, J. B. (2005). Valid conjunction inference with the minimum statistic. Neuroimage 25, 653–660.
O’Craven, K. M., and Kanwisher, N. (2000). Mental imagery of faces and places activates corresponding stiimulus-specific brain regions. J. Cogn. Neurosci. 12, 1013–1023.
Pessoa, L., Kastner, S., and Ungerleider, L. G. (2003). Neuroimaging studies of attention: from modulation of sensory processing to top-down control. J. Neurosci. 23, 3990.
Ploran, E. J., Nelson, S. M., Velanova, K., Donaldson, D. I., Petersen, S. E., and Wheeler, M. E. (2007). Evidence accumulation and the moment of recognition: dissociating perceptual recognition processes using fMRI. J. Neurosci. 27, 11912–11924.
Popa, D., Popescu, A. T., and Pare, D. (2009). Contrasting activity profile of two distributed cortical networks as a function of attentional demands. J. Neurosci. 29, 1191–1201.
Raichle, M. E., MacLeod, A. M., Snyder, A. Z., Powers, W. J., Gusnard, D. A., and Shulman, G. L. (2001). A default mode of brain function. Proc. Natl. Acad. Sci. U.S.A. 98, 676–682.
Ress, D., and Heeger, D. J. (2003). Neuronal correlates of perception in early visual cortex. Nat. Neurosci. 6, 414–420.
Rolls, E. T., Grabenhorst, F., and Deco, G. (2010) Decision-making, errors, and confidence in the brain. J. Neurophysiol. PMID: 20810685.
Romo, R., Hernandez, A., and Zainos, A. (2004). Neuronal correlates of a perceptual decision in ventral premotor cortex. Neuron 41, 165.
Shadlen, M. N., and Newsome, W. T. (1996). Motion perception: seeing and deciding. Proc. Natl. Acad. Sci. U.S.A. 93, 628–633.
Shadlen, M. N., and Newsome, W. T. (2001). Neural basis of a perceptual decision in the parietal cortex (area LIP) of the rhesus monkey. J. Neurophysiol. 86, 1916–1936.
Smith, S. M., Jenkinson, M., Woolrich, M. W., Beckmann, C. F., Behrens, T. E. J., Johansen-Berg, H., Bannister, P. R., De Luca, M., Drobnjak, I., and Flitney, D. E. (2004). Advances in functional and structural MR image analysis and implementation as FSL. Neuroimage 23, S208.
Summerfield, C., Egner, T., Mangels, J., and Hirsch, J. (2006). Mistaking a house for a face: neural correlates of misperception in healthy humans. Cereb. Cortex 16, 500–508.
Thielscher, A., and Pessoa, L. (2007). Neural correlates of perceptual choice and decision making during fear-disgust discrimination. J. Neurosci. 27, 2908–2917.
Tosoni, A., Galati, G., Romani, G. L., and Corbetta, M. (2008). Sensory-motor mechanisms in human parietal cortex underlie arbitrary visual decisions. Nat. Neurosci. 11, 1446–1453.
Woolrich, M. W., Behrens, T. E., Beckmann, C. F., Jenkinson, M., and Smith, S. M. (2004). Multilevel linear modelling for FMRI group analysis using Bayesian inference. Neuroimage 21, 1732–1747.
Keywords: evidence accumulation, face perception, fMRI
Citation: Ruff DA, Marrett S, Heekeren HR, Bandettini PA and Ungerleider LG (2010) Complementary roles of systems representing sensory evidence and systems detecting task difficulty during perceptual decision making. Front. Neurosci. 4:190. doi: 10.3389/fnins.2010.00190
Received: 25 July 2010;
Accepted: 24 October 2010;
Published online: 23 November 2010.
Edited by:
Shu-Chen Li, Max Planck Institute for Human Development, GermanyReviewed by:
Mauricio R. Delgado, Rutgers-Newark: The State University of New Jersey, USAHyojung Seo, Yale University School of Medicine, USA
Mark E. Wheeler, University of Pittsburgh, USA
Copyright: © 2010 Ruff, Marrett, Heekeren, Bandettini and Ungerleider. This is an open-access article subject to an exclusive license agreement between the authors and the Frontiers Research Foundation, which permits unrestricted use, distribution, and reproduction in any medium, provided the original authors and source are credited.
*Correspondence: Leslie G. Ungerleider, Laboratory of Brain and Cognition, National Institute of Mental Health, Building 10, Room 4C104, 10 Center Drive, MSC 1366, Bethesda, MD 20892-1366 USA. e-mail: ungerlel@mail.nih.gov