Munc18-1 is a dynamically regulated PKC target during short-term enhancement of transmitter release
- École Polytechnique Fédérale de Lausanne (EPFL), Switzerland
- Neuroscience Campus Amsterdam, Netherlands
- VU University, Netherlands
Abstract
Transmitter release at synapses is regulated by preceding neuronal activity, which can give rise to short-term enhancement of release like post-tetanic potentiation (PTP). Diacylglycerol (DAG) and Protein-kinase C (PKC) signaling in the nerve terminal have been widely implicated in the short-term modulation of transmitter release, but the target protein of PKC phosphorylation during short-term enhancement has remained unknown. Here, we use a gene-replacement strategy at the calyx of Held, a large CNS model synapse that expresses robust PTP, to study the molecular mechanisms of PTP. We find that two PKC phosphorylation sites of Munc18-1 are critically important for PTP, which identifies the presynaptic target protein for the action of PKC during PTP. Pharmacological experiments show that a phosphatase normally limits the duration of PTP, and that PTP is initiated by the action of a ‘conventional’ PKC isoform. Thus, a dynamic PKC phosphorylation/de-phosphorylation cycle of Munc18-1 drives short-term enhancement of transmitter release during PTP.
https://doi.org/10.7554/eLife.01715.001eLife digest
Brain function depends on the rapid transfer of information from one brain cell to the next at junctions known as synapses. Small packages called vesicles play an important role in this process. The arrival of an electrical action potential at the nerve terminal of the first cell causes some vesicles in the cell to fuse with the cell membrane, and this leads to the neurotransmitters inside the vesicles being released into the synapse. The neurotransmitters then bind to receptors on the second cell, which leads to an electrical signal in the second cell. A protein called Munc18-1 has a central role in the fusion of the vesicle at the cell membrane.
The strength of a synapse—that is, how easily the first brain cell can impact the electrical behaviour of the second—can change, and this ‘synaptic plasticity’ is thought to underlie learning and memory. Long-term changes in synaptic strength require additional receptors to be inserted into the membrane of the second cell. However, synapses can also be temporarily strengthened: the arrival of a burst of action potentials—a tetanus—causes some synapses to increase the amount of neurotransmitter they release in response to any subsequent, single, action potential.
This temporary increase in synaptic strength, which is known as post-tetanic potentiation, requires an enzyme called protein kinase C; the role of this enzyme is to phosphorylate specific target proteins (i.e., to add phosphate groups to them). Now, Genç et al. have genetically modified a mouse synapse in vivo and shown that protein kinase C brings about post-tetanic potentiation by phosphorylating Munc18-1. Furthermore, pharmacological experiments show that proteins called phosphatases, which de-phosphorylate proteins, normally terminate the post-tetanic potentiation after about one minute. Taken together, the study identifies a target protein which is phosphorylated by protein kinase C during post-tetanic potentiation. The study also suggests that in addition to its fundamental role in vesicle fusion, the phosphorylation state of Munc18-1 can change the probability of vesicle fusion in a more subtle way, thereby contributing to synaptic plasticity.
https://doi.org/10.7554/eLife.01715.002Introduction
Vesicle fusion and transmitter release at synapses is a fundamentally important signaling mechanism that guarantees fast information transfer between neurons (Südhof, 2004). Interestingly, transmitter release is not static, but the amount of quanta released with each presynaptic action potential (AP) can vary dynamically, depending on the recent history of presynaptic activity. During high-frequency activity, short-term depression leads to a decrease of release in many synapses, but following recovery from depression, transmitter release can overshoot, giving rise to short-term enhancement of release. Various forms of short-term enhancement, like facilitation, augmentation and post-tetanic potentiation (PTP), have been observed and discriminated based on their duration (Magleby and Zengel, 1975; Zucker and Regehr, 2002). There is good evidence that the longer-lasting of these, augmentation and PTP, depend on the activation of intracellular second messengers in the nerve terminal, which in turn influence the release machinery.
A second messenger with a centrally important role in presynaptic plasticity is diacylglycerol (DAG), which can activate both protein kinase-C and Munc13-1 (Lackner et al., 1999; Rhee et al., 2002; Wierda et al., 2007). During augmentation, activation of the presynaptic protein Munc13-1 either by DAG or by Ca2+/Calmodulin results in increased vesicle priming (Rosenmund et al., 2002; Junge et al., 2004). The other common form of short-term enhancement, PTP, has been observed at excitatory synapses in hippocampus (McNaughton, 1982; Lee et al., 2007), cerebellum (Beierlein et al., 2007), calyx of Held brainstem synapses (Habets and Borst, 2005; Korogod et al., 2005) and at the neuromuscular junction (Magleby and Zengel, 1975). PTP has been shown to be sensitive to pharmacological inhibition of PKC (Alle et al., 2001; Brager et al., 2003; Korogod et al., 2007), and deletion of the PKC α and β genes in mice suppressed PTP at the calyx synapse (Fioravante et al., 2011). Therefore, PTP is likely caused by a presynaptic PKC phosphorylation step, but the target protein of PKC during PTP has remained unknown.
Munc18-1 is a member of the Sec1/Munc18 family of proteins essential for membrane fusion from yeast to mammals (Verhage et al., 2000; Südhof and Rothman, 2009). Munc18-1 has two consensus sites for PKC phosphorylation (Fujita et al., 1996) which become phosphorylated during depolarization of synaptosomes (de Vries et al., 2000), and which are necessary for phorbol ester potentiation of transmitter release in cultured neurons (Wierda et al., 2007). Therefore, Munc18-1 is a candidate for PKC phosphorylation during PTP. Nevertheless, there are other presynaptic proteins which might act as PKC targets. First, SNAP-25 and Synaptotagmin-1 (Syt1) have PKC consensus sites (Shimazaki et al., 1996, Hilfiker et al., 1999). However, no evidence was found for an involvement of SNAP-25 in the phorbol ester potentiation of synaptic transmission in hippocampal neurons (Finley et al., 2003), and the PKC/CaM kinase consensus site in Syt1 is not conserved in Syt2 (Nagy et al., 2006). Since robust PTP is also observed at synapses which express Syt2 as their main Ca2+ sensor, like the calyx of Held and neuromuscular synapses (Pang et al., 2006), Syt1 is unlikely a general phosphorylation target for the induction of PTP. Second, ion channels like voltage-gated K+ channels and Ca2+ channels are targets of PKC phosphorylation (Zamponi et al., 1997; Song et al., 2005). However, studies at the calyx synapse have shown only marginal changes in the presynaptic AP waveform or presynaptic Ca2+ influx during PTP (Habets and Borst, 2006; Korogod et al., 2007), or during phorbol ester mediated potentiation of transmitter release (Lou et al., 2005, 2008). These findings argue against a major role of ion channel phosphorylation during PKC-dependent short-term enhancement of release. Therefore, it is attractive to hypothesize that a protein of the release machinery is a PKC target during short-term enhancement, and Munc18-1 is an interesting candidate for this role.
Here, we wished to study the role of Munc18-1 phosphorylation during PTP. Since PTP has been observed mainly at synapses of acute preparations but not in cultured synapses, we developed an in vivo gene replacement strategy at the calyx of Held synapse, a large CNS model synapse at which PTP measurements are well established (see references above). We used a floxed mouse line in which exon 2 of the Munc18-1 coding gene Stxbp1 is flanked by loxP sites (called Munc18-1lox/lox mice; Heeroma et al., 2004), combined with in vivo virus-mediated protein expression (Wimmer et al., 2004) to recombine the floxed allele, and to re-express mutant or wild-type Munc18-1 protein. Using these approaches, we show that a transient PKC phosphorylation of Munc18-1 causes the increased transmitter release that underlies PTP. These results identify Munc18-1 as a PKC target protein during PTP, and suggest that Munc18-1, besides its essential role in catalyzing membrane fusion, can mediate a second-messenger modulation of the release machinery during presynaptic plasticity.
Results
A phosphatase determines the duration of PTP
Previous studies have found evidence for a role of PKC during PTP, a form of short-term enhancement of release (Alle et al., 2001; Brager et al., 2003; Korogod et al., 2007; Fioravante et al., 2011). However, it remains possible that the requirement for PKC merely represents a background PKC activity permissive for the induction of PTP (see discussion in Korogod et al., 2007). We hypothesized that if PTP is caused by a dynamic phosphorylation/de-phosphorylation cycle of a presynaptic protein, phosphatase blockers should prolong the duration of PTP.
We studied PTP at the calyx of Held synapse in a slice preparation, by first testing baseline synaptic strength with double stimuli (interval, 10 ms) repeated every 10 s. PTP was induced every 5–7 min using 4 s 100 Hz trains of afferent fiber stimuli (Figure 1A, arrowheads). PTP induction trains under control conditions led to ∼twofold PTP which decayed nearly completely over the next 3 min, similarly as shown previously (Korogod et al., 2005). Acute application of calyculin (1 µM), an inhibitor of phosphatases PP1 and PP2A (Ishihara et al., 1989), strongly prolonged the decay of PTP (Figure 1A). We estimated the decay rate of PTP by line fits (Figure 1A, grey and red line), and found that the PTP decay rate was slowed from 16.0 ± 2.6%/min to 4.04 ± 1.7%/min (Figure 1B; n = 7 cells; p<0.01). Calyculin acted without changing the baseline synaptic strength (Figure 1A,C; p=0.96), nor the peak PTP amplitude (219 ± 17% and 227 ± 17%, in control and calyculin respectively; p=0.7). Following removal of calyculin, PTP gradually reversed to its normal decay kinetics (Figure 1A).
Figure 1
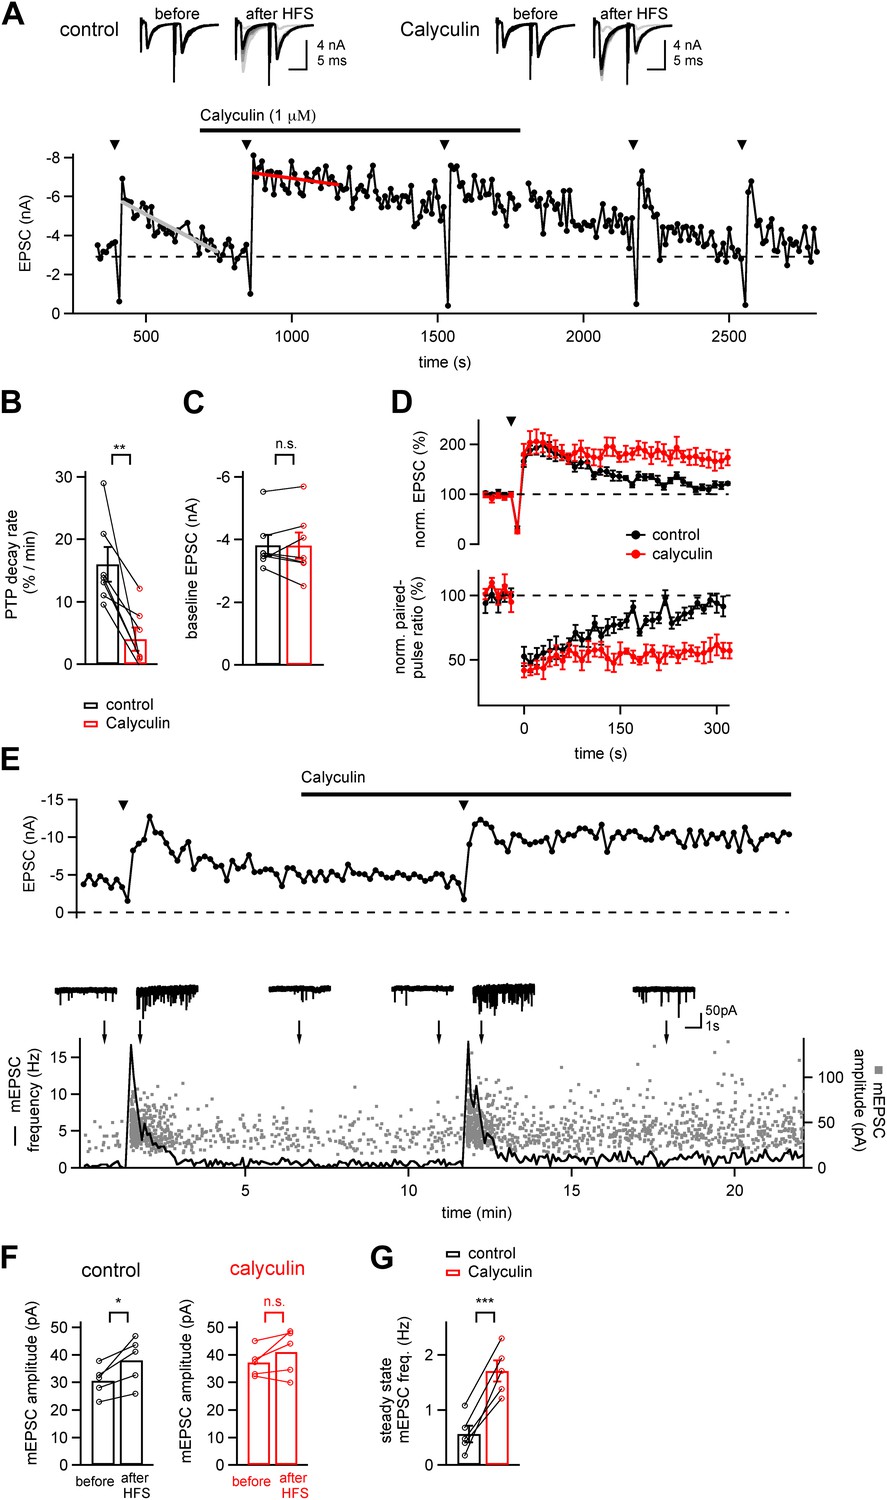
A phosphatase terminates the increased transmitter release which underlies PTP.
(A) Time course of EPSC amplitude during the repetitive inductions of PTP (arrowheads, HFS at 100 Hz for 4 s), demonstrating the slowing of PTP decay upon acute application of phosphatase inhibitor Calyculin A. Line fits (grey and red lines) were used to estimate the decay rates of PTP. Upper inset shows example EPSCs induced by double stimuli (interval, 10 ms) before and after HFS, both for control condition (left) and following calyculin application (right). (B and C) Quantifications of PTP decay rates for control and calyculin (B and Figure 1—source data 1A) and basal EPSC amplitudes for the two conditions (C and Figure 1—source data 1B). (D) Average time courses of normalized EPSC amplitudes (top, PTP) and normalized paired-pulse ratio (EPSC2/EPSC1, bottom) in control conditions (black symbols) and in the presence of Calyculin A (red symbols), obtained in the same recordings (n = 7 cells). (E) Time course of evoked EPSCs (top) and mEPSC frequency (bottom, line trace) and scatter plot of individual mEPSC amplitudes (bottom, gray data points) as a function of experiment time, from a different example recording as the one shown in (A). Example mEPSC traces are shown for the time points indicated by arrows. (F) Quantification of average mEPSC amplitudes before PTP induction stimuli (sampled from at least five 10 s long mEPSC traces, left bars), and during a single 10 s interval immediately following PTP induction (right bars). Data for both control conditions (left) and in the presence of calyculin (right) are shown (see Figure 1—source data 1C). (G) Quantification of the mEPSC frequency late after induction of PTP, both under control conditions, and in the subsequent presence of calyculin (1 µM) in the same cell. Note that in the presence of calyculin, the steady state mEPSC frequency was persistently increased (see Figure1—source data 1D).
-
Figure 1—source data 1
- https://doi.org/10.7554/eLife.01715.004
It is conceivable that pharmacological block of phosphatases interferes with postsynaptic plasticity mechanisms, and thereby causes an apparent prolongation of PTP. To distinguish between pre- and postsynaptic sites of action of calyculin, we first analyzed the paired-pulse ratio (EPSC2/EPSC1). Under control conditions, the paired-pulse ratio was decreased during the peak of PTP, and then recovered when PTP decayed back to baseline (Figure 1D, black data points). The decreased paired-pulse ratio confirms the view that PTP is presynaptic in origin, and mediated by an increased transmitter release (Habets and Borst, 2005; Korogod et al., 2005). In the presence of calyculin both the decay of PTP as well as the recovery of the paired pulse ratio were slowed, revealing a parallel regulation of both the synaptic strength and the paired-pulse ratio by calyculin (Figure 1D; red data points; n = 7 cells). Thus, in the presence of a phosphatase inhibitor, the increased transmitter release during PTP decays more slowly.
We further analyzed the quantal mechanism of PTP in the absence and presence of calyculin by analyzing the spontaneous (miniature) EPSCs (mEPSCs), sampled in 10 s intervals in-between evoked EPSCs. Figure 1E shows plots of the evoked EPSC amplitude (top), and of the individual mEPSC amplitudes and time-averaged mEPSC frequency (bottom), both in control conditions, and following application of calyculin (1 µM). Following the PTP induction trains, we found that the mEPSC frequency was increased and then relaxed back to baseline value over several tens of seconds, as shown before (Korogod et al., 2005). Under control conditions, the mEPSC amplitude was increased during the first 10 s interval following PTP induction (by 23% on average; Figure 1F; p<0.05). However, the increase in mEPSC amplitudes did not reach statistical significance in the other data sets of this study (see below, Figure 2—figure supplement 1, Figure 4—figure supplement 1). These findings are consistent with the view that PTP largely represents an increase in the amount of released quanta (Korogod et al., 2005), and that a significant increase in mEPSC amplitude, maybe caused by compound fusion, is only observed with stronger PTP induction stimuli (He et al., 2009; Xue and Wu, 2010). Interestingly, in the presence of calyculin, the elevated mEPSC frequency following PTP induction trains did not recover completely, but rather, persisted at 2–3-fold elevated levels (Figure 1E, bottom). This effect was observed in all cells in which mEPSC frequency was analyzed (n = 5; p<0.001; Figure 1G). Thus, the persistently enhanced transmitter release following PTP induction trains under phosphatase block is mirrored by an enhanced spontaneous release rate.
Pharmacological evidence for a role of conventional PKCs
Phosphatases reverse the action of many serine–threonine kinases (Hunter, 1995). We therefore wanted to find further evidence that the action of a phosphatase is related to an initial PKC phosphorylation step. Furthermore, we wanted to distinguish pharmacologically whether ‘novel’ or ‘conventional’ PKCs initiate PTP (Newton, 2001). For this purpose, we made use of cell-permeable inhibitory peptides directed either against the conventional PKC isoforms α and βΙ−ΙΙ (called PKCi), or against protein kinase A in a control experiment (called PKAi). We measured PTP in slices pre-incubated either with PKAi or with PKCi at 10 µM each (Figure 2A; see ‘Materials and methods’ for procedures of drug application). PKCi strongly suppressed PTP (Figure 2A,B; p<0.001), whereas PTP was normal in the presence of PKAi (Figure 2A,B). The baseline synaptic strength was similar under both conditions (Figure 2C; p=0.92). Since large EPSCs usually show smaller (relative) PTP at the calyx synapse (Korogod et al., 2005), we plotted the amount of PTP vs EPSC amplitude to control for a possible sampling bias with respect to baseline EPSC amplitudes. This revealed that PKCi also reduced PTP in recordings with small baseline EPSCs (Figure 2D). Therefore, the smaller average PTP in the presence of PKCi was not caused by a sampling bias towards large baseline EPSCs.
Figure 2 with 2 supplements see all

Conventional PKCs but not phospholipase-C initiate PTP.
(A) Average time courses of normalized EPSC amplitude (PTP plots) in the presence of PKC inhibitory peptide (PKCi; red symbols, n = 8 cells) or PKA inhibitory peptide (PKAi; black symbols, n = 9 cells). Note the significant suppression of PTP by PKCi. (B and C) Quantifications of peak PTP (B and Figure 2—source data 1A) and of baseline EPSC amplitude (C and Figure 2—source data 1B) in the presence of PKCi (red symbols) and PKAi (black). (D) Plot of peak PTP amplitudes vs the basal EPSC amplitudes. Note that PTP was strongly reduced also when baseline EPSC amplitude was small. The correlation coefficients (r) are indicated. (E) Average PTP plots in neurons recorded after pre-incubation with the PLC blocker U73122 (red symbols; n = 10 cells), and under control conditions with 0.1% DMSO (black symbols; n = 7 cells). (F and G) Quantification of average peak PTP under control conditions and in the presence of U73122 (F, and Figure 2—source data 1C), and plot of peak PTP amplitude vs baseline EPSC amplitude (G, black and red symbols, respectively). Note the absence of an effect of phospholipase-C inhibition on PTP.
-
Figure 2—source data 1
(A) Data values and statistics underlying Figure 2B. (B) Data values and statistics underlying Figure 2C. (C) Data values and statistics underlying Figure 2F. (D) Data values and statistics underlying Figure 2—figure supplement 1.
- https://doi.org/10.7554/eLife.01715.006
The experiments with the PKCi inhibitory peptide suggest that conventional PKCs (PKCα and -β) are involved in PTP at the calyx synapse, in agreement with recent genetic evidence (Fioravante et al., 2011). An earlier study had shown, however, that the novel PKC isoform PKCε becomes translocated in the calyx of Held nerve terminal upon phorbol ester stimulation (Saitoh et al., 2001). If novel PKCs are involved in PTP, one might expect a contribution of upstream phospholipase C signaling which produces DAG, since novel PKCs are activated by DAG but not by Ca2+ (Newton, 2001). Therefore, we tested the role of the phospholipase C inhibitor U73122 (3 µM), but we could not find significant effects on PTP (Figure 2E–G). Similarly, another PLC inhibitor Neomycin (10 µM) did not suppress PTP (Figure 2—figure supplement 2), despite an immediate effect of Neomycin on transmitter release, which was probably caused by inhibition of presynaptic P/Q-type Ca2+ channels (Pichler et al., 1996).
Taken together, the experiments with the phosphatase inhibitor calyculin and with the PKC inhibitory peptide strongly suggest that a dynamic phosphorylation/de-phosphorylation cycle, initiated by conventional PKC isoforms, determines the time course of PTP at the calyx of Held. PTP was insensitive to PLC blockers, consistent with the view that conventional, but not novel PKCs initiate the phosphorylation of a presynaptic target protein during PTP.
Gene replacement of Munc18-1 at the calyx of Held synapse
We next wished to study the role of Munc18-1 phosphorylation for PTP at the calyx of Held. Munc18-1 is an essential protein for vesicle fusion and membrane trafficking (Südhof and Rothman, 2009), which has two PKC phosphorylation sites (Fujita et al., 1996; de Vries et al., 2000; Wierda et al., 2007). To investigate the role of Munc18-1 in PTP, it was necessary to develop a gene replacement strategy in which endogenous Munc18-1 protein is replaced with a PKC-insensitive mutant. Since constitutive genetic deletion of Munc18-1 in mice is lethal at the late embryo stage (Verhage et al., 2000), we used Munc18-1lox/lox mice (Heeroma et al., 2004) and recombined the loxP sites using virus-mediated Cre expression. In addition, we wished to re-express phosphorylation-deficient Munc18-1, or wild-type Munc18-1 using the same viral construct. This required the simultaneous expression of three proteins: (i) Munc18-1, in the wild-type or mutant form, (ii) Cre-recombinase, and (iii) GFP to label successfully transduced calyces of Held. We used an adenovirus vector which allows the use of two independent expression cassettes (Young and Neher, 2009); one of these carried an internal ribosome entry site (IRES) to allow the expression of a third protein (Figure 3A3). Several additional constructs were prepared for control experiments (Figure 3A1,A2). We injected the adenovirus into the ventral cochlear nucleus (VCN) of Munc18-1lox/lox mice early postnatally, to allow for sufficient time for protein replacement (injection, P1; recordings 8–10 days later; see ‘Materials and methods’, Figure 3—figure supplements 1, 2).
Figure 3 with 2 supplements see all
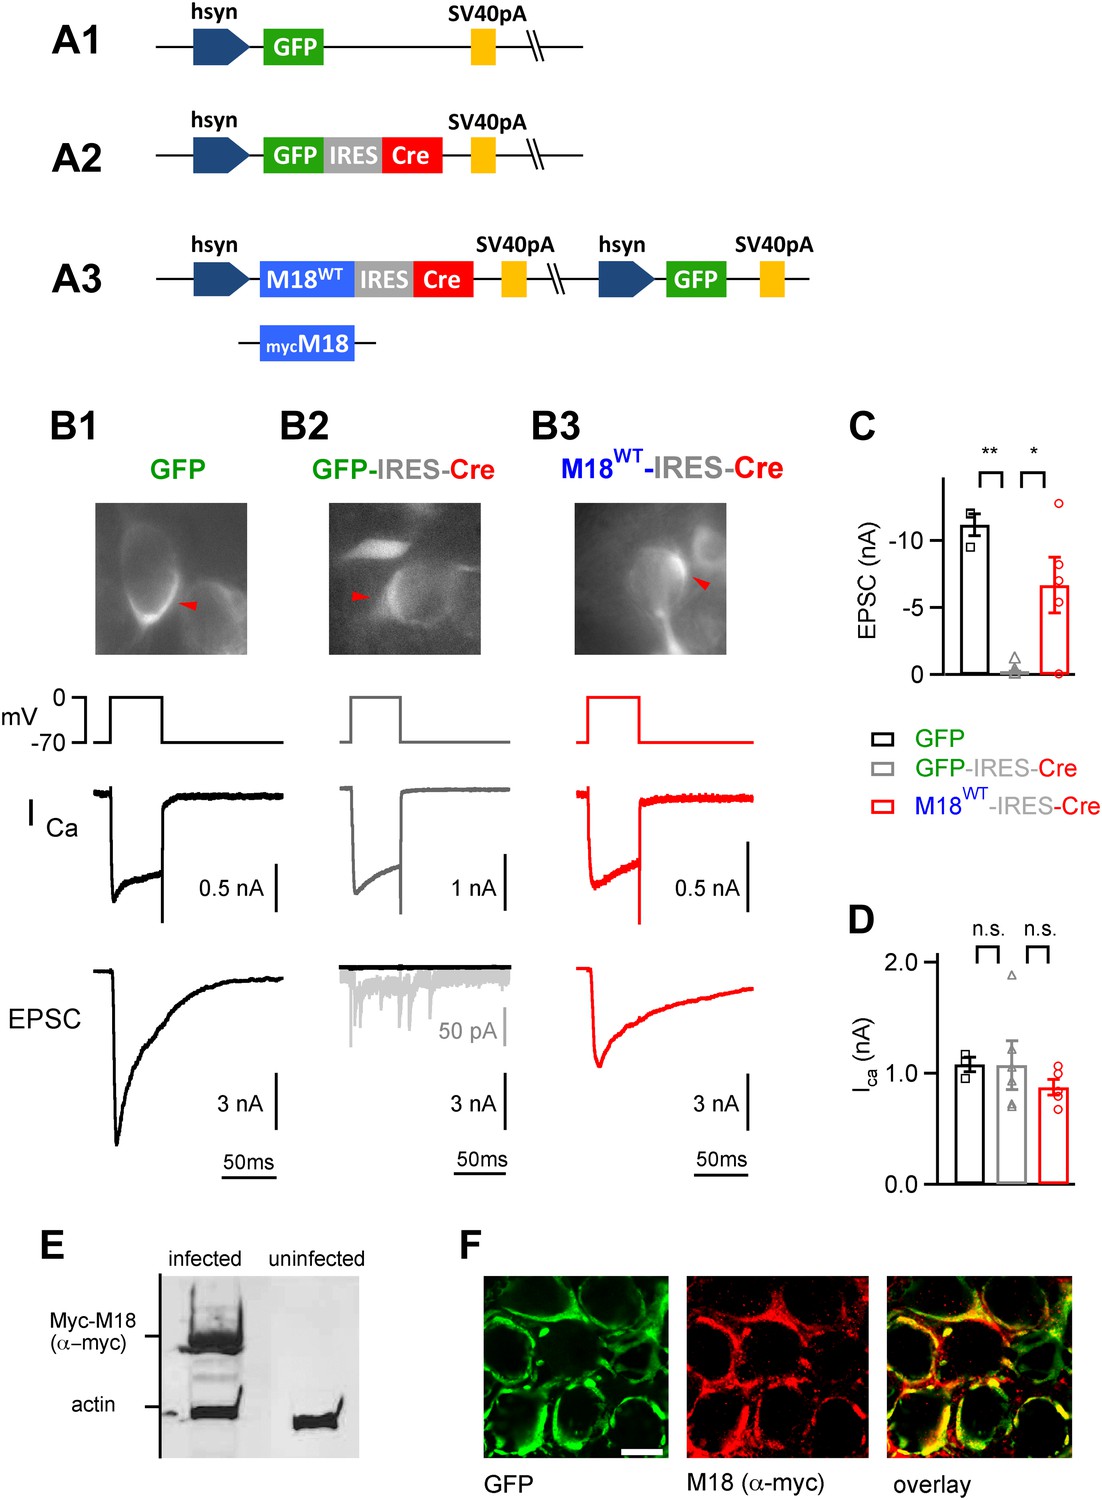
Endogenous floxed Munc18-1 can be removed and replaced by recombinant protein in vivo at the calyx of Held.
(A) Scheme of the adenoviral DNA constructs. A1: control vector driving the expression of GFP alone; A2: control vector driving the expression of GFP-IRES-Cre; A3: three-protein expression vector, which drives the expression of Munc18-1 (either wild-type or myc-tagged), Cre-recombinase, and GFP from an additional cassette in the viral genomic backbone (see ‘Materials and methods’). (B) Results from paired recordings from calyx synapses in Munc18-1lox/lox mice expressing either GFP alone (B1), GFP-IRES-Cre (B2), or M18WT-IRES-Cre and GFP (B3). Shown are the corresponding GFP-positive calyces (top), the presynaptic voltage-clamp protocols and presynaptic Ca2+ currents (middle), and the resulting postsynaptic EPSCs (bottom). Note the abolishment of release when Cre recombinase is expressed alone (B2 – note remaining quantal release in grey trace with enhanced scale), and the rescue of release when Cre-recombinase is expressed together with M18WT protein (B3). These measurements were done following virus injection at P1, which we found necessary for efficient elimination of endogenous Munc18-1 protein in Cre expressing calyces. (C and D) Summary of EPSC amplitudes recorded in response to 50 ms presynaptic depolarization (C; see B), for the following conditions: expression of GFP alone (left bar, black data points), expression of Cre-recombinase (middle; grey data points), and expression of Cre-recombinase together with M18WT (right; red data points and see Figure3—source data 1A). The presynaptic Ca2+ current amplitudes were unaffected by genetic removal of Munc18-1 (D and Figure3—source data 1B). (E) Adenovirus-mediated expression of myc-Munc18-1 in E2T packaging cells analyzed by SDS-PAGE and western blotting shows strong expression of recombinant protein (myc-Munc18-1, 67 kDa, actin, 43 kDa). (F) Immunohistochemistry of calyces of Held expressing the myc-tagged M18 construct in a P11 Munc18lox/lox mouse after injection at P1. Antibodies against GFP (left, green channel) and c-myc (middle, red channel) were used; the overlay image is shown on the right. Scale bar, 10 μm.
-
Figure 3—source data 1
- https://doi.org/10.7554/eLife.01715.010
We first tested the feasibility of the Munc18-1 gene replacement strategy in a series of control experiments. When we expressed Cre recombinase in VCN neurons of Munc18-1lox/lox mice using a GFP-IRES-Cre expression cassette (Figure 3A2), depolarization-evoked release at the calyx of Held synapse was essentially abolished (Figure 3B2). In contrast, control experiments with a GFP expressing virus (Figure 3A1) in Munc18-1lox/lox mice showed normal depolarization-evoked EPSCs (Figure 3B1). On average, EPSCs were 0.251 ± 0.199 nA (n = 6 cells) and 11.2 ± 1.0 nA (n = 3 cells) when presynaptic neurons expressed GFP-IRES-Cre and GFP respectively (Figure 3C; p<0.01). The amplitude of presynaptic Ca2+ currents was unchanged under both conditions (1.07 ± 0.20 and 1.08 ± 0.08 nA for GFP-IRES-Cre and GFP respectively; see also Figure 3D). Thus, Cre recombinase was active, and 8–10 days following virus injection, all functionally relevant copies of Munc18-1 proteins had disappeared from calyx terminals. Additional experiments showed that virus injections early postnatally at P1 were necessary for complete removal of Munc18-1 function (Figure 3—Figure supplements 1, 2).
We next wished to test whether the simultaneous re-expression of Munc18-1 protein, together with the expression of Cre recombinase and GFP in the three-protein expression construct (Figure 3A3), would lead to efficient rescue of the Munc18-1 k.o. release phenotype. Indeed, depolarization-evoked release responses were nearly completely rescued (6.7 ± 2.3 nA, n = 5; Figure 3B3,C). In all cases, presynaptic Ca2+ currents were unchanged (Figure 3B,D; p>0.05), which suggests that Munc18-1 is necessary for vesicle fusion, but not for presynaptic Ca2+ channel function.
In a third line of control experiments, we used a Myc-tag labeled Munc18-1 construct in the three protein expression construct (Figure 3A3, bottom). Western blotting and immunohistochemistry with an anti-Myc antibody showed that recombinant Munc18-1 protein was produced in cell lines (Figure 3E), and transported to the calyx of Held nerve terminals following in vivo expression in the VCN (Figure 3F). Together, these experiments suggest that simultaneous expression of Cre-recombinase, and a rescue Munc18-1 construct in VCN neurons of Munc18-1lox/lox mice leads to the exchange of the endogenous Munc18-1 by the recombinant protein.
PKC phosphorylation sites in Munc18-1 are essential for PTP
Having established an in vivo gene replacement approach for Munc18-1, we next studied the role of PKC phosphorylation of Munc18-1 during presynaptic plasticity, by replacing the endogenous Munc18-1 with a PKC-insensitive mutant. The PKC-insensitive Munc18-1 mutant carried alanine substitutions at the two PKC consensus sites (S306A, S313A) as well as at a third serine residue (S312A; called M18SA mutant here; Wierda et al., 2007). As a control, we used the M18WT construct (Figure 4A). Following injection of either one of the two protein constructs into the VCN of Munc18-1lox/lox mice at P1, EPSCs and presynaptic plasticity were measured in slices made 8–10 days later. The mutant and wild-type forms of Munc18-1 produced baseline EPSCs of similar amplitudes (2.87 ± 0.59 nA and 2.91 ± 0.61 nA respectively; p=0.96; Figure 4B1–D1,E). However, when we applied brief high-frequency trains of afferent fiber stimulation (100 Hz, 4 s), we observed a striking difference in presynaptic plasticity between synapses rescued with M18WT, and with the M18SA mutant. While M18WT-synapses showed normal PTP of 221 ± 15% of baseline EPSC amplitude (n = 12; see Figure 4B1 for an example), synapses rescued with the Munc18SA mutant showed significantly smaller PTP (147 ± 13% of baseline; n = 15; p<0.001; Figure 4B1–D1,F). In some cases, PTP was abolished completely (Figure 4C1), whereas in other cases PTP was smaller and lasted for shorter times (Figure 4D1). To analyze the total amount of potentiation independent of its duration, we calculated the cumulative amount of PTP (Figure 4B1–D1 bottom; Figure 4H). The cumulative PTP attained at 150 s was 5.06 ± 1.17 and 0.83 ± 0.85 (unit, fold change −1) in M18WT and M18SA-rescued synapses, respectively (n = 12 and 13, respectively; p<0.01). A plot of the peak PTP amplitude vs baseline EPSC amplitude showed that PTP was reduced over the entire range of baseline EPSC amplitudes in the sample (Figure 4I).
Figure 4 with 2 supplements see all
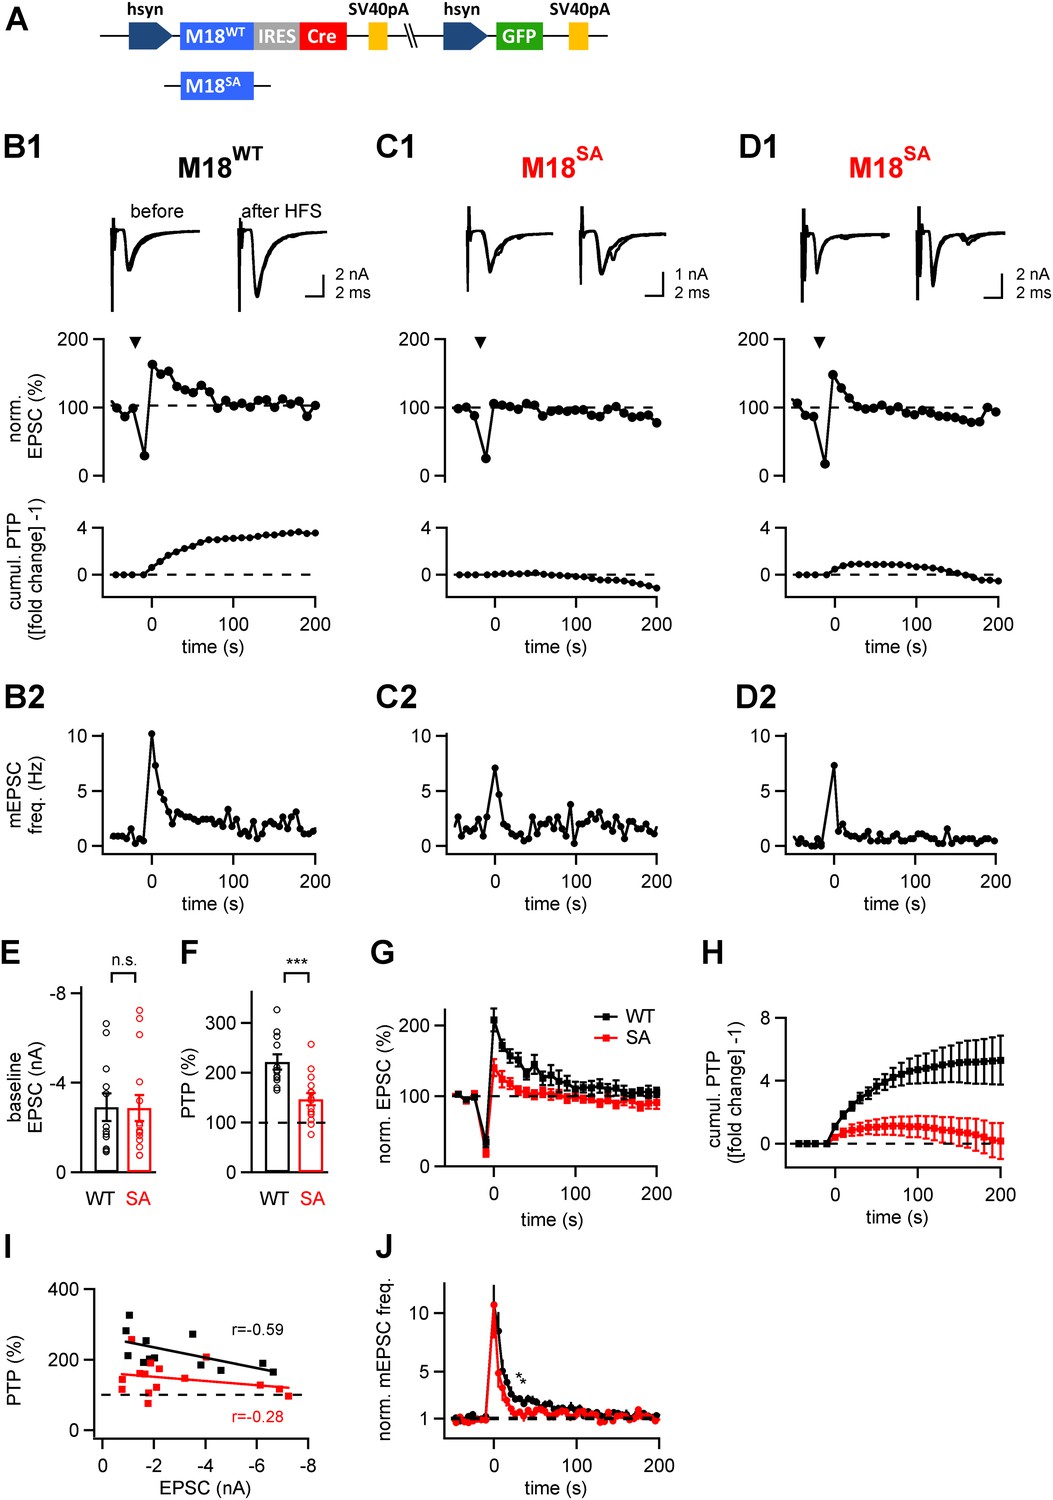
The PKC phosphorylation sites of Munc18-1 are necessary for the expression of post-tetanic potentiation, PTP.
(A) Scheme of the three-protein expression constructs used for the experiments shown in this figure. Either wild-type Munc18-1 (M18WT) or the PKC-phosphorylation site triple mutation (S306A, S312A, S313A; M18SA) were expressed together with Cre-recombinase and GFP. (B-D) PTP from three example cells, one rescued with wild-type Munc18-1 (M18WT, B1, B2), the other two rescued with the PKC-phosphorylation site deficient mutant (M18SA; C1, C2 and D1, D2). From top to bottom, individual EPSC traces before (left) and after (right) PTP; plots of relative EPSC amplitudes vs time (PTP plot), and plots of cumulative PTP vs time. Note that PTP was absent (C1) or smaller in synapses rescued with M18SA; when substantial PTP remained, it decayed more rapidly (D1, middle). The panels in (B2–D2) plot the mEPSC frequency for the corresponding cells on the same time scale. (E and F) Summary plots of baseline EPSC amplitudes (E and Figure 4—source data 1A) and of peak PTP (F and Figure 4—source data 1B) for synapses rescued with wild-type Munc18-1 (M18WT; black symbols) and with the mutant form (M18SA; red symbols). (G) Average PTP plots for synapses rescued with M18WT (black symbols) and M18SA mutant (red; n = 12 and n = 15 cells, respectively). (H) Average cumulative PTP for synapses rescued with M18WT (black symbols) and M18SA mutant (red; n = 12 and n = 13 cells, respectively). (I) Plot of peak PTP amplitudes vs the basal EPSC amplitudes shows that PTP was reduced over the entire range of basal EPSC amplitudes. The correlation coefficients (r) are indicated. (J) Normalized average mEPSC frequency following PTP induction trains, recorded at synapses rescued with M18WT (black) and Munc18SA (red). In the range of 0–60 s, significance was tested by paired t-test. Two data points at around 30–40 s were found to be significantly different between the two conditions (p<0.05; see star symbols). Thus, Munc18-1 phosphorylation was not necessary for late release in the first 10 s interval after PTP induction, but probably supported some late enhanced mEPSC frequency, in agreement with the calyculin data in Figure 1E.
-
Figure 4—source data 1
(A) Data values and statistics underlying Figure 4E. (B) Data values and statistics underlying Figure 4F. (C) Data values and statistics underlying Figure 4—figure supplement 1. (D) Data values and statistics underlying Figure 4—figure supplement 2.
- https://doi.org/10.7554/eLife.01715.014
Previous studies showed that following high-frequency stimulation to induce PTP, the mEPSC frequency is increased and this post-tetanic late release correlated with elevated residual [Ca2+]i in the nerve terminal (Habets and Borst, 2005; Korogod et al., 2005). We analyzed the late post-tetanic release (Figure 4B2–D2) to investigate a possible role of Munc18-1 phosphorylation in this component of release. During the first 10 s interval following PTP induction trains, a strongly increased mEPSC frequency was observed both in synapses rescued with M18WT and M18SA (Figure 4B2–D2). This post-tetanic late release seemed to decay back to baseline faster in M18SA synapses than in M18WT synapses (Figure 4B2–D2). Indeed, we found that for a few sample points at intermediate times (at around 20–30 s following the PTP induction train), asynchronous release was reduced in M18SA synapses as compared to M18WT (Figure 4J, star symbols; p<0.05). In addition, the mEPSC amplitudes did not show a significant increase following PTP induction (Figure 4—figure supplement 1), which shows again that PTP under these stimulation conditions largely represents an increase in the amount of released quanta.
Taken together, replacing endogenous Munc18-1 protein by a PKC-deficient mutant selectively impaired the potentiation of evoked release during PTP, whereas the baseline transmitter release was unaffected, and late asynchronous release depended only marginally on PKC phosphorylation of Munc18-1. These experiments show that Munc18-1 is an important target protein for PKC phosphorylation during PTP.
PKC phosphorylation of Munc18-1 is required for part of the phorbol ester potentiation
We next wished to test whether the PKC phosphorylation sites of Munc18-1 were also important for the phorbol ester-mediated potentiation of evoked and spontaneous release. The phorbol ester PDBu (1 µM) still potentiated EPSCs in calyx synapses rescued with M18SA, but the potentiation was significantly, about twofold smaller than with Munc18WT (157 ± 10% of control and 202 ± 18% of control, respectively; p<0.05; Figure 5A–D). Similarly, the frequency of spontaneous mEPSCs was potentiated by phorbol ester, but the potentiation was again smaller in synapses rescued with M18SA as compared to synapses expressing M18WT (307 ± 41% vs 518 ± 50%, respectively; p<0.05, Figure 5H). At first inspection, the baseline mEPSC frequency seemed to be higher in synapses rescued with M18SA as compared to M18WT synapses (Figure 5G). However, the difference did not reach statistical significance (p=0.50), and was caused by an outlier in the M18SA data set (Figure 5G, pink data point). When removing this data point, the average baseline mEPSC frequency was unchanged between M18WT and M18SA synapses (0.65 ± 0.22 and 0.48 ± 0.19 Hz, respectively; Figure 5G; p=0.54). Therefore, the reduced potentiation of mEPSC frequency by phorbol ester in M18SA synapses was not the result of a higher baseline mEPSC frequency (Figure 5G). We conclude that PKC phosphorylation of Munc18-1 accounts for part of the potentiation of evoked- and spontaneous release by phorbol esters.
Figure 5 with 1 supplement see all
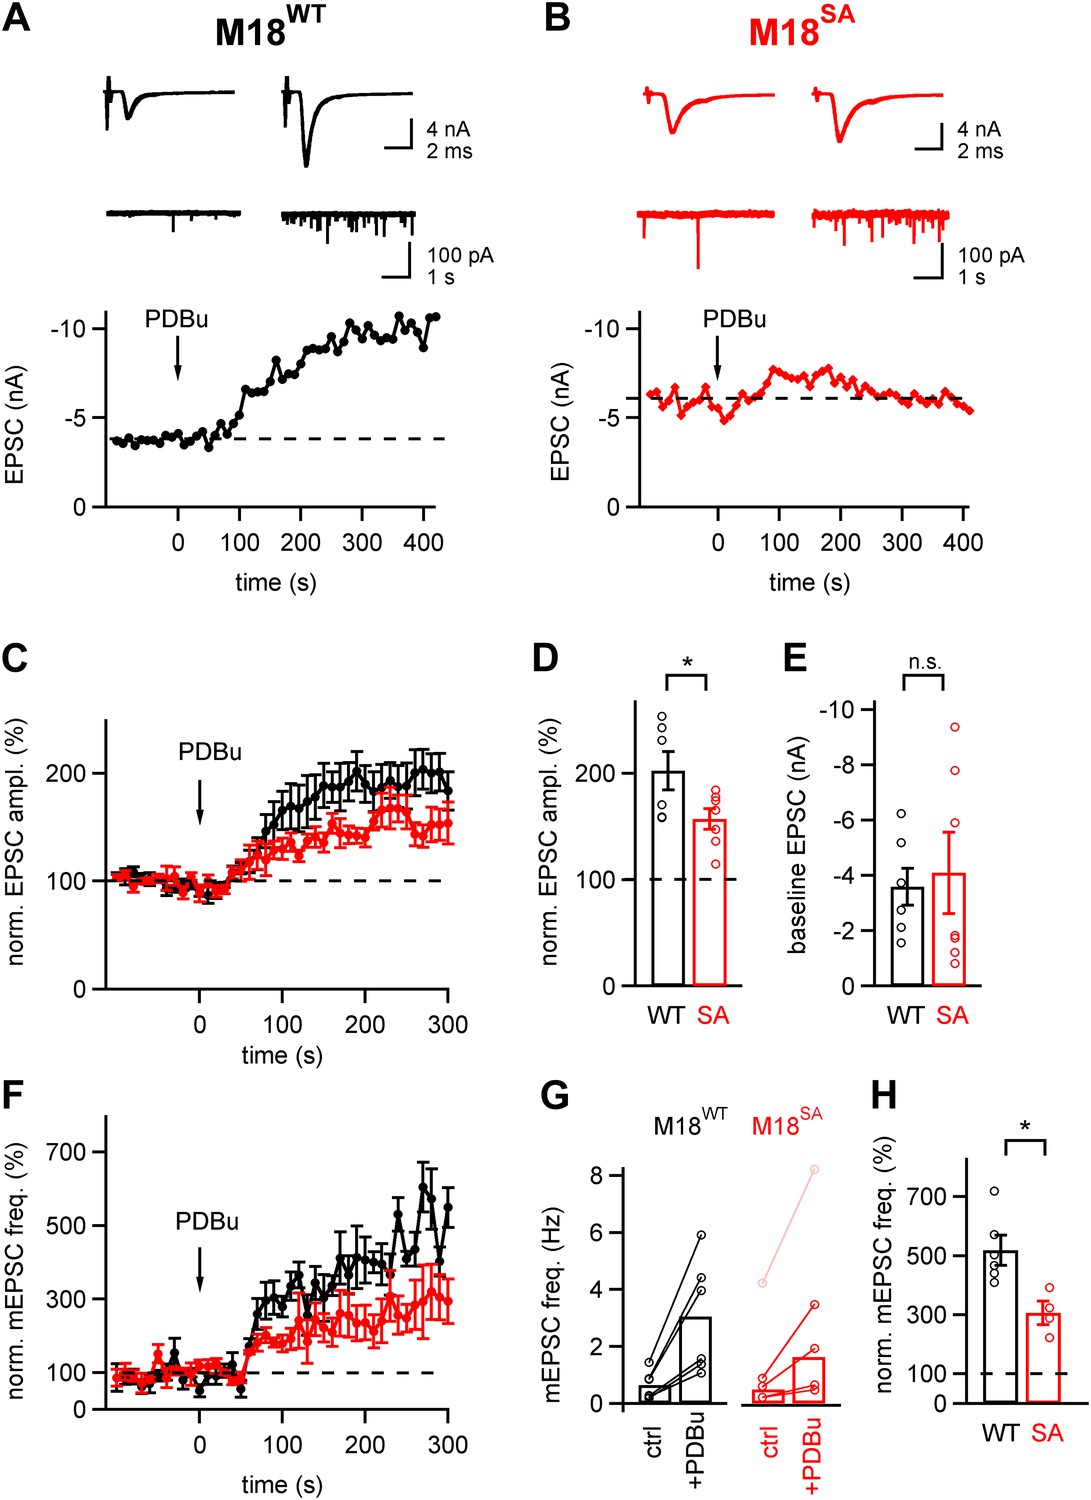
About half of the phorbol ester potentiation of evoked and spontaneous EPSC depends on PKC phosphorylation of Munc18-1.
(A and B) Evoked EPSC traces (top) and spontaneous EPSCs (middle) are shown both before (left) and after (right) application of 1 µM PDBu to the slice. The bottom panels show time plots of evoked EPSC amplitudes and their potentiation by PDBu. Data for a M18WT rescued synapse (A) and for a M18SA rescued synapse (B) are shown. (C) Average time courses of normalized EPSC amplitudes during PDBu potentiation for synapses rescued with M18SA (red symbols) and M18WT (black, n = 7 and n = 6 cells, respectively). (D and E) Quantifications of the average and individual values for EPSC potentiation (D, Figure 5—source data 1A) and for the baseline EPSC amplitudes (E, Figure 5—source data 1B) in synapses rescued with M18SA (red) and with M18WT (black). Note that ∼half of the potentiation of evoked EPSC amplitudes depended on an intact Munc18-1 phosphorylation site. (F) Average time courses of normalized spontaneous EPSC frequency before and after PDBu application, both for synapses rescued with Munc18SA (red symbols) and with M18WT (black; n = 4 and 6, respectively). (G) Quantification of absolute mEPSC frequencies before and after PDBu application, for synapses rescued with M18WT and M18SA. For the M18SA data, an outlier data point with an unusually high baseline frequency (4 Hz; pink symbols) was removed when calculating the average absolute mEPSC frequencies (see Figure5—source data 1C). (H) Average relative potentiation of mEPSC frequency under both conditions. Note that about half of the potentiation of spontaneous release depends on the PKC phosphorylation of Munc18-1 (see Figure5—source data 1D).
-
Figure 5—source data 1
- https://doi.org/10.7554/eLife.01715.018
Discussion
Using a novel in vivo gene replacement strategy at a large CNS synapse, the calyx of Held, we show that PKC phosphorylation of the presynaptic protein Munc18-1 is critically important for PTP, a form of short-term enhancement observed at many CNS synapses. This identifies Munc18-1 as a presynaptic PKC target during PTP. Pharmacological experiments suggested that the PKC action during PTP is dynamic, since blocking phosphatases led to a marked prolongation of PTP (Figure 1). Together, these results show that a dynamic phosphorylation/de-phosphorylation cycle of Munc18-1, initiated by PKC activity, causes PTP.
A membrane-permeable peptide inhibitor of conventional PKC isoforms α and β suppressed PTP, whereas a similar PKA inhibitor had no effect (Figure 2). The peptide inhibitors have a more defined PKC isoform specificity than the synthetic PKC inhibitors used earlier (Brager et al., 2003; Korogod et al., 2007). This, together with recent findings from knock-out mouse lines (Fioravante et al., 2011), allows us to conclude that during PTP induction stimuli, conventional PKC isoforms are activated. A previous study evaluated the effects of BIS-like PKC inhibitors on PTP as non-specific (Lee et al., 2008). However, the genetic evidence for an involvement of conventional PKCs (Fioravante et al., 2011) and for the PKC phosphorylation sites of Munc18-1 in PTP (present study), as well as our pharmacological evidence with specific peptide inhibitors, firmly establishes the role of PKC and Munc18-1 phosphorylation in PTP. An earlier study found that phorbol esters translocates PKCε at the calyx of Held (Saitoh et al., 2001). Although we cannot exclude that PKCε contributes to phorbol ester potentiation of release, it seems unlikely that novel PKCs, including PKCε, play a major role during PTP, a conclusion which agrees with the inefficiency of PLC inhibitors (Figure 2). The inefficiency of PLC blockers in PTP further contrasts this form of short-term enhancement with augmentation, since the latter is sensitive to PLC blockers, but not affected by PKC inhibitors (Rosenmund et al., 2002).
We developed a novel gene replacement approach for the calyx of Held synapse, which makes use of a floxed mouse line, combined with virus-mediated expression of three proteins: (i) Cre-recombinase; (ii) the protein of interest in mutated, or wild-type form, and (iii) the reporter gene GFP. We used adenoviral vectors, which have a high cloning capacity and which allow the use of two expression cassettes (Young and Neher, 2009). The additional use of an IRES site allowed us to drive the expression of a third protein; the Cre-recombinase placed downstream of the IRES site was expressed efficiently as shown in control experiments (Figure 3A2,B2). Using this approach, we showed that replacing the endogenous (floxed) Munc18-1 with a Munc18-1 mutant resistant to PKC phosphorylation strongly suppressed PTP. These genetic experiments at the calyx of Held show that Munc18-1 is a necessary target for PKC during short-term enhancement of release.
Perturbing presynaptic PKC signaling with various methods, including PKC inhibition (Figure 2; see also Korogod et al., 2007), phosphatase block (Figure 1), and introducing a PKC insensitive Munc18-1 mutant (Figure 4), did not lead to changes of the baseline synaptic strength. This indicates that Munc18-1 is not phosphorylated in the nerve terminal under baseline conditions; a conclusion which agrees with previous work using a synaptosome preparation (de Vries et al., 2000). Therefore, it seems likely that during, or shortly after high-frequency activity, Munc18-1 is phosphorylated by a conventional PKC isoform, which induces short-term enhancement of release. About a minute later, a phosphatase de-phosphorylates Munc18-1, which terminates the enhanced evoked release during PTP. Thus, a dynamic regulation of the PKC phosphorylation state of Munc18-1 underlies the rise and decay of PTP.
Using the gene replacement approach, we also studied the potentiation of transmitter release by phorbol esters. We found that the Munc18-1 phosphorylation sites were necessary for ∼half of the phorbol ester-mediated potentiation of evoked and spontaneous release (Figure 5). Phorbol esters, analogues of the membrane lipid product DAG, can activate several proteins including novel and conventional PKCs, Munc13-1, and other C1 domain containing proteins (Newton, 2001; Brose and Rosenmund, 2002; Rhee et al., 2002). Therefore, it is expected that phorbol ester activation extends beyond the conventional, Ca2+-dependent PKCs that are activated during PTP (see Discussion above). Indeed, we have shown previously that ∼half of the phorbol ester potentiation of spontaneous release at the calyx synapse depended on an intact DAG binding site of Munc13-1 (Lou et al., 2008). Thus, phorbol ester activates at least two parallel signaling pathways at the release machinery: on the one hand, Munc13-1 via direct binding to its C1 domain (Betz et al., 1998; Rhee et al., 2002; Lou et al., 2008), and on the other hand PKC which then phosphorylates Munc18-1 (Figure 5; Wierda et al., 2007; see Figure 5—figure supplement 1). The specificity of activation of conventional PKCs and phosphatases during PTP likely indicates the existence of signaling subcompartments in the presynaptic nerve terminal. Indeed, a recent proteomics study showed that various protein phosphatases and conventional PKCs are enriched at short distances to P/Q-type and N-type Ca2+ channels (Müller et al., 2010), indicating a PKC–protein phosphatase signaling complex at the active zone.
How might phosphorylated Munc18-1 increase transmitter release during PTP? Munc18-1 was first described as a protein which tightly binds to Syntaxin (Pevsner et al., 1994; Dulubova et al., 1999). The binding of Munc18-1 to Syntaxin is thought to maintain the latter in a closed state not amenable to SNARE complex formation. An early study showed that the phosphorylated Munc18-1 has a reduced binding affinity for Syntaxin (Fujita et al., 1996); thus, PKC phosphorylation could aid in the transition from a binary Munc18-1/Syntaxin complex to incorporation into SNARE complexes. However, it was shown later that Munc18-1 also binds to the SNARE complex (Dulubova et al., 2007), and stimulates SNARE-mediated vesicle fusion in a reconstituted system, by binding to the partially assembled SNARE complex (Shen et al., 2007). Therefore, Munc18-1 likely remains present at the partially formed SNARE complexes of docked and readily releasable vesicles; interestingly, Munc13-1 is also present in this complex (Ma et al., 2013). In this model, PKC phosphorylation of Munc18-1 would then increase the release probability of readily releasable vesicles, in what appears a ‘post-priming’ regulatory step of vesicle fusion (see schematic in Figure 5—figure supplement 1).
A ‘post-priming’ regulation of the fusion competence of docked vesicles during PTP is consistent with previous Ca2+ uncaging data at the calyx synapse. It was shown that phorbol esters induce a shift and a decreased slope in the dose–response curve between transmitter release rate and presynaptic Ca2+ concentration (Lou et al., 2005); this modulation was reduced by PKC inhibitors (Korogod et al., 2007). We could not apply Ca2+ uncaging to study PTP, since PTP is not observed during presynaptic whole-cell recordings (Korogod et al., 2005; Lee et al., 2010). To gain further insights into the mechanism of release modulation following Munc18-1 phosphorylation, we made use of a phosphomimetic mutation of Munc18-1, in which the S306 and S313 sites were changed to aspartate residues (called M18SD mutant). With this mutation, however, functionally rescued synapses were difficult to obtain, and synapses which were rescued showed significantly smaller EPSCs as compared to synapses rescued with M18WT and M18SA constructs (p<0.05; Figure 4—figure supplement 2). The M18SD mutant led to a block of PTP consistent with the role of PKC phosphorylation in PTP, but the paired-pulse ratio was not changed significantly (Figure 4—figure supplement 2). Thus, while phosphorylation of Munc18-1 is required for PTP, mimicking its phosphorylation is not sufficient to cause a constitutive increase in release probability. We cannot rule out alternative explanations, like homeostatic plasticity (Davis, 2013) which could have reverted the increased release probability, or incorrect folding of the M18SD mutant protein; the latter might also be the reason for the lower rescue efficiency. Taken together, the M18SD mutant data do not allow us to further extend our model of how Munc18-1 phosphorylation by PKC leads to an increased transmitter release.
Munc18-1 is essential for vesicle fusion at synapses (Figure 3; Verhage et al., 2000), and Munc18-1 is expressed widely in the brain (Website, 2012; Lein et al., 2007). However, PTP is probably not observed at all synapses in the brain, and target-cell specific differences in PTP mechanisms have been observed for hippocampal mossy fiber synapses (Lee et al., 2007). A long-lasting residual Ca2+ signal, caused by mitochondrial Ca2+ uptake and release mechanisms, is important for short-term enhancement of release including PTP (Kamiya and Zucker, 1994; Regehr et al., 1994; Tang and Zucker, 1997; Habets and Borst, 2005; Korogod et al., 2005; Lee et al., 2007). It is possible that differences in Ca2+ extrusion mechanisms, as well as differential subcellular localization of members of the signaling complex downstream of Ca2+, like conventional PKCs, determine the expression of PTP at a given synaptic connection.
Together with previous work (Wierda et al., 2007), our study implies that besides having an essential function for vesicle fusion, Munc18-1 can also modulate the release process following PKC phosphorylation. Our study identifies an important physiological context, post-tetanic potentiation, for this presynaptic regulatory pathway. We hypothesize that Munc18-1 is present at the partially formed SNARE complex of readily releasable vesicles, where it would exert a modulatory role on the fusion process, depending on its phosphorylation state. Future studies could investigate the role of Munc18-1 dependent presynaptic plasticity for information processing in neuronal networks, by making use of the PKC-insensitive mutation in transgenic mouse approaches.
Materials and methods
Mouse breeding and stereotactic surgery
Request a detailed protocolProtocols of animal experiments with mice and rats were approved by the Veterinary Office of the Canton of Vaud, Switzerland. For the experiments shown in Figures 3–5, Figure 3—figure supplements 1, 2, Figure 4—figure supplements 1, 2, we used floxed Munc18-1 mice (Heeroma et al., 2004) that were generated by insertion of loxP sites flanking exon 2 of the mouse Stxbp1 gene by homologous recombination in embryonic stem cells (Heeroma et al., 2004). Floxed Stxbp1 mice were bred to homozygosity and referred to as Munc18-1lox/lox mice.
Munc18-1lox/lox mice were injected at postnatal day 1 (P1) with adenovirus unilaterally into the ventral cochlear nucleus (VCN) under isoflurane anesthesia, following a subcutaneous lidocaine injection. In general, mice were used for brainstem slice preparation 8–10 days following virus injection. In some experiments with Cre-recombinase alone, stereotactic injections were performed at different ages (P1–P6) to test the efficiency of Munc18-1 removal depending on postnatal injection time. In these initial experiments, slices were made at 7–8 days following injection (Figure 3—figure supplements 1, 2).
The stereotactic coordinates were adjusted from the previously established VCN injections at P6 mice (Kochubey and Schneggenburger, 2011). Lambda was located through the skin, still transparent at P1, and the mouse head was aligned in a model 900 stereotactic instrument (Kopf Instruments, Tujunga, CA) for the lambda, and the point 3.7 mm anterior from lambda, being in one horizontal plane and lying on the longitudinal axis of the instrument. The skin and the skull were co-punctured at two points which were 0.3 and 0.9 mm posterior, and 1.57 mm lateral from lambda. The virus (0.2 µl per site) was injected with a 35G stainless steel needle (Coopers Needle Works, Birmingham, UK) inserted through the punctures, at three sites vertically spaced at 150 µm from each other (maximal depth, 4.0 mm from surface). The injection rate was 80 nl/min, using a SP120PZ syringe pump (WPI, Berlin, Germany) and a 10 µl syringe (Hamilton, Bonaduz, Switzerland). The mice recovered from anesthesia in 10–20 min and were brought back to the mother.
In vivo gene replacement strategy of Munc18-1
Request a detailed protocolIn order to replace the endogenous Munc18-1 protein of Munc18-1lox/lox mice, we developed adenovirus vectors which, for the final experiments, were capable to drive the expression of three proteins: Munc18-1 (either in wild-type, or mutated form); Cre-recombinase; and GFP to label calyces of successfully transduced presynaptic neurons in the VCN (see Figure 3A1–A3). The constructs were designed as follows. We used an open reading frame of a codon-optimized Cre recombinase (Gradinaru et al., 2010) which was placed downstream of an IRES sequence. The IRES sequence was preceded either by the GFP sequence (see Figure 3A2), or by the Munc18-1 sequence (splice variant b), in wild-type or mutated form (Figure 3A3, Figure 4A). In the phosphorylation deficient mutant (M18SA), three serine residues 306, 312 and 313 were changed to alanine (Wierda et al., 2007). In the phosphomimetic mutant, the serine residues S306 and S313 were changed to aspartate (called M18SD mutant; see Figure 4—figure supplement 2; ‘Discussion’). All expression cassettes were under control of the neuron-specific human synapsin1 promoter (Kügler et al., 2003; Young and Neher, 2009), were preceded by the Kozak sequence GCCACC, and followed by the SV40 polyadenylation signal.
A second-generation serotype 5 adenovirus system was used to deliver and drive the expression of the constructs in vivo. A shuttle vector pDC511 (Microbix Biosystems, Ontario, Canada) encoding eGFP-IRES-CreT cassette was used in combination with a custom-modified pBHGfrtΔ1, 3FLP adenovirus backbone (Microbix Biosystems) in which the gene 2a was also deleted (Zhou and Beaudet, 2000; Young and Neher, 2009). To enable simultaneous eGFP expression in rescue experiments, the shuttle vectors encoding for Munc18WT/SA-IRES-Cre cassettes were combined with a backbone carrying an additional hsyn:eGFP expression cassette (Young and Neher, 2009). Adenovirus was propagated and purified as previously described (Kochubey and Schneggenburger, 2011) using the E2T packaging cell line (Zhou and Beaudet, 2000), including the plaque purification step. Final purification was done from the total lysate of 5 × 15 cm cell culture plates using Adenopack 100 RT kit (Sartorius, Aubagne, France) with the final buffer containing (in mM) 250 sucrose, 10 HEPES, 1 MgCl2, pH 7.4, which typically resulted in ∼750 µl of injection-ready virus stock with 1–2·1012 particles/ml titer (OD260).
Slice electrophysiology
Request a detailed protocolFor the experiments shown in Figures 1 and 2, transverse slices of brainstem (200 µm) containing the medial nucleus of the trapezoid body (MNTB) were prepared from Wistar rats at P8–P10. For the experiments in Figures 3–5, Munc18-1lox/lox mice that had undergone stereotaxic surgery at P1, to express one of the above described expression constructs in the VCN, were used at P9–P12. We used the eGFP-fluorescence of calyces of Held to select for presynaptically transduced neurons using a monochromator (TILL Photonics; Gräfelfing, Germany) at an excitation wavelength of 470 nm, a filter set with a 470/30 bandpass excitation filter, Q495LP dichroic mirror, and dual-band eGFP+IR emission filters (AHF Analysentechnik, Tübingen, Germany). Whole-cell patch-clamp recordings from MNTB neurons, or from pairs of calyces of Held and MNTB neurons were made at room temperature (21–24°C) using an EPC-9/2 double patch-clamp amplifier (HEKA Elektronik, Lambrecht, Germany). The microscope set-up was a BX-51WI upright microscope (Olympus, Tokyo, Japan), equipped with a 60×/0.9 NA water-immersion objective (Olympus), IR-DIC illumination system (Olympus) and an Andor iXon 885 EM-CCD camera (Andor Technology, Belfast, UK). In case of fiber stimulation experiments, afferent axonal fibers were stimulated with a custom-made platinum-iridium bipolar electrode, which was placed close to the midline of the brainstem slice. In these cases, MNTB neurons that were amenable to successful midline stimulation were pre-selected, by measuring the action current generated at the calyx of Held synapse in response to afferent stimulation (Borst et al., 1995). It is possible that by this procedure, we also selected for calyces of Held in which Munc18-1 function was rescued successfully, since calyces with little rescue might not respond to the afferent fiber test. During whole-cell recordings of postsynaptic MNTB neurons, the series resistance (Rs; 3–10 MΩ) was compensated by up to 90%; the remaining Rs error in postsynaptic currents was corrected offline (Meyer et al., 2001). In presynaptic recordings, Rs was 8–20 MΩ and was compensated by ∼ 50%.
Solutions and drug application
Request a detailed protocolThe slice incubation solution contained (in mM): 125 NaCl, 25 NaHCO3, 2.5 KCl, 1.25 NaH2PO4, 1 MgCl2, 2 CaCl2, 25 glucose, 0.4 ascorbic acid, 3 myo-inositol, 2 Na-pyruvate, pH 7.4 when bubbled with 95% O2/5% CO2 at 37°C. The solution for slice patch-clamp recording was similar, but contained in addition 2 µM strychnine and 10 µM bicuculline for the fiber stimulation experiments (Figures 1, 2, 4 and 5; Figure 2—figure supplements 1, 2; Figure 4—figure supplements 1, 2). For the paired pre- and post-synaptic recordings (Figure 3, Figure 3—figure supplements 1, 2), this solution contained, in addition, 10 mM tetraethylammonium chloride (TEA-Cl), 1 μM tetrodotoxin (TTX), 50 μM D-2-Amino-5-phosphonopentanoic acid (D-AP5), 2 mM γ-D-glutamylglycine (γ-DGG), 100 μM cyclothiazide (CTZ). The patch-pipette solutions contained (in mM): 140 Cs-gluconate, 20 TEA-Cl, 10 HEPES, 5 Na2Phosphocreatine, 4 Mg2ATP, 0.3 Na2GTP, pH 7.2. This solution was supplemented with 5 or 0.1 mM Cs-EGTA for post- or presynaptic recordings, respectively. TTX, D-AP5, CTZ and γ-DGG were from BIOTREND (Wangen, Switzerland). All the other chemicals were from Sigma Aldrich/Fluka (Buchs, Switzerland) unless indicated.
N-myristoylated cell-permeable PKC and PKA inhibitor peptides with specific pseudosubstrate sequences (myr-FARKGALRQ-amide, and myr-GRTGRRNAI-amide, respectively) were purchased from Merck (Darmstadt, Germany), reconstituted in H2O at 10 mM, and kept as frozen stocks. For the experiments, one slice at a time was pre-incubated in the recording chamber by circulating 10 ml of extracellular solution containing 10 µM of inhibitor peptide for 30 min at 32–36°C as set by a temperature control unit (Warner Instruments, Hamden, CT). Thereafter, the perfusion solution was allowed to cool to room temperature, and fiber-stimulation experiments were done in the continuous presence of the inhibitor peptide. Calyculin A (Millipore, Zug, Switzerland; 1 µM final concentration), phorbol-12,13-dibutyrate (Merck; 1 µM) and Neomycin (Sigma; 10 µM) were acutely applied via a gravity-driven bath perfusion. U73122 (Merck) was dissolved in DMSO (Sigma), and slices were incubated at the final concentration of 3 µM U73122, or in 0.1% DMSO vehicle for at least 45 min prior to electrophysiology experiments, using a small slice keeping chamber containing ∼20 ml of O2/CO2 equilibrated keeping solution (see above).
Immunohistochemistry and western blot analysis
Request a detailed protocolFor analysis of Munc18-1 expression in calyces of Held, mice were deeply anesthetized 8–10 days after virus injection by pentobarbital (Streuli, Uznach, Switzerland; 100–200 mg/kg peritoneally), and transcardially perfused with 4% paraformaldehyde (PFA) in phosphate buffered saline (PBS). After post-fixation in 4% PFA and dehydration in 30% sucrose in PBS, transverse brainstem sections containing the MNTB were cut frozen at 40 μm on a sliding microtome Hyrax S30 (Carl Zeiss, Oberkochen, Germany). The sections were processed as described (Felmy and Schneggenburger, 2004). We used chicken anti-GFP (1:1000; 13,970; Abcam, Cambridge, UK) and mouse anti-myc antibodies (1:50; 9B11; Cell Signaling Technology, Boston, MA), and secondary Alexa488 goat anti-chicken (A11039) and Alexa647 donkey anti-mouse (A31571) antibodies (from Life Technologies, Carlsbad, CA), which were applied overnight at 4°C, at 1:200 dilutions. The sections were mounted in DAKO fluorescence mounting medium (Dako, Glostrup, Denmark) and imaged on an inverted SP2 confocal microscope (Leica Microsystems) with a 40× oil immersion objective using 488 and 633 nm laser lines.
Data analysis
Request a detailed protocolData were analyzed using custom-written routines in IgorPro 6.2 (Wavemetrics, Lake Oswego, OR). Spontaneous mEPSCs were detected by a semi-automated analysis routine in IgorPro, implementing template-matching detection algorithm (Clements and Bekkers, 1997). Detected mEPSC events were visually inspected before acceptance. The mEPSC frequency time courses were constructed by splitting the 9.7 s long mEPSC traces in two time intervals (Figures 1E, 4B2–D2) or by using the entire interval as one time bin (Figure 5F). Statistical significance was assessed by unpaired two-tailed Student’s t test. When appropriate, a paired Student’s t test was employed (Figure 1B,C,F,G, 5G, Figure 2—figure supplements 1, 2, Figure 4—figure supplement 1). Error bars report the standard error of the mean (SEM), and the statistical significance is indicated as follows: n.s., not significant (p≥0.05); *p<0.05; **p<0.01; ***p<0.001.
References
-
PTP and LTP at a hippocampal mossy fiber-interneuron synapseProceedings of the National Academy of Sciences of the United States of America 98:14708–14713.https://doi.org/10.1073/pnas.251610898
-
Pre- and postsynaptic whole-cell recordings in the medial nucleus of the trapezoid body of the ratThe Journal of Physiology 489:825–840.
-
Move over protein kinase C, you’ve got company: alternative cellular effectors of diacylglycerol and phorbol estersJournal of Cell Science 115:4399–4411.https://doi.org/10.1242/jcs.00122
-
Detection of spontaneous synaptic events with an optimally scaled templateBiophysical Journal 73:220–229.https://doi.org/10.1016/S0006-3495(97)78062-7
-
Dynamics of munc18-1 phosphorylation/dephosphorylation in rat brain nerve terminalsEuropean Journal of Neuroscience 12:385–390.https://doi.org/10.1046/j.1460-9568.2000.00931.x
-
Munc18-1 binds directly to the neuronal SNARE complexProceedings of the National Academy of Sciences of the United States of America 104:2697–2702.https://doi.org/10.1073/pnas.0611318104
-
A conformational switch in syntaxin during exocytosis: role of munc18The EMBO Journal 18:4372–4382.https://doi.org/10.1093/emboj/18.16.4372
-
Developmental expression of the Ca2+-binding proteins calretinin and parvalbumin at the calyx of Held of rats and miceEuropean Journal of Neuroscience 20:1473–1482.https://doi.org/10.1111/j.1460-9568.2004.03604.x
-
Phosphorylation of Munc-18/n-Sec1/rbSec1 by protein kinase C: its implication in regulating the interaction of Munc-18/n-Sec1/rbSec1 with syntaxinThe Journal of Biological Chemistry 271:7265–7268.https://doi.org/10.1074/jbc.271.13.7265
-
Post-tetanic potentiation in the rat calyx of Held synapseThe Journal of Physiology 564:173–187.https://doi.org/10.1113/jphysiol.2004.079160
-
An increase in calcium influx contributes to post-tetanic potentiation at the rat calyx of Held synapseJournal of Neurophysiology 96:2868–2876.https://doi.org/10.1152/jn.00427.2006
-
Trophic support delays but does not prevent cell-intrinsic degeneration of neurons deficient for munc18-1European Journal of Neuroscience 20:623–634.https://doi.org/10.1111/j.1460-9568.2004.03503.x
-
Regulation ofsynaptotagmin I phoshorylation by multiple protein kinasesJournal of Neurochemistry 73:921–932.https://doi.org/10.1046/j.1471-4159.1999.0730921.x
-
Synaptogenesis of the calyx of Held: rapid onset of function and one-to-one morphological innervationThe Journal of Neuroscience 26:5511–5523.https://doi.org/10.1523/JNEUROSCI.5525-05.2006
-
Calyculin A and okadaic acid: inhibitors of protein phosphatase activityBiochemical and Biophysical Research 159:871–877.https://doi.org/10.1016/0006-291X(89)92189-X
-
Presynaptic Ca2+-requirements and developmental regulation of posttetanic potentiation at the calyx of HeldThe Journal of Neuroscience 25:5127–5137.https://doi.org/10.1523/JNEUROSCI.1295-05.2005
-
Posttetanic potentiation critically depends on an enhanced Ca2+ sensitivity of vesicle fusion mediated by presynaptic PKCProceedings of the National Academy of Sciences of the United States of America 104:15923–15928.https://doi.org/10.1073/pnas.0704603104
-
Post-tetanic increase in the fast-releasing synaptic vesicle pool at the expense of the slowly releasing poolThe Journal of General Physiology 136:259–272.https://doi.org/10.1085/jgp.201010437
-
A dual effect of repetitive stimulation on post-tetanic potentiation of transmitter release at the frog neuromuscular junctionThe Journal of Physiology 245:163–182.
-
Long-term synaptic enhancement and short-term potentiation in rat fascia dentata act through different mechanismsThe Journal of Physiology 324:249–262.
-
Estimation of quantal size and number of functional active zones at the calyx of Held synapse by nonstationary EPSC variance analysisThe Journal of Neuroscience 21:7889–7900.
-
Quantitative proteomics of the Cav2 channel nano-environments in the mammalian brainProceedings of the National Academy of Sciences of the United States of America 107:14950–14957.https://doi.org/10.1073/pnas.1005940107
-
n-Sec1: a neural-specific syntaxin-binding proteinProceedings of the National Academy of Sciences of the United States of America 91:1445–1449.https://doi.org/10.1073/pnas.91.4.1445
-
The role of presynaptic calcium in short-term enhancement at the hippocampal mossy fiber synapseJournal of Neuroscience 14:523–537.
-
Activation of the epsilon isoform of protein kinase C in the mammalian nerve terminalProceedings of the National Academy of Sciences of the United States of America 98:14017–14021.https://doi.org/10.1073/pnas.241333598
-
Phosphorylation of 25-kDa synaptosome-associated proteinJournal of Biological Chemistry 271:14548–14553.https://doi.org/10.1074/jbc.271.24.14548
-
The synaptic vesicle cycleAnnual Review of Neuroscience 27:509–547.https://doi.org/10.1146/annurev.neuro.26.041002.131412
-
Allen Institute for brain Science. Allen mouse brain atlas [Internet]Available from: , http://mouse.brain-map.org/.
-
Targeted in vivo expression of proteins in the calyx of HeldPflügers Archiv : European Journal of Physiology 449:319–333.https://doi.org/10.1007/s00424-004-1327-9
-
Post-tetanic potentiation is caused by two signalling mechanisms affecting quantal size and quantal contentThe Journal of Physiology 588:4987–4994.https://doi.org/10.1113/jphysiol.2010.196964
-
Short-term synaptic plasticityAnnual Review of Physiology 64:355–405.https://doi.org/10.1146/annurev.physiol.64.092501.114547
Article and author information
Author details
Funding
Swiss National Science Foundation (31003A_122496)
- Ralf Schneggenburger
Swiss National Science Foundation (31003A_138320/1)
- Ralf Schneggenburger
The funder had no role in study design, data collection and interpretation, or the decision to submit the work for publication.
Acknowledgements
We thank Heather Murray for expert technical assistance and for help with molecular biology.
Ethics
Animal experimentation: Protocols of animal experiments with mice and rats were approved by the Veterinary Office of the Canton of Vaud, Switzerland (authorizations 1880.2 and 1864.3). All surgery on mouse and rat pups was performed under isoflurane anesthesia and using local analgesia, and every effort was made to minimize suffering.
Version history
- Received: October 16, 2013
- Accepted: December 23, 2013
- Version of Record published: February 11, 2014 (version 1)
Copyright
© 2014, Genç et al.
This article is distributed under the terms of the Creative Commons Attribution License, which permits unrestricted use and redistribution provided that the original author and source are credited.
Metrics
-
- 1,679
- Page views
-
- 237
- Downloads
-
- 55
- Citations
Article citation count generated by polling the highest count across the following sources: Crossref, PubMed Central, Scopus.
Download links
A two-part list of links to download the article, or parts of the article, in various formats.
Downloads (link to download the article as PDF)
Open citations (links to open the citations from this article in various online reference manager services)
Cite this article (links to download the citations from this article in formats compatible with various reference manager tools)
Munc18-1 is a dynamically regulated PKC target during short-term enhancement of transmitter release
eLife 3:e01715.
https://doi.org/10.7554/eLife.01715
Further reading
-
- Neuroscience
Gradually reducing a source of fear during extinction treatments may weaken negative memories in the long term.
-
- Cell Biology
- Neuroscience
O-GlcNAcylation is a dynamic post-translational modification that diversifies the proteome. Its dysregulation is associated with neurological disorders that impair cognitive function, and yet identification of phenotype-relevant candidate substrates in a brain-region specific manner remains unfeasible. By combining an O-GlcNAc binding activity derived from Clostridium perfringens OGA (CpOGA) with TurboID proximity labeling in Drosophila, we developed an O-GlcNAcylation profiling tool that translates O-GlcNAc modification into biotin conjugation for tissue-specific candidate substrates enrichment. We mapped the O-GlcNAc interactome in major brain regions of Drosophila and found that components of the translational machinery, particularly ribosomal subunits, were abundantly O-GlcNAcylated in the mushroom body of Drosophila brain. Hypo-O-GlcNAcylation induced by ectopic expression of active CpOGA in the mushroom body decreased local translational activity, leading to olfactory learning deficits that could be rescued by dMyc overexpression-induced increase of protein synthesis. Our study provides a useful tool for future dissection of tissue-specific functions of O-GlcNAcylation in Drosophila, and suggests a possibility that O-GlcNAcylation impacts cognitive function via regulating regional translational activity in the brain.


