


Abstract
Activation of μ-opioid receptors (MORs) transfected into human embryonic kidney 293 cells, caused a multiphasic increase in cytosolic free Ca2+ levels (Ca2+i). The first Ca2+i maximum (peak 1) between 5 and 7 s depended on the presence of extracellular Ca2+ (Ca2+e). The second phase peaking at ∼15 s (peak 2) was independent of Ca2+e and thus represents Ca2+ release from intracellular stores. A decrease in temperature from 37 to 25°C also caused reduction of peak 1 but not peak 2, suggesting that the two responses arise from mechanistically distinct pathways. A delayed Ca2+e-dependent third response phase is thought to represent capacitative Ca2+e influx evoked after release of Ca2+ from internal stores. Agonists and antagonists of two major classes of opioid ligands, oxymorphinans (morphine and naloxone) and oripavines (etorphine and diprenorphine), had differential effects on Ca2+ currents. Although morphine activated both phases with equal potency, etorphine was 20-fold less potent at stimulating peak 1 over peak 2. Similarly, the antagonists, naloxone and diprenorphine, blocked the Ca2+ response to each agonist with greatly varying potencies. Specifically, concomitant injection of diprenorphine failed to affect peak 1 (thought to represent rapid Ca2+e influx) stimulated by morphine while fully blocking peak 2 (intracellular Ca2+ release). However, diprenorphine potently inhibited peak 1 as well when added to the cells before morphine, indicating limited or slow access of diprenorphine to these morphine binding sites. The existence of multiple, functionally distinct binding site conformations could account for these findings. In conclusion, different opioid ligands can differentially affect Ca2+ response patterns resulting from MOR activation.
Activation of G protein-coupled receptors (GPCRs) commonly increases cytosolic free Ca2+ (Ca2+i). Both Gq/11- and Gi/Go-coupled receptors trigger the release of Ca2+ from intracellular stores upon activation of phospholipase C and formation of inositol phosphates. Opening of store-operated channels (SOCs; or capacitative Ca2+ entry), which allows extracellular Ca2+ (Ca2+e) to flow into the cell and replenish the stores (Clapham, 1995), follows this event. Moreover, GPCRs modulate ion channels in the plasma membrane via the release of soluble second messengers (Clapham, 1995). Last, receptors can activate ion channels directly by a membrane-delimited pathway (receptor operated Ca2+ channels) (Schaefer et al., 2000). Genes encoding the transient receptor potential family of cation channels seem to play a role in several of these processes (Schaefer et al., 2000; Zhang and Saffen, 2001). Each GPCR thus activates multiple pathways, both direct membrane delimited and indirect via second messengers.
Recent evidence supports the view that GPCRs exist in multiple conformational states that could trigger distinct signaling pathways. For example, octopamine and tyramine each stimulate a separate signaling pathway at their common receptor in Drosophila(Robb et al., 1994). Moreover, an activating mutation of the α1B-adrenergic receptor selectively stimulates only one of two α1B signaling pathways examined (Perez et al., 1996). Similarly, structurally distinct ligands differentially activate Gi and Go coupling of cannabinoid receptors (Houston and Howlett, 1998). Last, numerous ligand binding studies have revealed the existence of multiple receptor conformations (Wreggett and Wells, 1995; Brys et al., 2000). Because conformational receptor states vary with experimental conditions, it is difficult to link distinct conformational states with specific receptor functions induced by different ligands.
We have developed a rapid approach for measuring distinct Ca2+i pathways in response to GPCR activation, to determine whether different ligands might affect these pathways differentially at the same receptor. Herein, we have investigated the Ca2+i response to stimulation of the Gi/Go-coupled μ-opioid receptor (MOR), transfected into human embryonic kidney (HEK) 293 cells. Opioid receptors couple to PTX-sensitive G proteins, thereby activating inwardly rectifying K+ channels and inhibiting voltage-sensitive Ca2+ channels and adenylyl cyclases (North et al., 1987; Murthy and Makhlouf, 1996; Piros et al., 1996). However, Gi/Go-coupled opioid receptors also activate phospholipase C and phosphatidyl inositol turnover (Murthy and Makhlouf, 1996) and elevate intracellular Ca2+ levels in neuronal and non-neuronal tissues (Connor and Henderson, 1996; Hauser et al., 1996;Tang et al., 1996). This occurs either by stimulating influx of extracellular Ca2+e or release of intracellular Ca2+i stores via soluble second messengers (inositol trisphosphates), or both. Several GPCRs induce rapid Ca2+ influx independent of intracellular Ca2+ release (Felder et al., 1992; Montero et al., 1994). Smart et al. (1995) reported that Ca2+ influx preceded intracellular Ca2+ release upon MOR stimulation in human SH-SY5Y neuroblastoma cells shown to express MOR and δ-opioid receptors (Yu et al., 1986). However, it remains unclear to what extent receptor-operated Ca2+ channels contribute to the Ca2+i response of MOR. Whereas MOR agonists predominantly inhibit neuronal activity by modulating potassium channels and voltage-dependent Ca2+ channels, excitatory opioid effects have also been noted. For example, opioid enhancement of evoked enkephalin release in guinea pig myenteric plexus was found to involve elevation of intracellular Ca2+ levels (Xu and Gintzler, 1992). In the rat locus coeruleus, morphine did not simply decrease firing rates of LC neurons, but it also induced persistent oscillatory discharges (Zhu and Zhou, 2001). Therefore, opioid-dependent Ca2+influx pathways could contribute these effects.
Opioid ligands elicit distinct effects at MOR. Different MOR agonists vary dramatically in their ability to induce receptor internalization (Arden et al., 1995; Keith et al., 1996). DAMGO and etorphine, but not morphine, were shown to cause receptor internalization, even though all three strongly stimulate G protein coupling. This distinguishes receptor forms active in coupling and internalization. Furthermore, various agonists couple the opioid receptor to a different spectrum of G proteins (Chakrabarti et al., 1995; Allouche et al., 1999), but our results failed to show significant differences in the activation of individual Gα proteins (Burford et al., 1998). Last, some opioid agonists, such as etorphine and dihydroetorphine, cause less dependence/withdrawal than morphine (Tokuyama et al., 1994). The molecular mechanism underlying these distinct effects remains unknown.
To examine Ca2+ signaling pathways of GPCRs, whole cell fluorescence measurements were performed by measuring rapid Ca2+i responses using a plate reader format (Lin et al., 1999). HEK293 stably cells transfected with recombinant MOR (HEK-μ) were used as a model for testing possible links between GPCR conformation and signaling pathways. We demonstrate that MOR activation leads to a multiphasic Ca2+ response that is differentially affected by the presence or absence of Ca2+e, by temperature, and by different classes of opioid ligands.
Materials and Methods
Materials.
[35S]Guanosine-5′-O-(3-thio)triphosphate was obtained from PerkinElmer Life Sciences (Boston, MA) and Calcium Green 1-AM from Molecular Probes (Eugene, OR). All other reagents were from Fisher Scientific (Fair Lawn, NJ), unless noted otherwise. Morphine, etorphine, naloxone, diprenorphine, and the opioid peptide DAMGO were obtained from the National Institute on Drug Abuse (Bethesda, MD).
Tissue Culture.
HEK293 cells, untransfected or transfected with cDNA encoding recombinant rat MOR (HEK-μ) (Arden et al., 1995;Lin et al., 1999), expressing approximately 2 pmol of [3H]diprenorphine sites per milligram of protein, were grown in T-175-cm3 tissue culture flasks containing 30 ml of HEK293 medium (a 1:1 mixture of Dulbecco's modified Eagle's medium and Ham's F-12 medium, supplemented with 10% fetal bovine serum and 200 μg/ml G418). To test the requirement for Gi/Go in the Ca2+response, we pretreated the cells with 300 ng of PTX for 3 h at 37°C. This protocol blocks the coupling of MOR to Gi/Go, determined with the [35S]guanosine-5′-O-(3-thio)triphosphate binding assay described below.
Ca2+ Measurements.
Intracellular free Ca2+i levels were measured according to the procedure described by Lin et al. (1999). Briefly, HEK293 or HEK-μ cells were grown to 80% confluence, harvested with trypsin, and pelleted at 300g for 2 min. The pelleted cells were then resuspended in fresh HEK293 medium and allowed to recover for 1 to 2 h in a tissue culture incubator at 37°C under 5% CO2 and humidified atmosphere. Cells were then removed from the incubator and prepared for Ca2+measurements by pelleting and resuspending twice in Krebs-HEPES buffer, pH 7.4, containing 118 mM NaCl, 4.8 mM KCl, 1.2 mM MgSO4, 1.2 mM KH2PO4, 1.3 mM CaCl2, 11.7 mM d-glucose, and 10 mM HEPES-free acid. After incubation in the same buffer with 3 mM Calcium Green 1-AM at room temperature for 30 min, the cells were rinsed three times with the above-mentioned buffer containing 0.5% (w/v) bovine serum albumin (Sigma-Aldrich, St. Louis, MO), diluted to approximately 200,000 cells/ml, and plated (∼30,000 cells/well) into opaque white 96-well plates (Costar, Cambridge, MA). To test for any requirement of Ca2+e, similar sets of experiments were conducted with the same buffer but containing the indicated concentrations of CaCl2 and 10 μM BAPTA. The addition of BAPTA to the Ca2+-free buffer had no effect per se on indicator dye fluorescence.
Calcium measurements were made at 37°C (unless noted otherwise) using a FLUOstar 97 fluorometer (BMG LabTechnologies, Durham NC) equipped with dual injectors. Gain calibration was used to ensure consistency between wells and then set at 80% resting intensity for subsequent measurements. Buffer alone, or buffer containing test compounds, was injected sequentially into single wells, and fluorescence intensity at 538 nM (excitation wavelength 485 nM) was measured at 1-s intervals. For each experimental condition, four samples containing the ligand were injected in consecutive order, followed immediately by four control samples containing buffer alone. Mean fluorescence intensities measured after the buffer injections (n = 4) were subtracted from those of the sample injections (n = 4) at each time point. The resulting net changes in fluorescence intensity were plotted to give an average intensity at various times after injection.
There was some variability in the overall fluorescence response and the relative intensities associated with peak 1 and 2 among HEK-μ cell clones and passage number. Propagation of the cells was done such that the most adherent cells were selected during each passage by gentle shaking and discarding cells that sloughed off easily. This process ensured the presence of a prominent and reproducible peak 1 in repeat experiments.
cAMP Assays.
cAMP accumulation was stimulated with 10 μM forskolin for 5 min (Arden et al., 1995). Assays were performed either in cell suspensions using the same buffer as for the Ca2+ assay, or by using attached monolayers as described previously (Yu et al., 1986). Opioid agonists were added in varying concentrations along with forskolin, to establish dose-response curves for inhibition of cAMP accumulation.
Ligand Binding.
[3H]Naloxone binding to MOR in HEK-μ cells was determined under two experimental conditions, i.e., competition binding by incubation over 30 min, or measuring initial tracer binding rates over 10 s. Equilibrium binding analysis was performed at room temperature either with intact suspended cells (using similar conditions described for the Ca2+ assay) or with cell membranes prepared and incubated in Tris-HCl, pH 7.4, buffer as described previously (Yu et al., 1986; Burford et al., 1998), at 25 or 4°C. The tracer was incubated together with competing ligands for 30 min.
Initial binding rates of [3H]naloxone were measured in intact cells suspended in the same medium as used for the Ca2+ assays, at 25°C. Ten seconds after addition of the tracer, the cell suspension was rapidly filtered and immediately washed twice with ice-cold buffer. Nonspecific binding in the presence of 10 μM naloxone was ∼300 dpm and total binding ∼5000 dpm. Specific binding, determined by subtracting nonspecific from total binding, was plotted against the concentration of competing unlabeled ligands. These were either added together with the tracer for the 10-s incubation or for up to 30 min before the tracer. In the latter case, tracer binding over 10 s measures initial binding rates as a function of the remaining free receptor sites after ligand preincubation.
Data Analysis.
Concentration-response curves and standard errors were analyzed by fitting experimental observations to a logistic equation, defined by DeLean et al. (1978), using SigmaPlot curve-fitting software (SPSS Inc., Chicago, IL).
Results
Ca2+ Response to Morphine in HEK-μ Cells.
Injection of 1 μM morphine into a suspension of HEK-μ cells evoked a fluorescence peak at 5 to 7 s (peak 1) followed by a sustained elevated plateau, indicating an increase in intracellular free cytosolic Ca2+i capable of complexing with Calcium Green 1-AM (Fig. 1A) (Lin et al., 1999). The response to control buffer injections was subtracted as reported previously (Lin et al., 1999). No response to morphine was seen in nontransfected (wild-type) HEK293 cells, or cells transfected with empty plasmid. Pretreatment of the cells with PTX eliminated the response to morphine, indicating that the Ca2+response depended on activation of PTX-sensitive G proteins (Gi and Go) (Fig. 1A).
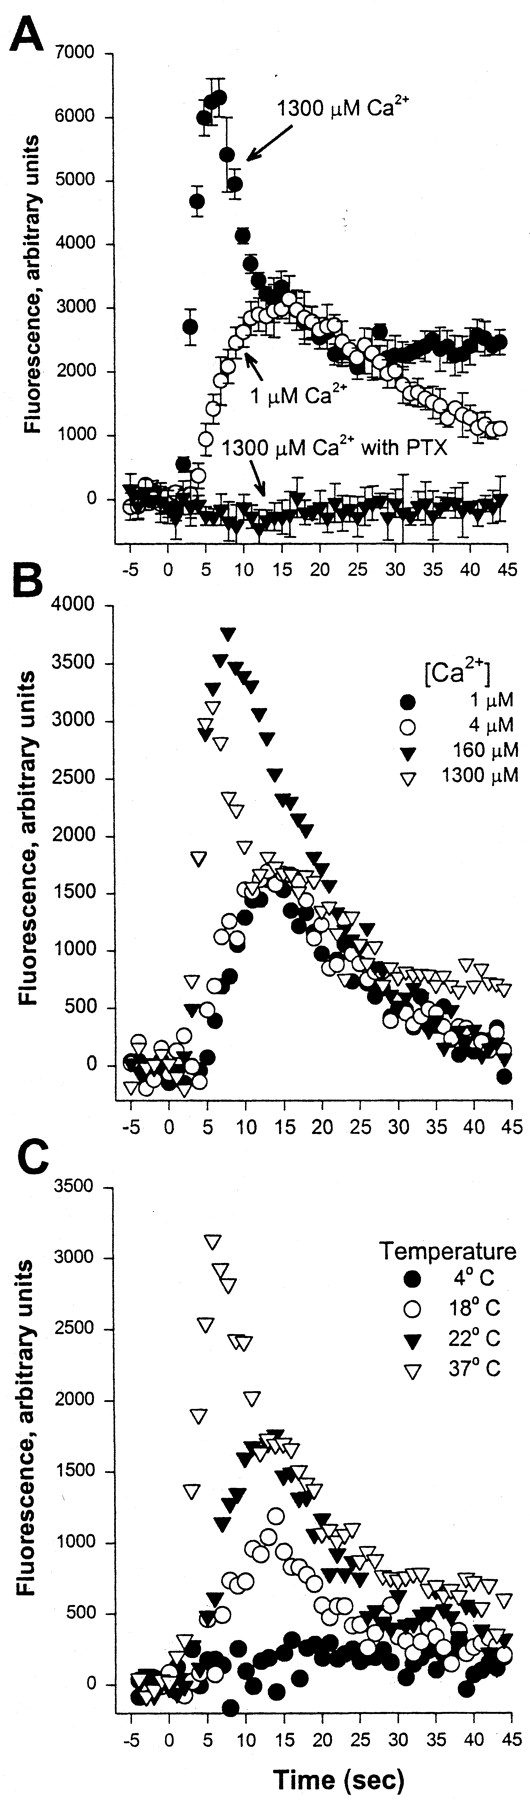
Ca2+ fluorescence response in HEK-μ cells. A, morphine (1 μM) was injected at time 0 into suspensions (with or without 1.3 mM Ca2+) of HEK-μ cells labeled with Calcium Green 1-AM, and fluorescence was read each second. Control readings (no drug) were subtracted from sample readings at each time point. Each point represents the mean ± S.D. of four measurements per experiment. Each experiment was replicated at least twice. Solid circles, medium containing 1.3 mM Ca2+; open circles, Ca2+-free medium; and solid triangles, PTX-pretreated cells in medium with 1.3 mM Ca2+. B, fluorescence response to injections of 1 μM morphine into wells containing HEK-μ cells suspended in varying concentrations of Ca2+. The morphine solution used for injection (8% of total volume) contained 1 μM Ca2+. C, effect of temperature on the Ca2+response to 1 μM morphine injections. All experiments were replicated at least twice, with similar results.
To determine whether the source of free Ca2+i is extra- or intracellular, experiments were performed in Ca2+e-free medium buffered with 10 μM BAPTA (the calculated free Ca2+ concentration in the buffer being 1 μM; Lin et al., 1999). Removal of Ca2+e caused a significant reduction in the response (Fig. 1A); specifically, peak 1 was abolished, an intermediate response peaking at ∼15 s (peak 2) was unaffected, and then the response declined. Because removal of Ca2+ from the medium could have affected intracellular Ca2+stores, these experiments were performed with cells kept in Ca2+-free medium for various time periods (3 min to 2 h). No changes were observed in the response to morphine (1 μM), indicating that exposure of cells to low ambient Ca2+ levels did not alter the results. Therefore, subtracting the Ca2+i response to morphine observed in the presence of Ca2+ in the medium from that in the absence (Fig. 1A), one obtains a sharp peak (peak1) at 5 s, which returns to the baseline after 10 to 15 s. This response therefore seems to be derived from extracellular Ca2+.
Extracellular Ca2+ requirements were also examined by varying the Ca2+e concentrations between 1 and 1300 μM (Fig. 1B). The emergence of peak 1 required >4 μM and was maximal at 160 μM Ca2+e. Raising Ca2+e to 1300 μM also evoked a rapid initial fluorescence increase. However, peak intensity was reduced, possibly because of a negative feedback mechanism triggered by rising levels of intracellular Ca2+. The Ca2+i response between 15 and 30 s (representing peak 2) was largely unaffected by varying the Ca2+e concentrations. These results indicate the presence of multiple phases of the Ca2+ response to morphine: peak 1 depended on the presence of Ca2+e, and peak 2 seemed to derive from Ca2+i stores. After 25 s, Ca2+i levels persisted in the presence of Ca2+ in the medium, presumably as a result of capacitative Ca2+e entry through SOCs secondary to intracellular Ca2+ store depletion. There was some variability in the relative intensities of the three phases of the Ca2+ response among various HEK-μ cell clones tested. Considerable clonal variability in SOCs has been reported to occur in HEK293 cells (Babnigg et al., 2000).
We also tested the effect of varying the temperature on the Ca2+ response to morphine (Fig. 1C). The multiphasic response, and in particular peak 1, was observed only at or above 30°C, with no difference observed between 30 and 37°C. Below 30°C, the response was monophasic and resembled that obtained in Ca2+-free medium (peak 2), whereas at 4°C no Ca2+ response was seen. This further supports the notion that the two phases of the Ca2+ response (peaks 1 and 2) are distinct.
Common inhibitors of Ca2+ channels had little specific effect on Ca2+ signals generated by morphine (data not shown). La3+ (500–1000 μM) produced, at best, only a slight change (<10%) in the early phase of morphine generated Ca2+ responses. Concentrations of La3+ above 2 mM caused inhibition of morphine-generated Ca2+ responses, as well as those evoked with ionomycin or acetylcholine. Thus, block by La3+ did not cause any specific inhibition of the morphine-induced Ca2+ responses. Similarly, L-type Ca2+ channel antagonists verapamil, methoxyverapamil, and nifedipine (10–30 μM) and the N-type inhibitor ω-conotoxin GVIA (500 nM) had little effect on the shape of Ca2+ signals generated by morphine activation of MOR expressed in HEK-μ cells (data not shown). Furthermore, no specific block of morphine-generated Ca2+responses was observed with application of up to 30 μM of the putative inhibitor of receptor-mediated Ca2+influx 1-β-[3-(4-methoxyphenyl)propoxy]-4-methoxyphenylethyl)-1H-imidazole hydrochloride (SKF 96365). Thus, peak 1 is generated by influx of Ca2+ from extracellular sites, and it seems to result from channels that are neither L- nor N-type, nor those typically associated with receptor-mediated influx. For the purpose of distinguishing opioid ligands, we use herein these two clearly distinguishable phases of the Ca2+ response, referring to peak 1 and peak 2.
Opioid Agonist Concentration-Response Curves for Two Distinct Phases of Ca2+ Response in HEK-μ Cells.
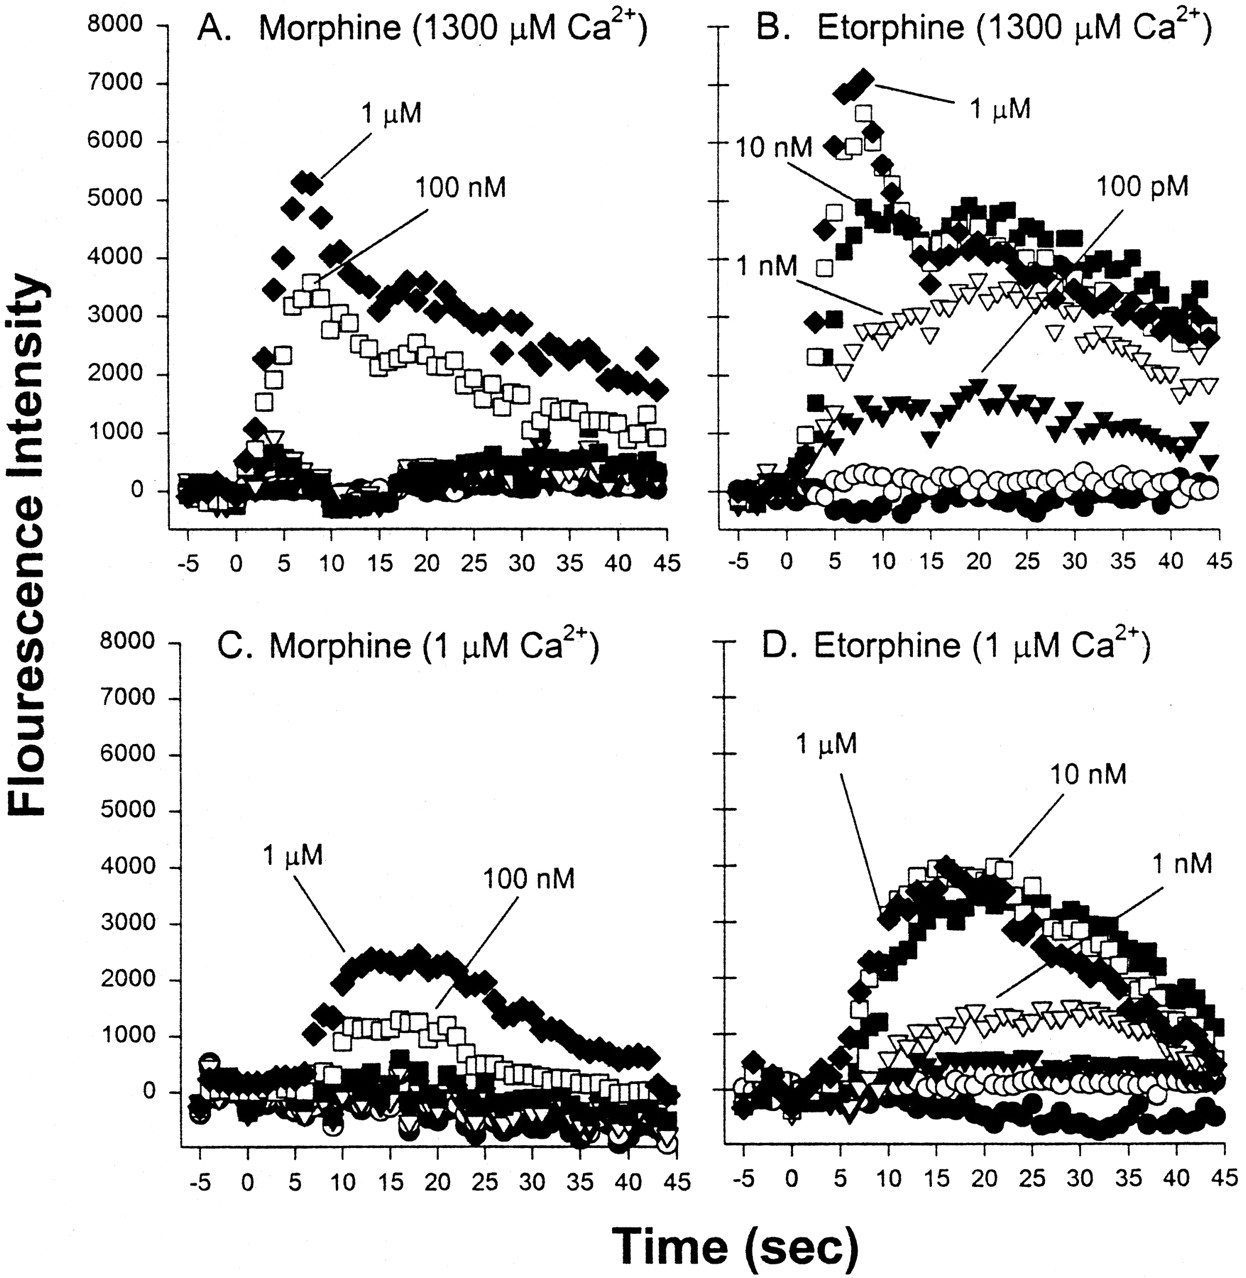
To obtain separate measures of peak 1 and peak 2, relative fluorescence intensities were determined by integration of the signal at 5 to 7 and 20 to 22 s, respectively, after addition of morphine, etorphine (Fig. 2, A–D), and DAMGO to HEK-μ cells, in the presence and absence of Ca2+e. The calculated EC50 values are provided in Table1. In the presence of Ca2+e, morphine had similar potency in eliciting both phases of the Ca2+ response (EC50 of ∼40 nM), whereas etorphine was 20-fold more potent in stimulating peak 2 (EC50 of 0.14 nM; 20–22 s) than peak 1 (EC50 of 2.9 nM; 5–7 s; p < 0.001). DAMGO was 3-fold more potent in stimulating peak 2 than peak 1 (p < 0.001) (Table 1).

Ca2+-fluorescence response to varying doses of morphine (A and C) and etorphine (B and D) in HEK-μ cells, in the presence (A and B) or absence (C and D) of 1.3 mM Ca2+. Each agonist was injected to yield concentrations of 1, 10, and 100 pM, and 1, 10, and 100 nM and 1 μM, as indicated. Arbitrary fluorescence units observed at 5 to 7 s and 20 to 22 s were averaged, and the resultant EC50 values are listed in Table 1.
EC50 values for morphine, etorphine, and DAMGO in intact HEK-μ cells, calculated from dose-response curves (n= 3) using the following measures: stimulation of Ca2+fluorescence (whole cells; 5–7 s and 20–22 s), and inhibition of forskolin-stimulated cAMP accumulation in HEK-μ cell suspension
In the absence of Ca2+e, morphine and etorphine yielded similarly shaped Ca2+ curves, peaking at 1 to 20 s (Ca2+i release), whereas etorphine was consistently more efficacious than morphine (∼4000 versus ∼2500 arbitrary fluorescence units; Fig. 2, C and D). The EC50 value for morphine (37 nM) did not differ significantly from that in the presence of Ca2+e, whereas the EC50 value for etorphine (1.0 ± 0.9 nM) could not be accurately measured at 20 to 22 s, because of a delay in the response to low etorphine concentrations (Fig. 2D).
Differential Effects of Naloxone and Diprenorphine on Opioid Agonist-Mediated Ca2+ Responses.
We next determined the ability of naloxone (an oxymorphinan chemically similar to morphine) and diprenorphine (an oripavine chemically similar to etorphine) to block the agonist response. Both naloxone and diprenorphine (1–10 μM) added alone failed to cause a significant Ca2+ response, as expected for an antagonist (data not shown). Antagonists were either coinjected with the agonist or were preinjected 30 min before the agonist to permit equilibration with the receptor. The selected agonist concentrations corresponded to 2- to 4-fold the respective EC50 values at 5 to 7 s (100 nM morphine, 10 nM etorphine, and 100 nM DAMGO; Table 1). Note, however, that 10 nM etorphine exceed its EC50 at 20 to 22 s substantially. As with the agonist dose-response curves, effects of increasing concentrations of the antagonists were measured at 5 to 7 s and 20 to 22 s (representing peaks 1 and 2) (Fig. 3; Table 2). The resultant IC50 values were compared between peaks 1 and 2 of the same run, and ratios were calculated for IC50 peak 1/peak 2. This also permitted the comparison between the antagonists acting against each of the three agonists tested. Table 2 further contains statistical evaluations of relevant comparisons. The following results were calculated from one series of experiments (n = 4/data point) to permit comparison between different conditions in the same batch of cells. Replicate experiments gave similar results as indicated in the text and legends.

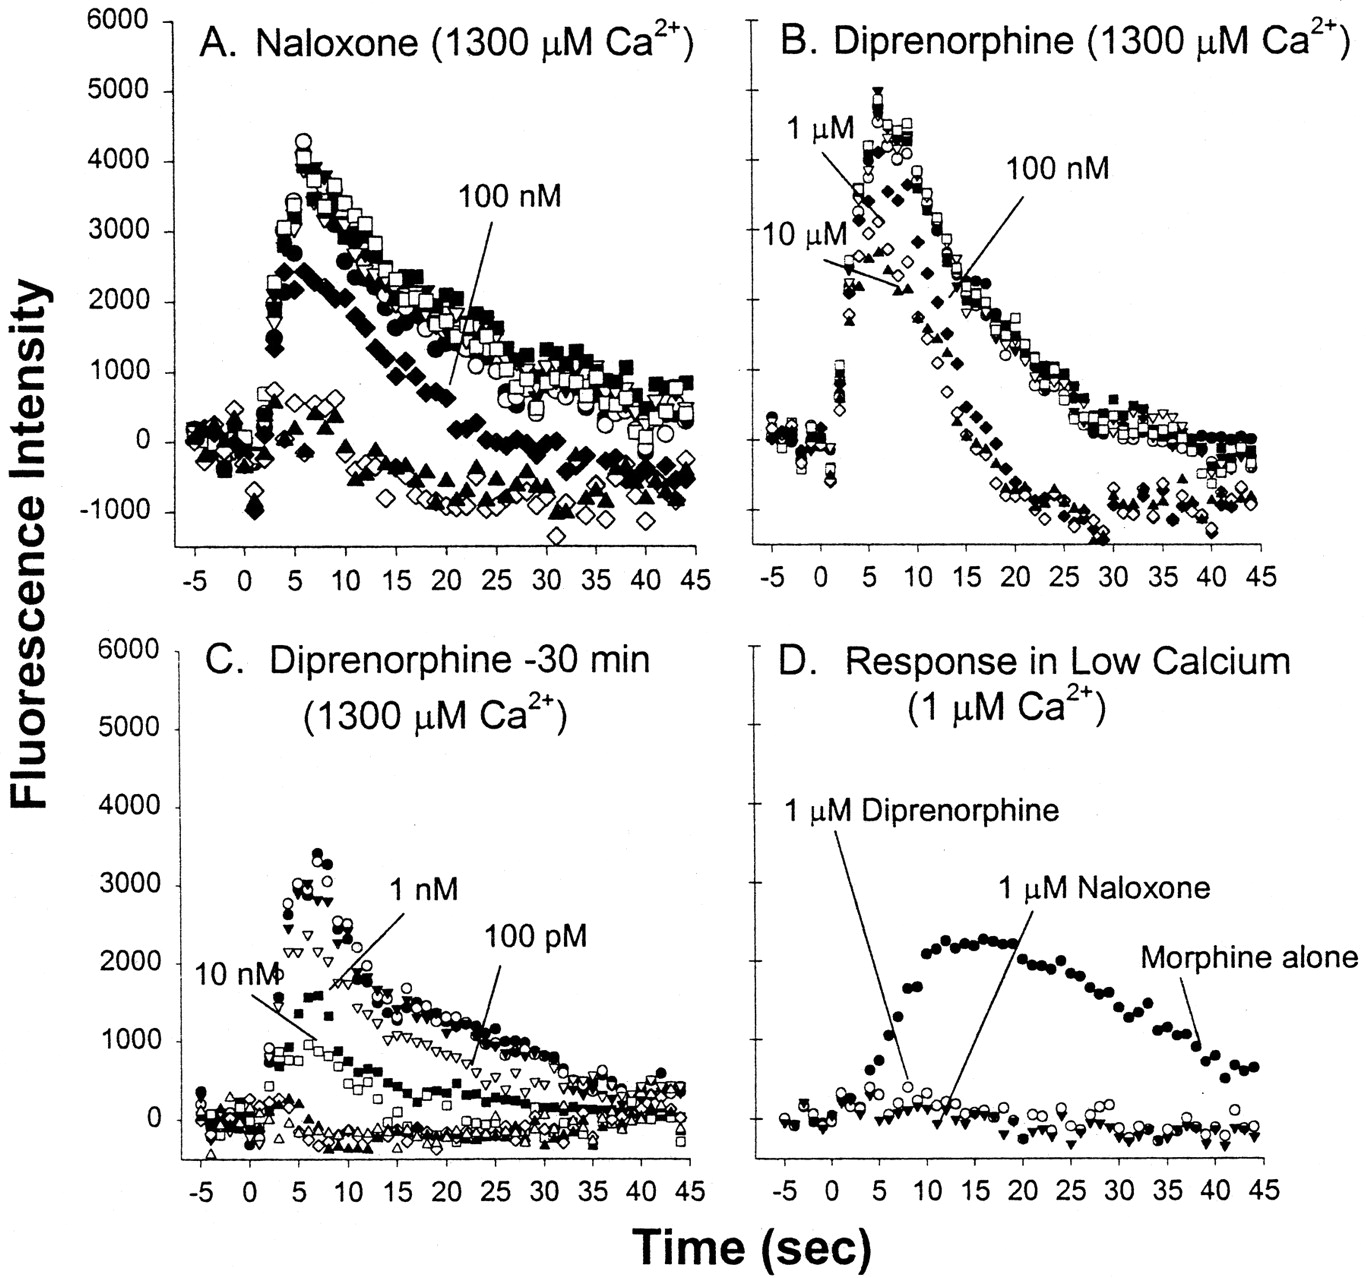
Representative antagonist dose-response curves for inhibiting the Ca2+ response to 100 nM morphine in HEK-μ cells. Antagonists (1 pM to 10 μM, in increments of 10) were either coinjected (A and B) or the antagonist was preincubated for 30 min (C). EC50 values are listed in Table 2. D, morphine was coinjected with 1 μM diprenorphine or naloxone in Ca2+-free medium. These experiments were repeated at least once with similar results.
Antagonist dose-response curves for the inhibition of the Ca2+response to 100 nM morphine, 10 nM etorphine, and 100 nM DAMGO
Coinjection of Antagonist with Agonist.
Shown in Fig. 3A, naloxone given together with morphine (100 nM) suppressed the Ca2+ response with IC50 of 86 nM (5–7 s) and 32 nM (20–22 s) (Table 2). Naloxone displayed different potencies at peaks 1 and 2, against each agonists, with decreasing antagonist potency in the rank order DAMGO > morphine > etorphine (Table 2). In all repeat experiments, naloxone (1 μM or above) fully eliminated the Ca2+ response of the three agonists (100 nM morphine, 10 nM etorphine, and 100 nM DAMGO).
Coinjection of diprenorphine with agonists affected the Ca2+ response quite differently, depending upon the agonist and the time point of analysis (5–7 or 20–22 s). Diprenorphine, even though it has high affinity to MOR (Kd of 0.2 nM; Yu et al., 1986), failed to fully suppress the morphine (100 nM) response (Fig. 3B and multiple repeat experiments). Specifically, 1 μM diprenorphine failed to block the rapid Ca2+ response (peak 1) but abolished the Ca2+ response at 20 to 22 s (peak 2; IC50 of 15 nM). Increasing the diprenorphine concentration even further to 10 μM had only a marginal additional effect on peak 1. This result indicates that diprenorphine had no immediate access to MOR sites mediating peak 1 of the morphine response. Similarly, diprenorphine had rather low potency in blocking the peak 1 Ca2+ response to DAMGO (IC50 of 0.9 μM) but was quite potent at 20 to 22 s (p < 0.001) (ratio IC50 peak 1/peak 2 = 107). In contrast, diprenorphine had equal potency in blocking the etorphine response at 5 to 7 s and 20 to 22 s (Table 2). Hence, the potency ratios of diprenorphine (peak 1/peak 2) differed dramatically from those observed for naloxone.
Varying receptor on-rates can account for part of these observations, with the oxymorphinans displaying more rapid receptor binding than the oripavines. However, comparing naloxone and diprenorphine inhibition of the Ca2+ response to etorphine revealed further unexpected differences. Upon coinjection, naloxone was nearly 4-fold less potent than diprenorphine in suppressing peak 1, even though it seemed to have more rapid on-rates resulting in immediate suppression of morphine's response, whereas it was equally potent at peak 2 (20–22 s) (Table 2). These combined results demonstrate differential effects of the various MOR agonists and antagonists on the two main phases of the Ca2+ response.
Preincubation of Antagonists.
In a second series of experiments, we allowed the antagonists to equilibrate with the receptor before injecting the agonist 30 min later. This resulted in dramatically reduced IC50 values calculated from concentration-response curves with naloxone and diprenorphine against morphine (100 nM) and etorphine (10 nM) (Table 2). In contrast to coinjection (Fig. 3B), diprenorphine was quite potent against morphine upon preincubation even at 5 to 7 s (0.48 nM; Fig. 3C; Table 2). However, unexpected differences persisted in relative potencies between naloxone and diprenorphine. Under the preincubation conditions, naloxone was paradoxically twice as potent as diprenorphine in blocking rapid Ca2+e influx stimulated by etorphine (peak 1; IC50 of 0.16 nM versus 0.30 nM; Table 2) even though it has ∼5-fold lower binding affinity for MOR than diprenorphine (Sadée et al., 1982). Moreover, both antagonists were significantly more potent inhibitors against etorphine at 5 to 7 s than at 20 to 22 s (P < 0.05,P < 0.01). In contrast, naloxone showed no preference for peaks 1 and 2 against morphine, whereas diprenorphine is less potent at peak 1 (opposite to what is observed against etorphine). These differences are statistically significant as indicated in Table2.
Coinjection of Antagonists in Absence of Ca2+e.
Because coinjection of diprenorphine failed to block peak 1 of the Ca2+ response to morphine (Fig. 3B), we tested whether the residual peak 1 seen with morphine + diprenorphine consists of Ca2+ influx or intracellular Ca2+ release, or both. In nominally Ca2+-free medium (Ca2+concentration contributed as trace from all other reagents estimated at 1 μM), coinjection of diprenorphine (1 μM) fully blocked the Ca2+ response to morphine (100 nM) (Fig. 3D), in contrast to the results obtained in the presence of Ca2+e (Fig. 3B). As expected, naloxone fully blocked the morphine response regardless of Ca2+levels in the medium (Fig. 3, A and D). These results indicate that the Ca2+ response to morphine + diprenorphine (Fig.3B) entirely depends upon the presence of Ca2+e (peak 1), and therefore, seems to represent Ca2+e influx.
Agonist-Induced Inhibition of cAMP Accumulation.
For comparison to the Ca2+ response, we also measured the potency of morphine and etorphine to inhibit forskolin-stimulated cAMP production under identical conditions in cell suspension (Table1B). Morphine's EC50 value (24 nM) did not differ significantly from that observed in the Ca2+ assay. Etorphine had similar potency in the cAMP assay (EC50 of 1.6 nM) and in stimulating peak 1 Ca2+ response (2.9 nM) but was more potent in stimulating Ca2+i release (peak 2; EC50 of 0.14 nM). We also measured the cAMP response in attached HEK-μ monolayers to determine whether cell suspension as used for the Ca2+ assay affected the results. EC50 values were similar, indicating that cell suspension had marginal effects on the cAMP response (data not shown).
Ligand Binding Studies.
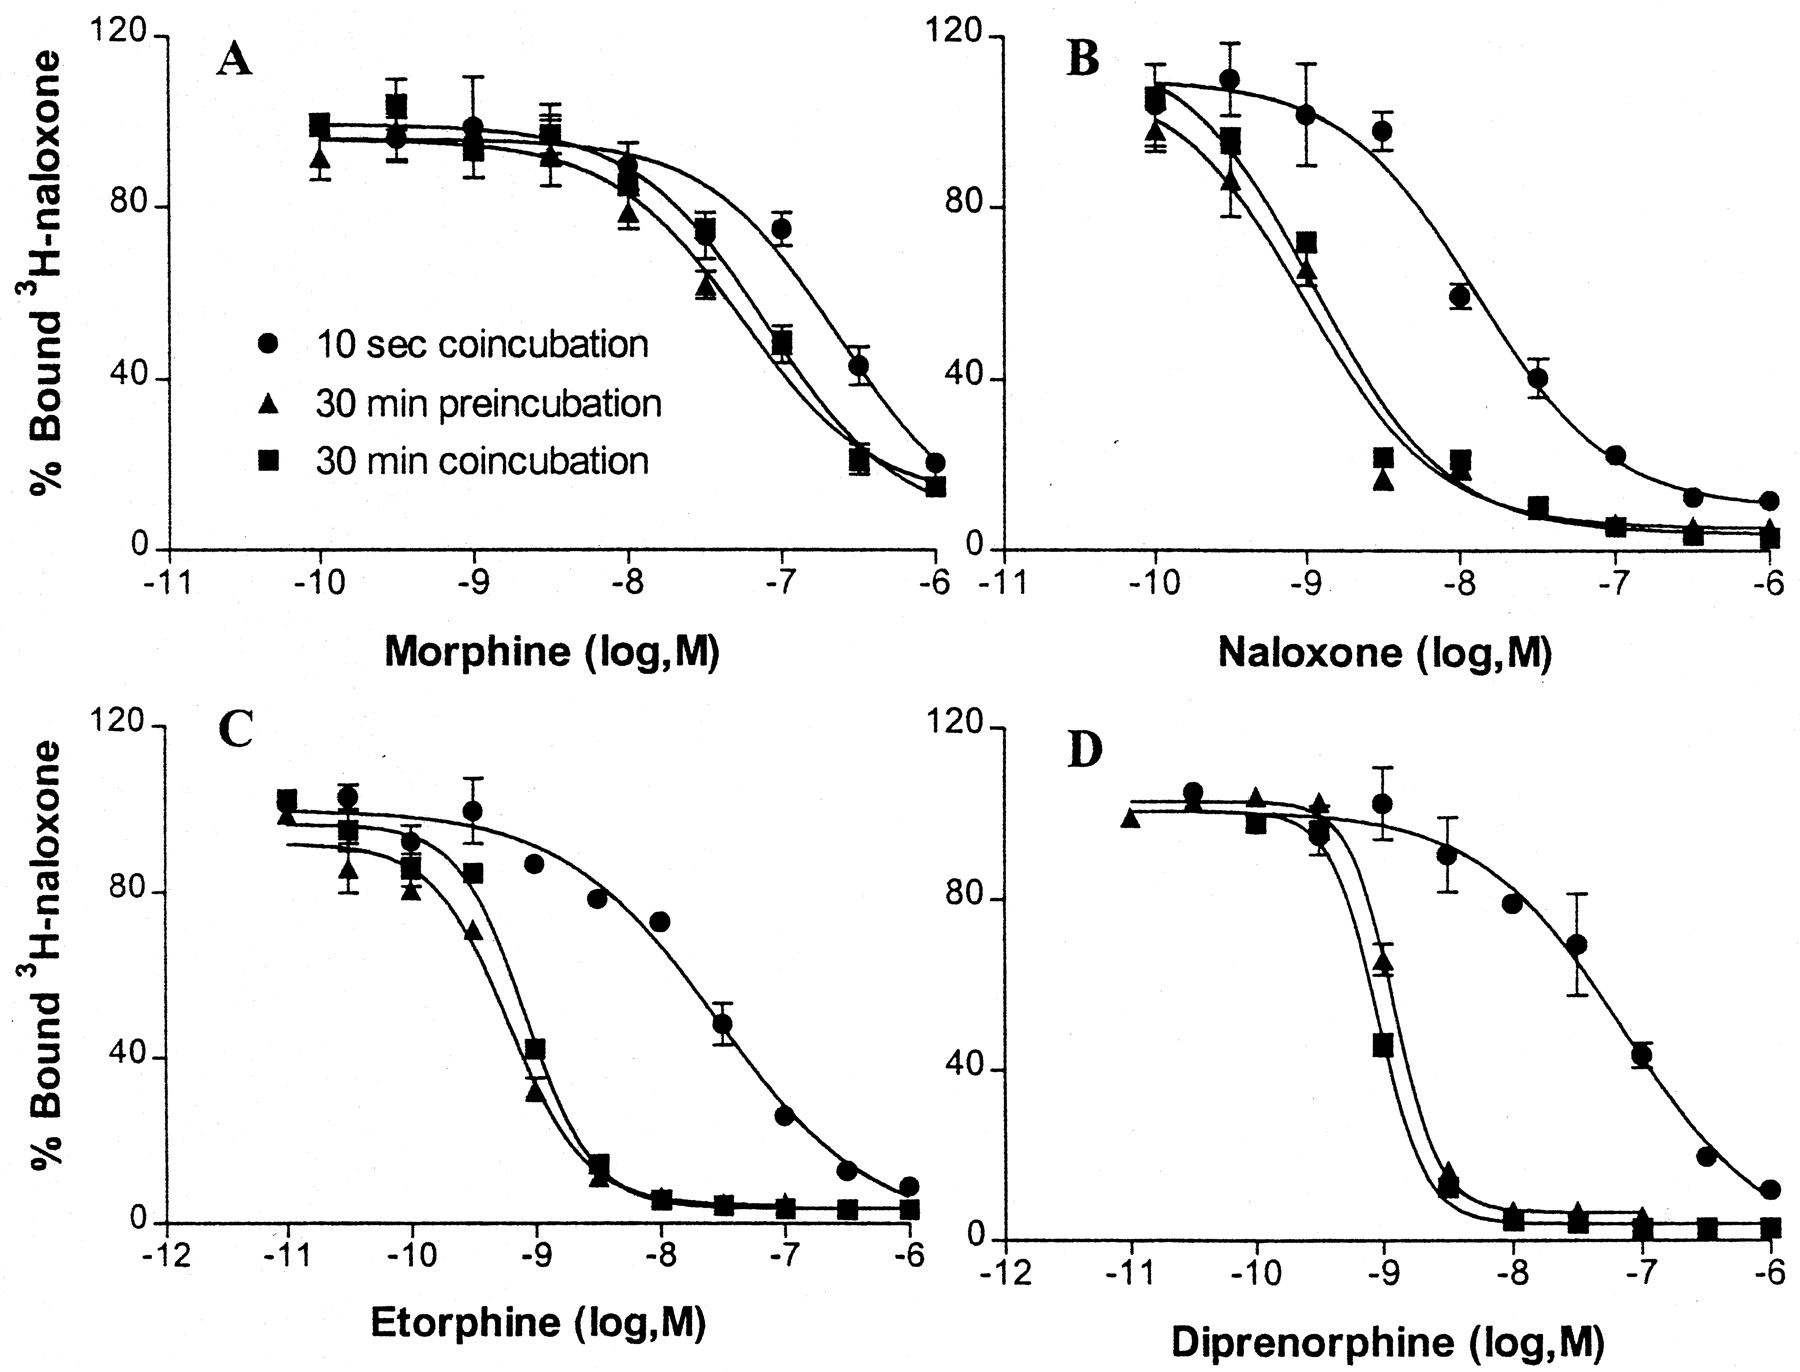
For comparison to functional responses, we first used intact suspended cells incubated under similar conditions as for the Ca2+ assays. In three sets of experiments, the tracer [3H]naloxone and competing unlabeled ligands were incubated with the cells either for 10 s or for 30 min. Over 10 s, the tracer occupied approximately 15% of the MOR binding sites. When the competing ligand was added for 30 min, the shape of tracer displacement curves was identical regardless of whether the tracer was added also for 30 min or only for 10 s at the end of the incubation (Fig.4). This result indicates that the short tracer incubation, designed to measure initial binding rates over 10 s, correctly assessed the receptor population remaining unoccupied after 30-min equilibration with unlabeled ligand. The IC50 values for the unlabeled ligands added 30 min before the tracer (10 s) are provided in Table3A.

[3H]Naloxone binding curves in the presence of unlabeled ligands in intact HEK-μ cell suspensions. The tracer was either incubated for 10 s together with the unlabeled ligand (10-s coincubation) or the unlabeled ligand was added 30 min before the 10-s tracer incubation (30-min preincubation). In a third experiment, both tracer and unlabeled ligand were incubated together for 30 min (30-min coincubation). All experiments were performed at room temperature and repeated twice. The calculated IC50values and slope factors are given in Table 3A.
[3H]Naloxone (0.5 nM) binding to HEK-μ intact cells (A) and cell membranes (B)
When the unlabeled ligand was added together with the tracer for only 10 s, dramatic differences were observed between the ligands studied, in comparison to the 30-min incubation (Fig. 4; Table 3A). Whereas morphine's IC50 value was only slightly affected, suggesting rapid equilibration of ligand binding, naloxone was 7-fold less potent in the 10-s incubation versus the 30-min incubation. Such a shift is expected if binding equilibrium is not established within 10 s. However, IC50values for etorphine and diprenorphine decreased dramatically (Fig. 4; Table 3A), suggesting that either initial binding rates are slow or several binding site populations exist, or both.
The slope factors of the displacement curves were close to unity or lower with 10-s coincubations for both ligand and tracer (n < 1) (Table 3A). In contrast, for the 30-min incubation (ligand 30 min, tracer 10 s), slope factors exceededn = 1 in each case, with the oripavines showing highern values than the oxymorphinans (n = 1.8–2.2 versus 1.1–1.6; Table 3A). Similarly high slope factors were observed when tracer and displacer were incubated together for 30 min (Fig. 4), showing that the slope factor values were not an artifact of the short tracer incubation period.
To investigate the time course of ligand binding, we added unlabeled ligand either together with the tracer or at varying times before the 10-s [3H]naloxone incubation with suspended HEK-μ cells. Ligand concentrations were selected that displace 80 to 90% of the tracer during a 30-min incubation. Shown in Fig.5A, addition of 30 nM morphine immediately reduced tracer binding (occurring over 10 s), whereas preincubation with morphine had little further effect. Thus, morphine equilibrated rapidly with MOR. Similarly, 5 nM naloxone reduced tracer binding by 60% when added together (10-s incubation), and 1-min preincubation was sufficient to reach binding equilibrium (Fig. 5B). In contrast, 3 nM diprenorphine required more than 5 min to approach binding equilibrium. The curve produced by etorphine (data not shown) was similar to that obtained with diprenorphine. These results demonstrate a significant delay in the association of oripavines with MOR sites labeled by [3H]naloxone, even though each agent was added at concentrations considerably above its apparent equilibrium Kd value. Remarkably, diprenorphine and etorphine failed to have any effect on [3H]naloxone binding when coincubated for only 10 s with the tracer (Fig. 5C), indicating that access to the binding sites labeled by naloxone is surprisingly slow.
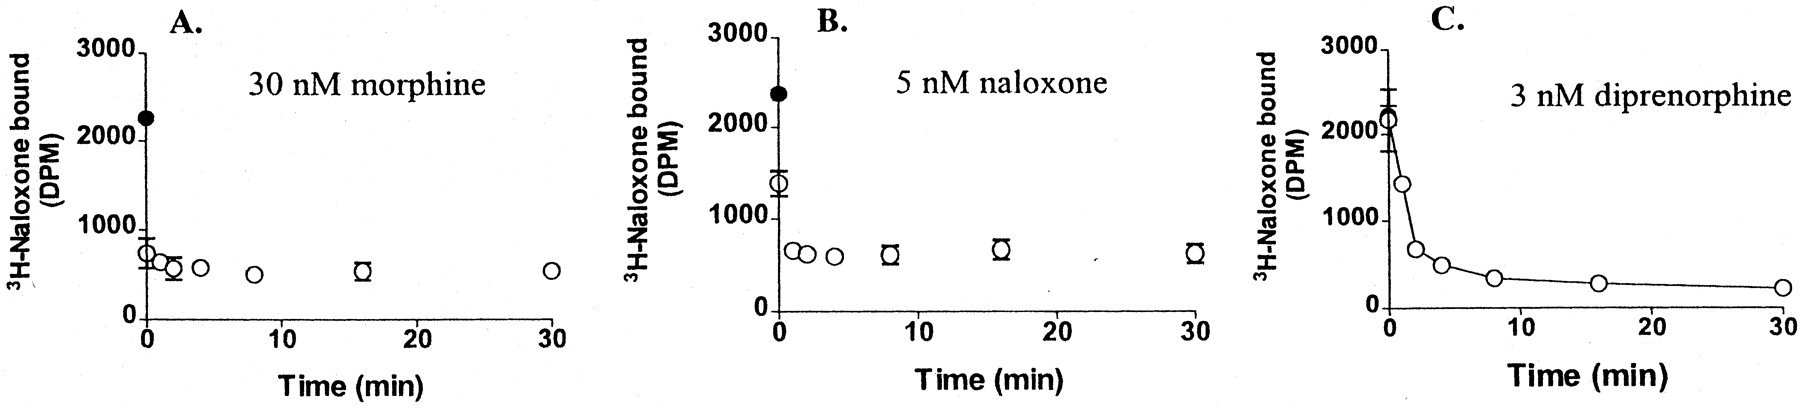
[3H]Naloxone binding to intact HEK-μ cells at room temperature in the absence (solid circles) or the presence of unlabeled ligands added either together with the tracer (time 10 s) or before the tracer at the indicated times (open circles). Unlabeled ligands were 30 nM morphine (A), 5 nM naloxone (B), and 3 nM diprenorphine (C). The experiment was replicated twice with similar results.
To distinguish further the binding behavior of oripavines and oxymorphinans, we incubated unlabeled ligands and [3H]naloxone tracer for 30 min with HEK-μ membranes, at room temperature and at 4°C. Examples of the resultant displacement curves are shown in Fig. 6, with naloxone representing the type of displacement curves produced by the oxymorphinans, and diprenorphine representing the oripavines. The calculated EC50 values and slope factors (n) are given in Table 3B. Whereas the curves for morphine and naloxone were similar at 4°C and room temperature, diprenorphine and etorphine were considerably more potent at room temperature than at 4°C. Moreover, the slope factors for the latter two changed from ∼1.2 at 4°C to ∼2.1 at room temperature. This result demonstrates that the binding mode of the oripavines to MOR differs qualitatively and quantitatively from that of the oxymorphinans.

Equilibrium binding curves measuring the competition between [3H]naloxone and unlabeled naloxone (A) or diprenorphine (B) in HEK-μ membranes. Incubations were done for 30 min at 4 or 25°C. The calculated IC50 values and slope factors are provided in Table 3B. Each experiment was replicated twice..
Discussion
Morphine stimulated a multiphasic Ca2+response in HEK-μ cells. This heterologous cell culture served as a test model for generic GPCR-Ca2+ signaling, because we have observed similar multiphasic Ca2+responses with muscarinic receptors endogenous to HEK293 cells, and with HEK293 cells transfected with the dopamine D2 receptor (unpublished data). Different cell types, and specifically neuronal cells, may display different Ca2+signaling patterns. Previous studies with a variety of cells had shown that both Gi/Go- and Gq/11-coupled receptors stimulate phospholipase C, resulting in the release of Ca2+ from intracellular stores and subsequent capacitative Ca2+ entry via SOCs. Herein, we demonstrate the presence of an early phase of the Ca2+ response, which seems to represent rapid influx of extracellular Ca2+ (peak 1). Ca2+e influx before, or independent of, Ca2+i release had been shown to occur upon activation of muscarinic receptors and other GPCRs (Felder et al., 1992; Montero et al., 1994), including MOR in SH-SY5Y cells (Smart et al., 1995). However, a direct experimental demonstration of rapid induction of Ca2+ influx by MOR was lacking.
Several findings support the view that fluorescence peak 1 represents rapid Ca2+ entry and peak 2 intracellular Ca2+ release as distinct responses. First, deletion of Ca2+ from the medium abolished the rapid Ca2+ response (peak 1) while leaving intracellular Ca2+ release unchanged (peak 2). Second, coinjection of morphine and diprenorphine seemed to activate exclusively Ca2+ entry, yielding peak 1 only and enabling one to study this signaling pathway separately. Third, peaks 1 and 2 were differentially sensitive to temperature: peak 1 disappeared at temperatures below 30°C, whereas peak 2 declined only when the temperature dropped below 20°C. These results support the hypothesis that peaks 1 and 2 are two distinct response pathways, but the molecular basis of the Ca2+ currents remains to be resolved.
Distinct Ligand Effects at MOR.
We tested whether chemically distinct ligands differentially affect different phases of the Ca2+ and cAMP responses. Significant differences were observed for peaks 1 and peak 2 of the Ca2+response between the agonists morphine, etorphine, and DAMGO. Moreover, the antagonists naloxone and diprenorphine also displayed substantial differences in blocking these Ca2+ signals. cAMP measurements were taken over longer time periods (5 min) than Ca2+ signals (<1 min), allowing for more equilibration time, which could have affected apparent ligand potency by several mechanisms. This impedes a direct comparison of relative potencies in different signaling pathways. Nevertheless, morphine displayed similar potencies for the Ca2+ and cAMP responses, whereas etorphine had similar potency for cAMP (observed over 5 min) and the peak 1 Ca2+ response (5–7 s), but was much more potent for the peak 2 response (15–17 s), arguing against time factors accounting for these differences. Yet, different levels of receptor activation may have been required for Ca2+ and cAMP responses. To avoid these confounding factors, we focused on comparing peak 1 (thought to represent rapid Ca2+e influx) and peak 2 (Ca2+i release) over relatively short time periods in direct comparison with ligand binding. However, ligand-receptor binding is not in equilibrium, which must be considered in the interpretation. This approach enables one to test whether different receptor conformations are associated with different response pathways, using observations over relatively short time periods. Our result suggests the following hypotheses: 1) effective receptor on-rates differ greatly among the ligand tested, or 2) MOR exists in several conformations that activate separate signaling pathways.
Different On-Rates for Oxymorphinans and Oripavines.
The early Ca2+ response (peak 1) rapidly desensitized (Fig.1B); therefore, varying on-rates could strongly affect the Ca2+ response. Hence, the observed 3-fold lower potency of DAMGO and 30-fold lower potency of etorphine in stimulating peak 1 compared with peak 2 could have resulted from slower on-rates for these ligands compared with morphine. Similarly, inability of coinjected diprenorphine to block peak 1 stimulated by morphine might be related to a slower receptor on-rate compared with morphine and naloxone. Consistent with this hypothesis, diprenorphine's potency against morphine increased dramatically upon preincubation, indicating slow access to or equilibration with MOR sites. Recent evidence suggests that essential molecules of GPCR signaling pathways are held in proximity of each other in microdomains such as caveoli and do not depend upon random collision to interact (Ostrom et al., 2000). Therefore, access of ligands to receptor microdomains may differ between oxymorphinans and the more lipophilic oripavines. However, the polar peptide DAMGO had properties intermediate to those of morphine and the more lipophilic etorphine, suggesting that access to microdomains may not play a role.
To compare rapid ligand-receptor binding events with Ca2+ signaling, we used [3H]naloxone as the tracer over a range of incubation times from 10 s to 30 min. Clear differences emerged between the oxymorphinans and the oripavines; the oripavines equilibrated much more slowly with [3H]naloxone-labeled MOR sites than the oxymorphinans (Figs. 2 and 3). However, several observations are inconsistent with a simple one-site receptor model involving the law of mass action and different on-rates. A slow on-rate for diprenorphine is inconsistent with its high binding potency compared with naloxone (equilibrium Kd values of ∼0.2 and ∼1 nM, respectively) (Sadée et al., 1982; Yu et al., 1986). Because receptor dissociation rate constants of naloxone are 5- to 10-fold faster than for diprenorphine (Sadée et al., 1982), on-rate constants should be similar for the two agents, approaching an upper value limited by diffusion. This is not the case herein. Moreover, increasing the diprenorphine concentration from 1 to 10 μM had little additional effect on Ca2+e influx (peak 1) stimulated by 100 nM morphine (Fig. 4B). Given that diprenorphine is present at 100-fold higher concentrations, whereas its published potency at MOR exceeds that of morphine, diprenorphine does not have immediate access to the morphine sites. Alternatively, these MOR sites responsible for peak1 of the Ca2+response could have unexpectedly low affinity for diprenorphine.
The paradoxical potencies of naloxone also cannot be reconciled with a model involving different on-rates and a single receptor site model. Naloxone was less potent against etorphine than morphine when coinjected, yet it was more potent against etorphine when preincubated. Activity profiles of the highly polar peptide DAMGO fell in between those of morphine and etorphine. Therefore, differences between these agents are unlikely to have arisen solely on the basis of different polarities. Therefore, alternative mechanisms must have played a role.
Multiple MOR Conformations.
Distinct receptor conformations/complexes could trigger different signaling pathways. Target size analysis of GPCRs in the plasma membrane has revealed large GPCR complexes exceeding 1 × 10⁶ Da, which partially break up upon agonist stimulation (Rodbell, 1992). Receptor aggregation as a main organizing principle could lead to oligomeric receptors (George et al., 2000) shown to affect receptor functions (Jones et al., 1998; Li et al., 2002). Specifically, GPCRs exist in physical contact with ion channels, as shown for complexes between dopamine D5 receptors and γ-aminobutyric acid-A (Liu et al., 2000), and β2 receptors and Cav1.2 Ca2+ channels (Davare et al., 2001). Therefore, different ligands could induce distinct signaling pathways at the same receptor.
The slope factor of n ∼2 observed for oripavine binding curves also indicates deviation from a simple ligand-receptor binding model. Positive binding cooperativity implied by the high slope factor could from allosteric interactions at the same receptor molecule, or at adjacent binding sites in an oligomeric receptor complex (George et al., 2000). Furthermore, slow interconversion among distinct receptor conformations, for example, by a process of deaggregation and reaggregation of varying MOR complexes, could account for these results. The observed temperature effects on binding equilibrium constants in HEK-μ membranes also indicated unusual binding behavior. Whereas temperature had little effect on oxymorphinans, both oripavines were considerably more potent at room temperature than at 4°C, with substantially higher slope factors of the displacement curve at room temperature. This result differs substantially from observations on β2-receptor binding affinities at different temperatures where agonists bound with increased affinity at low temperature, whereas antagonist binding remained unchanged, reflecting differences in entropy and enthalpy for agonist and antagonist binding (Weiland et al., 1979). Our binding results are compatible with a model of interconverting MOR conformations, but other models cannot be excluded. The use of rapid Ca2+ responses in this study, measured in seconds rather than minutes, has revealed remarkable differences among the tested ligands that could dissipate with longer incubations.
Pharmacological Significance of Distinct Ligand Effects at MOR.
Although the present study was performed with MOR transfected into a non-neuronal cell line, our results demonstrate the principle that different MOR agonists can cause significantly different Ca2+ response patterns. Ca2+ appears to play a major role in the development of tolerance and dependence (Sanghvi and Gershon, 1976), involving voltage-sensitive Ca2+ channels (Tokuyama et al., 1995),N-methyl-d-aspartate (Trujillo and Akil, 1991), and α-amino-3-hydroxy-5-methyl-4-isoxazolepropionic acid receptors (Carlezon et al., 1997), and calmodulin (Mestek et al., 1995), which interacts directly with MOR and serves as a regulator of G protein coupling and as a second messenger per se (Wang et al., 1999,2000). Hence, the observed differences in Ca2+signaling between morphine and etorphine could contribute to differences in their pharmacological effects. Indeed, etorphine produces less dependence in animal studies (Tokuyama et al., 1994). The finding that N-methyl-d-aspartate antagonists selectively affect antinociceptive tolerance to morphine, but not to other opioid agonists tested (Bilsky et al., 1996), suggests different tolerance mechanisms may exist for different agonists. Distinct signaling pathways triggered by different opioid ligands could contribute to their varying pharmacological properties.
Footnotes
-
This study was supported by Grant DA 04166 from the National Institute on Drug Abuse and Grant GM 43102 from the National Institutes of Health.
- Abbreviations:
- GPCR
- G protein-coupled receptor
- Ca2+i
- intracellular Ca2+
- SOC
- store-operated channel
- Ca2+e
- extracellular Ca2+
- MOR
- μ-opioid receptor
- HEK
- human embryonic kidney
- PTX
- pertussis toxin
- DAMGO
- [d-Ala2,N-Me-Phe4,Gly5-ol]-enkephalin
- HEK-μ
- human embryonic kidney cells stably transfected with MOR
- BAPTA
- 1,2-bis(2-aminophenoxy)ethane-N,N,N′,N′-tetraacetic acid
- Received November 30, 2001.
- Accepted April 12, 2002.
- The American Society for Pharmacology and Experimental Therapeutics


