

Abstract
Mechanisms for the induction of motor learning in the vestibulo-ocular reflex (VOR) were evaluated by recording the patterns of neural activity elicited in the cerebellum by a range of stimuli that induce learning. Patterns of climbing-fiber, vestibular, and Purkinje cell simple-spike signals were examined during sinusoidal head movement paired with visual image movement at stimulus frequencies from 0.5 to 10 Hz. A comparison of simple-spike and vestibular signals contained the information required to guide learning only at low stimulus frequencies, and a comparison of climbing-fiber and simple-spike signals contained the information required to guide learning only at high stimulus frequencies. Learning could be guided by comparison of climbing-fiber and vestibular signals at all stimulus frequencies tested, but only if climbing fiber responses were compared with the vestibular signals present 100 msec earlier. Computational analysis demonstrated that this conclusion is valid even if there is a broad range of vestibular signals at the site of plasticity. Simulations also indicated that the comparison of vestibular and climbing-fiber signals across the 100 msec delay must be implemented by a subcellular “eligibility” trace rather than by neural circuits that delay the vestibular inputs to the site of plasticity. The results suggest two alternative accounts of learning in the VOR. Either there are multiple mechanisms of learning that use different combinations of neural signals to drive plasticity, or there is a single mechanism tuned to climbing-fiber activity that follows activity in vestibular pathways by ∼100 msec.
- vestibulo-ocular reflex
- plasticity
- horizontal gaze velocity Purkinje cells
- climbing fibers
- parallel fibers
- cerebellar LTD
A major goal in neuroscience is to link systems-level analyses of learning with cellular analyses of plasticity. At the interface of these two levels of inquiry is the question of what patterns of neural activity are necessary and sufficient to induce synaptic plasticity in the awake behaving animal. Such neural signals must transduce the sensory stimuli that guide learning into the cellular changes that encode memory. In the present study, we ask what patterns of neural activity drive plasticityin vivo by examining the neural signals present during stimuli that induce motor learning in the vestibulo-ocular reflex (VOR).
The VOR stabilizes images on the retina by causing eye rotation in the opposite direction to head turns. Motor learning calibrates the VOR by modifying the amplitude of the reflex whenever retinal image motion is associated persistently with head turns (Gonshor and Melvill Jones, 1973; Ito et al., 1974; Miles and Fuller, 1974; Gauthier and Robinson, 1975). If head turns are paired with image motion in the same direction as the head turn, then a learned decrease is induced in the amplitude of the VOR. If head turns are paired with image motion in the opposite direction from the head turn, then a learned increase is induced in the amplitude of the VOR. These changes are documented by computing the gain of the VOR, defined as the ratio of eye movement amplitude to head movement amplitude during passive head turns in darkness.
Learning in the VOR is associative: it depends on the pairing of head turns and image motion. Therefore, one would expect the information that guides learning in the VOR to be carried in the correlation between two or more neural signals. Three likely candidates for the neural signals that guide learning in the VOR are the activity in vestibular pathways, activity in climbing fibers carrying visual signals, and the simple-spike activity in Purkinje cells carrying visual, vestibular, and eye movement signals (see Figs. 2, 4,left). All three of these neural signals are present at the putative sites of plasticity in the circuit for the VOR, which are in the floccular complex of the cerebellar cortex and in the vestibular nuclei (for review and citations to the relevant literature, see duLac et al., 1995; Highstein et al., 1997). In principle, any combination of climbing-fiber, simple-spike, and vestibular signals could act at either site of plasticity. Two specific hypotheses have been proposed regarding the neural signals that guide motor learning in the VOR. One suggests that learning is guided by the coincidence of simple-spike firing of Purkinje cells and activity of vestibular inputs to the site of plasticity in the vestibular nuclei (Miles and Lisberger, 1981). The other suggests that the coincidence of visual climbing-fiber and vestibular parallel-fiber activity guides learning by inducing long-term depression (LTD) of synapses from vestibular parallel fibers to Purkinje cells in the cerebellar cortex (Ito, 1972, 1982). This latter hypothesis represents a specific implementation of the general hypothesis that synaptic plasticity in the cerebellar cortex is the mechanism of cerebellum-dependent learning (Marr, 1969; Albus, 1971). The Marr–Albus–Ito hypothesis has considerable theoretical appeal and has received experimental support from the demonstration of LTD in the cerebellar cortex, driven by coincident climbing-fiber and parallel-fiber activation (Ito et al., 1982). However, causal links have yet to be established between cerebellar LTD and specific instances of cerebellum-dependent learning (Lisberger, 1998; Mauk et al., 1998).
In the present study, we constrain hypotheses regarding the neural signals that guide cerebellum-dependent learning by examining the patterns of climbing-fiber, simple-spike, and vestibular signals present during a range of stimuli that induce learned decreases or increases in the gain of the VOR. We focus on a well studied subclass of Purkinje cells called the horizontal gaze velocity Purkinje cells (HGVPs) (Lisberger and Fuchs, 1978a; Miles et al., 1980a). However, our recordings from other subclasses of Purkinje cells in the floccular complex suggest similar conclusions (Raymond and Lisberger, 1997). The results require revision of both of the previous hypotheses about motor learning in the VOR.
MATERIALS AND METHODS
Experiments were conducted on two male rhesus monkeys that had been trained to perform a visual fixation task (Wurtz, 1969) to obtain liquid reinforcement. Using methods that have been described previously, monkeys were anesthetized with isofluorane, and sterile procedure was used to implant bolts in the skull for restraining the head (Lisberger and Westbrook, 1985) and to implant a coil of wire on one eye for measuring horizontal and vertical eye position (Judge et al., 1980). In a second surgical procedure, a recording cylinder was cemented over a hole in the calvarium to allow access to the cerebellum for single-unit recording. The cylinder was placed stereotaxically at an angle of 26° (electrodes running in the sagittal plane from back to front) and aimed at the anteroposterior location of the ear bars, 11 mm lateral to the midline (Lisberger et al., 1994c).
During experiments, each monkey sat in a specially designed primate chair, to which his implanted head holder was secured. Platinum–iridium electrodes were used to make recordings from Purkinje cells in the floccular complex of the cerebellum (flocculus and ventral paraflocculus) (Gerrits and Voogd, 1989), while the monkey viewed moving visual stimuli and underwent passive whole body angular rotation. Vestibular stimuli were provided by a servo-controlled turntable (Contraves-Goertz, model 813) that rotated the monkey, the chair, and a set of 18-inch magnetic field coils together about a vertical axis.
After a Purkinje cell was isolated, it was first characterized by its responses (1) during the smooth pursuit eye movements evoked by sinusoidal motion of a small visual target along a horizontal or vertical axis at 0.5 Hz, ±31.4°/sec (position amplitude ±10°) and (2) as the monkey canceled his VOR by tracking a spot that moved exactly with sinusoidal head rotation about a vertical axis at 0.5 Hz, ±31.4°/sec. For these initial behavioral conditions, the visual stimulus was a small spot subtending 0.5° of visual angle. The present work focuses on HGVPs, a well studied class of Purkinje cells in the floccular complex (Lisberger and Fuchs, 1978a; Miles et al., 1980a). Purkinje cells were classified as HGVPs and were included in the study if (1) during horizontal smooth pursuit eye movements, simple-spike firing rate was modulated by ±10 spikes/sec and there was a phase difference (lead or lag) of less than 45° between peak firing rate and peak ipsiversive eye velocity (see below for calculation of amplitude and phase of simple-spike modulation); (2) during cancellation of the VOR, simple-spike firing rate was modulated by ±10 spikes/sec and the phase difference between peak firing rate and peak ipsiversive head velocity was less than 45°; and (3) modulation of simple-spike firing rate was greater during horizontal smooth pursuit eye movements than during vertical smooth pursuit eye movements. The results of similar experiments on Purkinje cells in the floccular complex that did not meet these requirements for being classified as HGVPs have been presented elsewhere (Raymond and Lisberger, 1997).
Recordings were made from HGVPs under conditions that had been shown in a previous study to cause learning in the VOR (Raymond and Lisberger, 1996). Sinusoidal head rotation was paired with the motion of a high-contrast, black and white pattern that was reflected off a mirror galvanometer onto the back of a tangent screen 114 cm in front of the eyes. The visual stimulus subtended ∼30° along the horizontal meridian and 20° along the vertical meridian. At the center of the visual stimulus was a bright spot that subtended 0.5° of visual angle. The vestibular stimulus was sinusoidal head motion with a peak velocity of ±10°/sec. All HGVPs were recorded during 0.5 and 5 Hz vestibular stimulation, and some cells were also recorded during 2 and 10 Hz stimuli. These combinations of frequency and peak velocity correspond to position amplitudes of ±3.2°, ±0.8°, ±0.32°, and ± 0.16° at 0.5, 2, 5, and 10 Hz, respectively. The visual stimulus moved either exactly with or exactly opposite to the head motion, thereby creating stimulus conditions for which the optimal tracking eye velocity was either zero times or two times the head velocity. Therefore, these stimulus configurations are called “×0” and “×2”. Figure 1 illustrates the ×0 and ×2 stimuli and the eye movements elicited by each at a stimulus frequency of 0.5 Hz. During both ×0 and ×2 stimuli, the monkey used visual tracking mechanisms to match gaze velocity (eye velocity with respect to the world) to visual stimulus velocity. As a result, the smooth component of eye velocity was nearly unmodulated during ×0 stimuli and was approximately twice head velocity during ×2 stimuli. At higher stimulus frequencies, tracking failed to match gaze velocity to target velocity, and the eye movements were more similar during ×0 and ×2 stimuli (Fuchs, 1967;Lisberger et al., 1981; Bock, 1982; Goldreich et al., 1992; Raymond and Lisberger, 1997). Limitations of the vestibular turntable and mirror galvanometer caused some deviation of the vestibular and visual stimulus from the commanded movements. However, the head was always within 10% of the commanded velocity, and the visual stimulus speed was always within 17% of the head speed and within 13° of being exactly in phase or exactly out of phase with the head.
For each frequency of sinusoidal vestibular stimulation, ×0 and ×2 stimuli were alternated, and each stimulus was presented for 60 to 120 sec. Recordings were made when the gain of the VOR was close to 1.0, and the ×0 and ×2 stimuli were not presented for long enough to cause measurable changes in the gain of the VOR in the dark. Thus, Purkinje cell responses were recorded under conditions that cause learning but were not followed as the gain of the VOR was modified. To maintain a constant level of alertness and to keep the visual stimulus approximately centered in the visual field during vestibular stimulation, monkeys were rewarded at intervals of 1.5–4 sec for keeping their gaze within ±10° of the spot in the center of the visual stimulus. This reward contingency was the same as that used previously to study behavioral changes in the VOR (Raymond and Lisberger, 1996) and was selected so that the conditions for recordings from Purkinje cells would be exactly the same as had been used to induce changes in the gain of the VOR in the behavioral study. In general, the monkeys kept their gaze within 2° of the central spot more than 90% of the time during the ×0 and ×2 stimuli.
Electrodes were introduced daily and driven by a hydraulic microdrive through the cerebral cortex toward the cerebellum. Entry into the cerebellum was recognized by a large increase in background activity and the presence of the complex spikes of Purkinje cells. Entry into the floccular complex was signaled by the presence of background activity related to eye movements and confirmed by the location relative to landmarks such as the vestibular nerve and bone. We did not perform histology to verify the location of the electrodes, because HGVPs are known to localize to the floccular complex (Lisberger and Fuchs, 1978a; Miles et al., 1980a).
The responses of individual Purkinje cells were isolated by careful movements of the electrode and then followed for up to 1 hour. Voltages related to eye position, eye velocity, head velocity, and visual stimulus position were recorded during the experiment at 500 Hz/channel. An eye velocity signal was obtained by using an analog circuit to differentiate the eye position output from the eye coil electronics, and the head velocity signal was obtained from a tachometer attached to the shaft of the turntable. The simple-spike activity of Purkinje cells was triggered with a hardware window discriminator, and the times of the resulting pulses were recorded to the nearest 10 μsec. In addition, unit activity was sampled at 50 kHz, and off-line spike sorting with time and amplitude windows was used to discriminate complex spikes and record their time of occurrence to the nearest 1 msec. Of our total sample of 54 HGVPs, complex spikes were analyzed for the 26 in which the complex-spike wave form could be clearly and reliably differentiated from the simple-spike wave form. In 15 HGVPs, the complex spike could be seen or heard, but not discriminated with confidence from the simple spikes in all records. In the remaining 13 Purkinje cells, complex spikes were not observed, but the cells were deemed likely to be Purkinje cells because of their simple-spike wave form, their irregular simple-spike firing rate, the ability to record the cells through several hundred micrometers of cerebellum, and, in some cases, their characteristic injury discharge at the end of the recording.
The data were analyzed after the experiment by aligning the records on the negative-to-positive zero crossings of sinusoidal head velocity or visual stimulus position. For ×0 and ×2 stimuli, tracking was not a criterion, so that all stimulus cycles were included in the analysis. For pursuit and cancellation of the VOR at 0.5 Hz, only cycles with good tracking were included in the analysis. Each cycle was divided into 64 equal-length bins, and head velocity, simple-spike firing rate, and complex-spike firing rate were averaged. The amplitude of modulation and phase of the responses were estimated as the amplitude and phase of the fundamental components provided by Fourier analysis of the averages.
RESULTS
To evaluate which neural signals guide the induction of learning in the VOR, we compared the patterns of neural activity present at the putative sites of plasticity during stimuli that induce learned decreases and increases in the gain of the VOR (Fig.1). Conditions that induce a learned decrease in gain were created by pairing a vestibular stimulus with a visual stimulus that moved exactly with the head (×0 stimulus). Conditions that induce a learned increase in gain were created by pairing a vestibular stimulus with a visual stimulus that moved exactly opposite to the head (×2 stimulus). We performed a pairwise analysis of the simple-spike, climbing-fiber, and vestibular signals present during ×0 and ×2 stimuli to determine whether each pair of signals contained the information required to guide learning.

Stimuli that induce learned decreases (×0, A) and increases (×2, B) in the gain of the VOR. Fromtop to bottom, the tracesare eye velocity with respect to the orbit, angular head velocity in space, visual stimulus velocity in space, and gaze velocity in space. Gaze velocity was computed as the sum of head velocity in space plus eye velocity in the orbit. In all traces, upward deflections represent leftward position or velocity (L); downward deflectionsrepresent rightward position or velocity (R). The brief deflections in the eye and gaze velocity tracesare caused by saccadic eye movements; their amplitudes have been cropped. The frequency of the stimuli is 0.5 Hz.
We used two criteria for evaluating whether a particular combination of neural signals could provide suitable guidance for the cellular mechanisms of learning in the VOR. First, signals that guide learning must discriminate ×0 stimuli, which decrease the gain of the VOR, from ×2 stimuli, which increase the gain of the VOR. Patterns of neural activity that are the same during both stimulus configurations would contain no information about whether the gain should decrease or increase and therefore could not be responsible for the opposite learned changes in the VOR induced by the ×0 and ×2 stimuli. This criterion is illustrated by previous analyses of the correlation between the vestibular stimulus and simple-spike activity in HGVPs (Lisberger and Fuchs, 1978a; Miles et al., 1980a). During sinusoidal stimuli at frequencies below 0.5 Hz, simple-spike activity was in phase with ipsiversive head velocity during the ×0 stimulus configuration but was out of phase with ipsiversive head velocity during the ×2 stimulus configuration. Therefore, Miles and Lisberger (1981)hypothesized that the timing of HGVP simple-spike activity relative to ipsiversive or contraversive head velocity could determine whether cellular changes that increase or decrease the gain of the VOR were induced.
In the present paper, we applied an additional criterion: if there is a single mechanism that mediates learning in the VOR, then a single pair of neural signals should evince similar patterns of activity during all stimuli that induce similar learned changes in the VOR. For example, ×0 stimuli are effective at inducing learned decreases in the gain of the VOR, and ×2 stimuli are effective at inducing learned increases in the gain of the VOR for sinusoidal stimulus frequencies up to at least 5 Hz (Raymond and Lisberger, 1996). For 10 Hz stimuli, the changes are generally in the adaptive direction (decrease in gain for ×0 stimuli, increase in gain for ×2 stimuli) but are smaller and less consistent. Thus, if an increase in the gain of the VOR is induced by coincident activity in a pair of neural pathways, then activity in those pathways should be coincident during ×2 stimuli at all frequencies from 0.5 to 10 Hz. To evaluate this prediction, we analyzed the neural signals present during ×0 and ×2 stimuli at 0.5, 2, 5, and 10 Hz. Neural signals that meet our two criteria would provide unambiguous information about whether to increase or decrease the gain of the VOR and thus could serve as error signals to guide learning.
We examined three pairs of neural signals: simple-spike activity in Purkinje cells versus vestibular signals; climbing-fiber activity versus vestibular signals; and simple-spike versus climbing-fiber activity. We were able to evaluate all three pairs simultaneously by recording from Purkinje cells under conditions in which we controlled the vestibular inputs. Simple-spike activity was recorded directly from the Purkinje cells. Climbing-fiber activity was recorded by isolating complex spikes from recordings of Purkinje cells, because complex spikes are driven in a one-to-one manner by spikes in the climbing-fiber input to the Purkinje cell. We did not record the vestibular inputs to either the brainstem or cerebellar site of plasticity directly. Because we controlled the vestibular stimulus, however, we could be confident that these inputs were identical for ×0 and ×2 stimuli at a particular frequency. As a result, comparison of Purkinje cell complex-spike or simple-spike discharge with the head velocity stimulus at a particular frequency reveals whether learning could be guided by correlating climbing-fiber responses or simple-spike activity in Purkinje cells with the activity of any set of vestibular neurons. Here, we present the results from the HGVP subclass of Purkinje cells (Lisberger and Fuchs, 1978a; Miles et al., 1980a). We focused on these cells because they have been shown to express changes in firing in association with changes in the gain of the VOR and therefore are widely thought to play a role in learning (Miles et al., 1980b; Lisberger et al., 1994c). We have reported previously that similar conclusions can be drawn for other subclasses of Purkinje cells in the floccular complex (Raymond and Lisberger, 1997).
Correlation of Purkinje cell simple-spike activity with the vestibular stimulus during learning
The histograms in Figure 2 show the simple-spike activity in a typical HGVP during stimuli that, if prolonged, would have induced learned changes in the gain of the VOR. All four stimuli caused modulation of the simple-spike activity around a fairly high-average firing rate of ∼70–80 spikes/sec. Because of the high spontaneous firing rate of the HGVPs, we analyze the modulation of simple-spike activity rather than absolute levels of activity. At 0.5 Hz, the timing of elevated simple-spike activity relative to the vestibular stimulus discriminated the ×0 stimulus configuration from the ×2 stimulus configuration. When a 0.5 Hz vestibular stimulus was paired with ×0 visual stimulus motion, peak simple-spike activity in the HGVP coincided with ipsiversive head motion (Fig. 2A, vertical dashed line,Ipsi). When the same vestibular stimulus was paired with ×2 visual stimulus motion, peak simple-spike activity coincided with contraversive head motion (Fig 2C, vertical dashed line, Contra). Simple-spike activity also was modulated during the 5 Hz stimuli. However, at this frequency, the relative timing of the vestibular stimulus and simple-spike activity in the HGVP failed to discriminate the ×0 stimulus from the ×2 stimulus. Simple-spike activity peaked during contraversive head velocity, regardless of whether the stimulus induced a decrease (Fig.2B, ×0) or increase (Fig.2D, ×2) in the gain of the VOR.

Histograms showing the simple-spike activity recorded in a representative Purkinje cell during stimuli that induce learned decreases (×0, A,B) and increases (×2, C,D) in the gain of the VOR. Head velocity, Angular head velocity in the horizontal plane. Vertical dashed lines mark peak contraversive and ipsiversive head velocity. Note the different time scales in the left(A, C) and right(B, D) panels, which show data for sinusoidal stimuli at 0.5 and 5 Hz, respectively. Twenty to 500 stimulus cycles were averaged to obtain each histogram. The simplified circuit diagram on the left highlights the loci of vestibular and Purkinje cell (PC) simple-spike signals in the circuit for the VOR.
Figure 3 summarizes the correlation of the vestibular stimulus with simple-spike activity recorded in the entire sample of 54 HGVPs. Responses are plotted in polar coordinates, at a distance from the origin corresponding to the amplitude of response modulation and an angle corresponding to the phase of peak simple-spike activity relative to the vestibular stimulus. Simple-spike responses in phase with peak ipsiversive head velocity are plotted in Figure 3 to the right of the origin, responses in phase with peak contraversive head velocity are plotted to the left of the origin, and clockwise rotation around the graph represents increased phase lead. Thus, in these polar plots, the phase reflects the relative timing of the simple-spike and vestibular signals. The key question is whether the responses to ×0 and ×2 stimuli plot in separate parts of each graph or whether the responses during ×0 and ×2 stimuli are similar and plot together.

Summary of Purkinje cell simple-spike responses, plotted relative to the vestibular stimulus. Each plot compares responses during ×0 stimuli and ×2 stimuli at the single frequency indicated in the bottom right quadrant. Each point represents the simple-spike activity recorded in a single Purkinje cell, plotted in polar coordinates with distance from the origin corresponding to the amplitude of response modulation and an angle corresponding to the phase shift between peak simple-spike activity and head velocity. Responses in phase with peak ipsiversive head velocity are plotted to the right of the origin, responses in phase with peak contraversive head velocity are plotted to theleft of the origin, and clockwise rotation around the graph represents increased phase lead. An individual Purkinje cell contributed two symbols for each stimulus frequency: a + (monkey D) or X (monkey E)symbol for the ×0 stimulus, and a filled square (monkey D) or filled triangle (monkey E) for the ×2 stimulus. The plots in A–D are on the same scale, with inner and outer circles representing 10 simple spikes/sec (SS/s) and 50 simple spikes/sec, respectively.
At 0.5 Hz (Fig. 3A) and 2 Hz (Fig. 3B), the patterns of simple-spike and vestibular signals present during the ×0 stimuli (Fig. 3, + and X symbols) were clearly different from the patterns of signals present during the ×2 stimuli (Fig. 3, filled symbols). Responses to the ×0 and ×2 stimuli form distinguishable, almost nonoverlapping populations that plot on opposite sides of each graph. Thus, the timing of the simple spikes relative to the vestibular stimulus can discriminate ×0 from ×2 stimuli at these low frequencies. In contrast, at 5 Hz (Fig.3C) and 10 Hz (Fig. 3D), the patterns of simple-spike and vestibular signals present during the ×0 stimulus configuration were quite similar to those present during the ×2 stimulus configuration. The polar plots in Figure 3 show extensive overlap in the response populations, even for the 5 Hz stimuli, which produced simple-spike responses of amplitudes similar to those produced by lower-stimulus frequencies. This indicates that the relative timing of simple-spike and vestibular signals cannot distinguish the ×0 stimuli from the ×2 stimuli at frequencies of 5 Hz or above.
Correlation of complex-spike activity with the vestibular stimulus during learning
The histograms in Figure 4illustrate the relationship between the vestibular stimulus and the complex-spike activity of one HGVP during ×0 and ×2 stimuli at 0.5 and 5 Hz. Complex-spike activity precisely reflects the activity of the climbing-fiber input to the HGVP, because spikes in the climbing fiber produce complex spikes in the Purkinje cell target in a one-to-one manner. Complex-spike activity was modulated during all four stimuli and, at each frequency, satisfied the criterion that comparison with the vestibular stimulus discriminated the stimuli that decreased (×0) versus increased (×2) the gain of the VOR. For example, during the 5 Hz vestibular stimulus, complex-spike activity was in phase with ipsiversive head velocity when the gain of the VOR needed to decrease (Fig. 4B, ×0) but was in phase with contraversive head velocity when the gain needed to increase (Fig.4D, ×2). However, the phase of the peak complex-spike response relative to the vestibular stimulus depended not just on whether the stimulus would induce a decrease or increase in the gain of the VOR but also on the stimulus frequency. During the ×0 stimuli, for example, complex-spike activity was in phase withipsiversive head velocity at 5 Hz (Fig.4B) but was in phase with contraversivehead velocity at 0.5 Hz (Fig. 4A).

Histograms showing climbing-fiber activity during stimuli that induce learned decreases (×0,A, B) and increases (×2,C, D) in the gain of the VOR. Climbing-fiber activity was recorded as complex spikes in the representative Purkinje cell whose simple-spike responses are shown in Figure 2. Climbing-fiber responses from 20–500 stimulus cycles were averaged to obtain each histogram. Note the different time scales in the left (A, C) andright (B, D)panels, which show data for sinusoidal stimuli at 0.5 and 5 Hz, respectively. Vertical dashed lines mark peak contraversive and ipsiversive head velocity. The simplified circuit diagram on the left highlights the loci of vestibular signals and climbing-fiber (CF) signals in the circuit for the VOR. IO, Inferior olive.
Figure 5 uses polar plots to summarize the correlation of the vestibular stimulus with the complex-spike responses in all 26 HGVPs in which the complex spike was isolated. For each stimulus frequency, the complex-spike responses to the ×0 and ×2 stimuli plot on opposite sides of the graph, forming distinguishable, almost nonoverlapping populations. However, in the different graphs, the phase of the complex-spike responses relative to the vestibular stimulus rotated as a function of stimulus frequency, indicating that the relative phase of climbing-fiber and vestibular signals was not similar for all stimuli that produced similar learned changes in the gain of the VOR. During the ×2 stimuli (Fig. 5, filled symbols), for example, peak complex-spike activity led ipsiversive head velocity slightly at 0.5 Hz (Fig. 5A), it lagged ipsiversive head velocity at 2 and 10 Hz (Fig.5B,D), and it was almost exactly out of phase with ipsiversive head velocity at 5 Hz (Fig.5C). Similarly, complex-spike responses to ×0 stimuli at different frequencies peaked during different phases of the vestibular stimulus (Fig. 5, + and X symbols).

Summary of climbing-fiber responses, plotted relative to the vestibular stimulus. A–D, Climbing-fiber responses to stimulus frequencies of 0.5, 2, 5, and 10 Hz. Responses are plotted in polar coordinates, with distance from the origin corresponding to the amplitude of response modulation and an angle corresponding to the phase shift between peak climbing-fiber activity and head velocity. Responses in phase with peak ipsiversive head velocity are plotted to the right of the origin, responses in phase with peak contraversive head velocity are plotted to the left of the origin, and clockwise rotation around the graph represents increased phase lead. An individual climbing fiber contributed two symbols for each stimulus frequency: a + (monkey D) or X (monkey E)symbol for the ×0 stimulus, and a filled square (monkey D) or a filled triangle (monkey E) for the ×2 stimulus. R×0 marks the point in the vestibular stimulus leading peak contraversive head velocity by 46°, and R×2 marks the point in the vestibular stimulus leading peak ipsiversive head velocity by 46°. Open arrows show the predicted phase at each frequency for a fixed delay in the climbing-fiber response of 122 msec from R×0 . Filled arrowsshow the predicted phase at each frequency for a fixed delay in the climbing-fiber response of 122 msec fromR×2 . In all panels, inner and outer circles represent 1 climbing-fiber spike per second (CFR/s) and 2 climbing-fiber spikes/sec, respectively. Note the difference in scale from Figure 3.
The change in phase of the complex-spike responses with frequency can be described by a fixed time delay between a fixed reference point in the vestibular stimulus and peak complex-spike activity. We fit the phases of the complex-spike responses to ×0 and ×2 stimuli at 0.5, 2, 5, and 10 Hz with the following equations:
 Equation 1
 Equation 2where θ×0,ν and θ×2,ν are the phase of peak complex-spike activity during a ×0 or ×2 stimulus at frequency ν,T is a fixed time delay, R×0
is the reference point for ×0 stimuli, R×2
is the reference point for ×2 stimuli, and R×2
is constrained to be exactly 180° opposite R×0
:R×2
= R×0
+π. We found that a fixed delay (T) of 122 msec and reference points on the vestibular stimulus leading peak contraversive (for R×0
) and ipsiversive (forR×2
) head velocity by 46° yielded the best fit. Thus, the frequency dependency of the complex spike responses is approximately consistent with the 100 msec latency between visual stimuli and complex-spike responses reported previously (Stone and Lisberger, 1990)
Equation 2where θ×0,ν and θ×2,ν are the phase of peak complex-spike activity during a ×0 or ×2 stimulus at frequency ν,T is a fixed time delay, R×0
is the reference point for ×0 stimuli, R×2
is the reference point for ×2 stimuli, and R×2
is constrained to be exactly 180° opposite R×0
:R×2
= R×0
+π. We found that a fixed delay (T) of 122 msec and reference points on the vestibular stimulus leading peak contraversive (for R×0
) and ipsiversive (forR×2
) head velocity by 46° yielded the best fit. Thus, the frequency dependency of the complex spike responses is approximately consistent with the 100 msec latency between visual stimuli and complex-spike responses reported previously (Stone and Lisberger, 1990)
The open and filled arrows in Figure 5 show the fixed time delay of 122 msec from R×0 and from R×2 , respectively. The fixed delay translates into a progressively larger phase lag at higher frequencies (22°, 88°, 220°, and 439° at 0.5, 2, 5, and 10 Hz). Overall, the average peak complex-spike responses to ×0 stimuli at all four frequencies were well fit as occurring 122 msec afterR×0 (Fig. 5, open arrows), and the average peak complex-spike responses to ×2 stimuli were well fit as occurring 122 msec after R×2 (Fig. 5,filled arrows). We constrained the reference pointsR×0 and R×2 to be 180° apart so that a single time delay would have the same meaning for both ×0 and ×2 stimuli. Although R×0 andR×2 were obtained by fitting the complex-spike responses, they correspond to points on the vestibular stimulus that coincide, within 30°, with peak activity of the primary afferents in the contralateral and ipsilateral vestibular nerves, respectively. On average, peak firing in the primary afferents leads peak ipsiversive head velocity by ∼15° at 0.5 Hz and by ∼55° at 8 Hz (Fernandez and Goldberg, 1971; Lisberger and Pavelko, 1986).
Correlation of complex-spike and simple-spike activity during learning
Comparison of Figures 3 and 5 reveals that the correlation of simple-spike and complex-spike activity discriminates ×0 from ×2 stimuli during a subset, but not all of the stimulus frequencies tested. At 5 Hz, simple-spike and complex-spike activity were approximately in phase during the ×2 stimulus (Figs. 3C,5C, filled symbols) and 180° out of phase during the ×0 stimulus (+ and X symbols). At 10 Hz (Figs. 3D, 5D), simple-spike and complex-spike activity were in phase during the ×0 stimulus and 180° out of phase during the ×2 stimulus. At 0.5 Hz (Figs. 3A, 5A) and 2 Hz (Figs. 3B, 5B), simple-spike and complex-spike activity were 180° out of phase during both ×0 and ×2 stimuli. Thus, the correlation of simple-spike and climbing-fiber signals discriminated stimuli that increase the gain of the VOR from stimuli that decrease the gain of the VOR at high stimulus frequencies, such as 5 or 10 Hz, but not at lower frequencies, such as 0.5 or 2 Hz. Even at the higher stimulus frequencies, the simple-spike and climbing-fiber signals failed the second criterion for signals that guide learning, of evincing similar patterns of activity during all stimuli that induce similar learned changes in the VOR.
Computational analysis of plasticity mechanisms driven by the correlation of climbing-fiber activity and vestibular signals
The only pair of signals examined that discriminated ×0 from ×2 stimuli at each stimulus frequency was the correlation of climbing-fiber (complex-spike) and vestibular signals. Therefore, this is the only pair of signals that potentially could guide learning across the full range of sinusoidal stimulus frequencies that induce learning. Moreover, the fits to Equations 1 and 2 suggest that a single plasticity mechanism must be tuned to climbing-fiber activity that follows activity in vestibular pathways by ∼100 msec if it is to account for all motor learning in the VOR. To assess a number of factors that could affect this conclusion, we present a computational analysis of the features a plasticity mechanism must have to permit the correlation of climbing-fiber and vestibular signals to guide learning.
First, we must consider how the vestibular stimuli might be represented at the sites of plasticity. This issue is of particular importance in the cerebellar cortex, because the responses of vestibular parallel fibers have not been described, and the question of how to identify granule cell recordings in behaving animals has not been resolved. In vestibular primary afferents, sinusoidal vestibular stimuli are represented by sinusoidal modulation of firing rate. At frequencies of 0.5, 2, 5, and 10 Hz, firing rate leads ipsiversive head velocity by phases that average ∼15°, 25°, 40°, and 60° (Fernandez and Goldberg, 1971; Lisberger and Pavelko, 1986). At each stimulus frequency, however, the population of primary afferents exhibits a range of phases (Fernandez and Goldberg, 1971; Lisberger and Pavelko, 1986). In particular, some afferents show more sensitivity to acceleration and hence more phase lead in their firing relative to head velocity. Furthermore, at the sites of plasticity in the vestibular nuclei and cerebellar cortex, the neural representation of the vestibular stimuli may be carried by neurons with an even broader range of responses. For example, the vestibular mossy fiber inputs to the floccular complex and secondary vestibular afferents in the vestibular nuclei can respond in phase with primary afferents from either the ipsilateral or contralateral vestibular nerve (Shimazu and Precht, 1966; Lisberger and Fuchs, 1978b; Miles et al., 1980a). In addition, vestibular mossy fiber inputs might be extensively filtered by circuits in the cerebellar cortex to yield vestibular parallel fibers with a wide range of response phases. Therefore, vestibular inputs with a broad range of response phases could be available to plasticity mechanisms.
We demonstrate that a plasticity mechanism tuned to a 100 msec delay between its vestibular and climbing-fiber inputs is required to account for motor learning in the VOR, even if the vestibular inputs do exhibit a broad range of response phases. We further show that this tuning must be implemented in the plasticity mechanism itself and not by using neural circuits to delay the incoming vestibular signals.
Neural circuit model
In our simulations, we consider a single Purkinje cell with 36 vestibular parallel-fiber inputs, five of which are illustrated in Figure 6. We assume that each parallel fiber exhibits sinusoidal modulation of its firing rate during a sinusoidal head velocity stimulus. Each parallel fiber has a unique phase of peak activity, distributed evenly from −90° to +260° with respect to head velocity:
 Equation 3
 where t is time, and ν is the frequency of the vestibular stimulus. Activity in each parallel fiber varies from 0 to 2. Peak activity in PF0
coincides with peak ipsiversive head velocity, and more positive phase values (ϕ) correspond to parallel fibers with progressively more phase lag. Our simulations thus consider the full range of possible response phases in the vestibular parallel fibers.
where t is time, and ν is the frequency of the vestibular stimulus. Activity in each parallel fiber varies from 0 to 2. Peak activity in PF0
coincides with peak ipsiversive head velocity, and more positive phase values (ϕ) correspond to parallel fibers with progressively more phase lag. Our simulations thus consider the full range of possible response phases in the vestibular parallel fibers.

Schematic showing several simulated vestibular parallel-fiber (PF) inputs to a single Purkinje cell (PC). The trace above each parallel fiber shows its activity during sinusoidal head rotation about a vertical axis. The dashed vertical line marks the time of peak ipsiversive head velocity. Activity inPFϕ lags peak ipsiversive head velocity by ϕ degrees. Each PFϕ synapses onto the Purkinje cell with a weight wϕ.
Equations 4-7 below are a formal description of widely accepted principles about functional connectivity in the circuit for the VOR. We used these equations to calculate the predicted changes in the VOR resulting from changes in the weights of the vestibular inputs to the Purkinje cell from parallel fibers with different phases. We assume that the VOR-driven eye movement response before learning is equal in amplitude and opposite in direction to head velocity (H). Thus, during a sinusoidal vestibular stimulus of amplitude A, the prelearning VOR-driven eye movement is described by:
 Equation 4Positive values for H(t) andVORpre
(t) represent ipsiversive head or eye velocities. The VOR-driven eye movement response after learning (VORpost
) is equal to the sum of the prelearning VOR (VORpre
) and the change in the VOR attributable to learning (ΔVOR):
Equation 4Positive values for H(t) andVORpre
(t) represent ipsiversive head or eye velocities. The VOR-driven eye movement response after learning (VORpost
) is equal to the sum of the prelearning VOR (VORpre
) and the change in the VOR attributable to learning (ΔVOR):
 Equation 5Activation of Purkinje cells in the floccular complex produces ipsiversive eye movement by inhibiting neurons in the direct VOR pathways through the brainstem (Baker et al., 1972; Fukuda et al., 1972; Highstein, 1973; Ito et al., 1977; Lisberger et al., 1994a), so the learned change in the VOR-driven eye movement response attributable to a learned change in the activity of the Purkinje cell can be described by:
 Equation 6where K is a constant >0 (K = 1.0 in all simulations).
We can describe the learned change in activity of the Purkinje cell attributable to learned changes in the parallel-fiber weights as:
 Equation 7where wϕ is the synaptic weight fromPFϕ to the Purkinje cell. Note that the model calculates only the changes in Purkinje cell activity (ΔPC(t)) and parallel-fiber weights (Δwϕ) attributable to learning. Therefore, we need not make any assumptions about their absolute values (PC(t) and wϕ) or about the contribution of VOR pathways that are not modified by learning.
A critical feature of the circuit for the VOR captured in Equations3-7 is that the timing of activity in a Purkinje cell will determine the effect of that activity on the gain of the VOR. Purkinje cell activity drives ipsiversive eye movement (or, equivalently, it reduces contraversive eye movement). Enhanced ipsiversive eye movement during contraversive head movement constitutes an increase in the gain of the VOR. Enhanced ipsiversive eye movement (reduced contraversive eye movement) during ipsiversive head movement constitutes a decrease in the gain of the VOR, and thus:
Increasing Purkinje cell activity duringcontraversive head movement increases the gain of the VOR.
Increasing Purkinje cell activity duringipsiversive head movement decreases the gain of the VOR.
The timing of Purkinje cell activity relative to head movement is determined by the balance of synaptic input from parallel fibers that fire at different phases of the head movement. Thus, if multiple parallel-fiber weights are changed, the effect on the VOR will depend on the change in the balance of synaptic strength in vestibular parallel fibers with different phases. A relative increase in the synaptic strength of parallel fibers that fire most during contraversive head velocity will increase the gain of the VOR. A relative increase in the synaptic strength of parallel fibers that fire most during ipsiversive head velocity will decrease the gain of the VOR. We will consider primarily the effects of synaptic depression rather than potentiation and the corresponding principles:
If depression is greater in the parallel fibers that fire most during contraversive head velocity, then the gain of the VOR decreases.
If depression is greater in the parallel fibers that fire most during ipsiversive head velocity, then the gain of the VOR increases.
Figures 7 and8 illustrate the above principles by showing the predicted effects on the VOR for changes in the weights of individual parallel fibers with different phases. Figure 7 illustrates the values of the variables in Equations 3-7 during two cycles of a sinusoidal vestibular stimulus (H). In eachpanel, the synaptic weight of one of the 36 parallel fibers was decreased: PF0 in A,PF90 in B, andPF180 in C. In Figure 7, thebottom three traces show the predicted effects of changing the weight of that single parallel fiber on Purkinje cell activity during the vestibular stimulus (ΔPC), the change in the VOR-driven eye velocity response to the vestibular stimulus (ΔVOR), and the change observed in the postlearning VOR (VORpost , solid traces) compared with the prelearning VOR (VORpre ,dashed traces). Decreasing the weight of a parallel fiber that exhibits elevated activity during ipsiversive head movement (Fig 7A, Δw0 = −0.5) increases the gain of the VOR. Decreasing the weight of a parallel fiber that exhibits elevated activity during contraversive head movement (Fig.7C, Δw180 = −0.5) decreases the gain of the VOR. Changing the weight of a parallel fiber that lags peak ipsiversive head velocity by 90° (Fig. 7B, Δw90 = −0.5) produces no change in gain and a relatively large change in the phase of the VOR.

Predicted learned changes in the VOR for a reduction in the weight of parallel fibers that fire at different phases of the vestibular stimulus. Traces representing the variables in Equations 3-7 are shown for a reduction in the weight of a parallel fiber whose activity peaks during ipsiversive head velocity (A, Δw0 = −0.5), for a reduction in the weight of a parallel fiber whose activity lags ipsiversive head velocity by 90° (B, Δw90 = −0.5), and for a reduction in the weight of a parallel fiber whose activity peaks during contraversive head velocity (C, Δw180 = −0.5). H, Head velocity;PF0 , PF90 , PF180, activity in parallel fibers lagging ipsiversive head velocity by 0° (A), 90° (B), and 180° (C); ΔPC, learned change in activity of the Purkinje cell evoked by the vestibular stimulus; ΔVOR, learned change in the VOR-driven eye velocity;VORpre , eye velocity driven by vestibular stimulus before learning (dashed traces);VORpost , eye velocity driven by vestibular stimulus after learning (solid traces). For H, ΔVOR,VORpre , and VORpost traces, upward deflection represents ipsiversive (I) head or eye velocity, anddownward deflection represents contraversive (C) head or eye velocity. For PFand ΔPC traces, upward anddownward deflections represent increases and decreases in neural activity. Vertical dashed lines inA, B, and C mark the time of peak activity in PF0 ,PF90 , PF180 , respectively.

Predicted learned changes in the gain (A) and phase (B) of the VOR, plotted as a function of the phase of the vestibular parallel fiber (PF) undergoing synaptic depression (LTD) (Eq. 7, Δwϕ = −0.1). Peak activity in a parallel fiber of phase 0° coincides with peak ipsiversive head velocity. Larger phase values correspond to parallel fibers with progressively more lag relative to head velocity.A, Change in the gain of the VOR, plotted as the gain after synaptic depression divided by the gain before synaptic depression. Values greater than one represent increases in gain; values less than one represent decreases in gain. B, Change in the phase of the VOR, plotted as the difference between the phase before synaptic depression and the phase after depression. Positive values represent increased phase lag (in degrees), negative values represent increased phase lead.
Figure 8 summarizes the changes in the gain (A) and the phase (B) of the VOR that are predicted for reductions in the weights of individual parallel fibers whose activity peaks at different phases of the vestibular stimulus. Changes in the gain and phase of the VOR were obtained by first computingVORpost (t) and measuring its amplitude and phase. The gain of the VOR after learning was then computed as the amplitude ofVORpost (t) divided by the amplitude of H(t). This postlearning gain value was also equal to the change in VOR gain (post/pre), because the gain of the VOR before learning was assumed to be 1.0 (Eq.4). Note that computation ofVORpost (t) involves summation of multiple sine waves (Eqs. 3-7) and that the amplitude ofVORpost (t) depends on both the amplitude and phase of those sine waves. In Equation 5, for example, the amplitude of VORpost (t) is not equal to the sum of the amplitude ofVORpre (t) and the amplitude of ΔVOR(t), unlessVORpre (t) and ΔVOR(t) have the same phase. Therefore, an analytical solution for gain would be quite complicated, and we elected instead to compute VORpost (t) using Equations 3-7 and then to measure its amplitude and phase in the same way it was done in the behavioral experiments (Raymond and Lisberger, 1996). The change in phase of the VOR was computed as the difference between the phase of VORpre (t) and the phase of VORpost (t).
For each parallel fiber phase ϕ, changes in the gain and phase of the VOR predicted for a reduction in the weight of that one parallel fiber were computed from Equations 3-7 with Δwϕ = −0.1. Depression of the weights of vestibular parallel fibers with different phases predicted different effects on the VOR. The change in VOR gain (Fig. 8A) was a sinusoidal function of the phase of the vestibular parallel fiber whose weight was changed, with the maximal increase in gain predicted when the depressed parallel fiber carried vestibular signals in phase with ipsiversive head velocity and the maximal decrease predicted when the depressed parallel fiber carried signals in phase with contraversive head velocity. The change in the phase of the VOR (Fig. 8B) was zero for modification of parallel-fiber weights that produced maximal increases or decreases in gain and was maximal for modification of parallel-fiber weights that produced zero change in gain.
Simultaneous plasticity mechanism
Figures 7 and 8 illustrate that to understand how plasticity mechanisms with different features will affect the gain of the VOR, we need to calculate how those plasticity mechanisms will change the relative weights of vestibular parallel fibers that exhibit peak activity during different phases of the vestibular stimulus. The first plasticity mechanism evaluated was one that decreased the weight of a parallel fiber in proportion to the level of activity in that parallel fiber at the time of a climbing-fiber spike:
 Equation 8where T1
,T2
, … ,Tj
, … , Tk
are the times of spikes in the climbing fiber, and B is a constant >0. To avoid possible artifacts that might result from using any type of fit to approximate the climbing-fiber responses, the values of Tj
were obtained from the actual complex-spike times, recorded to a resolution of 1 msec, during a 60–120 sec epoch of a ×0 or ×2 stimulus. EachTj
was used once in a simulation, and division by k normalized for the number of climbing-fiber spikes used in each simulation. Multiplication by −B resulted in synaptic weight reduction [long-term depression (LTD)] rather than potentiation [long-term potentiation (LTP)], and a value ofB of 0.25 was chosen to yield changes in VOR amplitude that approximately matched those observed in behavioral experiments (Raymond and Lisberger, 1996). The complex-spike recordings from nine HGVPs each provided one set of Tj
values for each of the eight stimuli tested (×0 and ×2 stimuli at 0.5, 2, 5, and 10 Hz). For a given stimulus, the set of Tj
values was used to compute the change in weight (Δwϕ) for each of the 36 parallel fibers from Equation 8, and the Δwϕ values were used to compute the predicted changes in the VOR induced by each stimulus from Equations3-7. No optimization was performed, and the model was not run iteratively. We simply computed the effect of running the spike trains we recorded through various types of model plasticity mechanisms.
Equation 8where T1
,T2
, … ,Tj
, … , Tk
are the times of spikes in the climbing fiber, and B is a constant >0. To avoid possible artifacts that might result from using any type of fit to approximate the climbing-fiber responses, the values of Tj
were obtained from the actual complex-spike times, recorded to a resolution of 1 msec, during a 60–120 sec epoch of a ×0 or ×2 stimulus. EachTj
was used once in a simulation, and division by k normalized for the number of climbing-fiber spikes used in each simulation. Multiplication by −B resulted in synaptic weight reduction [long-term depression (LTD)] rather than potentiation [long-term potentiation (LTP)], and a value ofB of 0.25 was chosen to yield changes in VOR amplitude that approximately matched those observed in behavioral experiments (Raymond and Lisberger, 1996). The complex-spike recordings from nine HGVPs each provided one set of Tj
values for each of the eight stimuli tested (×0 and ×2 stimuli at 0.5, 2, 5, and 10 Hz). For a given stimulus, the set of Tj
values was used to compute the change in weight (Δwϕ) for each of the 36 parallel fibers from Equation 8, and the Δwϕ values were used to compute the predicted changes in the VOR induced by each stimulus from Equations3-7. No optimization was performed, and the model was not run iteratively. We simply computed the effect of running the spike trains we recorded through various types of model plasticity mechanisms.
Figure 9 summarizes the results of simulations that used Tj values obtained from the complex spike responses shown in Figure 4 to drive the simultaneous plasticity mechanism. The two graphs on the left side of Figure 9, A1 and A2 , show the predicted changes in the weights of the different vestibular parallel fibers for 0.5 and 5 Hz stimuli. These two graphs are summarized in Figure 9B, which plots the phase of the parallel fiber with the greatest synaptic depression as a function of the frequency of the ×0 and ×2 stimuli. Finally, the predicted changes in all parallel-fiber weights were converted to predicted changes in the VOR using Equations 3-7, and the predicted changes in the gain of the VOR are plotted as a function of stimulus frequency in Figure 9C.

Predicted synaptic and behavioral changes produced by a plasticity mechanism driven by simultaneous activity in climbing fibers and vestibular parallel fibers. Spike trains from the typical climbing fiber, whose responses are shown in Figure 4, were used as the input to the simultaneous plasticity mechanism (Eq. 8). Open symbols, Predicted changes for the climbing fiber spike trains present during ×0 stimuli; filled symbols, predicted changes for the climbing fiber spike trains present during ×2 stimuli.A, Predicted changes in the synaptic weights of parallel fibers that fire at different phases of the vestibular stimulus.A1 , Changes predicted for 0.5 Hz stimuli.A2 , Changes predicted for 5 Hz stimuli.B, Phase of the parallel fiber undergoing largest weight reduction (LTD) as a function of the stimulus frequency. Thethin vertical lines to the right of the graph mark the range of phases for ×0 stimuli at frequencies of 0.5, 2, 5, and 10 Hz, and the thick vertical lines represent the range of phases for ×2 stimuli. C, Predicted change in the gain of the VOR as a function of stimulus frequency.Arrows of the same style mark results corresponding to the same simulation.
During a 0.5 Hz, ×0 stimulus, most Tj values (complex spike times) coincided with contraversive head motion (Fig.4A), so the greatest weight changes occurred in parallel fibers that fired most vigorously during contraversive head motion (Fig. 9A1 ,B, open single arrows). As a result, the predicted change in the VOR was an appropriate decrease in gain (Fig. 9C,open single arrow). During the 0.5 Hz, ×2 stimulus, most Tj values coincided with ipsiversive head motion (Fig. 4C), the biggest weight changes occurred in parallel fibers that fired most vigorously during ipsiversive head motion (Fig.9A1 ,B, filled single arrows), and the predicted change in the VOR was an appropriate increase in gain (Fig. 9C, filled single arrow). Thus, as suggested previously (Ito, 1972, 1982), a plasticity mechanism driven by coincident activity in climbing fibers and vestibular parallel fibers could account for the induction of appropriate learned changes in the VOR by low-frequency stimuli.
In contrast, the simultaneous plasticity mechanism fails to predict the induction of appropriate changes in the VOR by the activity of this climbing fiber during the 5 Hz stimuli. During the 5 Hz, ×2 stimulus, most Tj values coincided with contraversive head motion (Fig. 4D), so the parallel fibers that fired during contraversive head motion underwent the most weight reduction (Fig. 9A2 ,B,filled double arrows). These changes in synaptic weight predicted a decrease in the gain of the VOR (Fig. 9C,filled double arrow), which is opposite to the gain change observed experimentally. Similarly, the simultaneous plasticity mechanism incorrectly predicted an increase in the gain of the VOR when the complex spikes recorded during the 5 Hz, ×0 stimulus (Fig. 4B) provided Tj values (Fig.9C, double open arrow). Similar computations were performed using Tj values obtained from the complex-spike times recorded in the same cell during 2 and 10 Hz stimuli, and the results are plotted in Figure 9,B and C. For these stimulus frequencies, predicted changes in gain were in the correct direction.
Figure 9B illustrates that the parallel fiber undergoing the biggest weight change varied with the frequency of the stimulus, as well as the stimulus configuration (×0 vs ×2). For the climbing fiber in this example, the parallel fibers undergoing the most depression during ×2 stimuli at frequencies from 0.5 to 10 Hz spanned a range of phases from −40° to 140° relative to ipsiversive head velocity, with positive values representing phase lag (Fig. 9B,filled symbols and thick vertical line). As a result, an increase in the gain of the VOR was correctly predicted for ×2 stimuli at some frequencies, but for ×2 stimuli at 5 Hz, a decrease in the gain was incorrectly predicted (Fig.9C, filled symbols). Likewise, the parallel fibers undergoing the most depression in response to ×0 stimuli at frequencies from 0.5 to 10 Hz spanned a range of phases from −10° to 210° (Fig. 9B, open symbols andthin vertical line), and the simultaneous plasticity mechanism failed to predict a decrease in the gain of the VOR in response to the ×0 stimulus at 5 Hz (Fig. 9C,open symbols).
We have focused on the parallel-fiber weights that underwent the greatest decrease under each stimulus condition. Inspection of Figure9, A1 and A2 , reveals that there were decreases in the weights of all parallel fibers. This results from our use of a plasticity mechanism that yields exclusively synaptic depression. We obtained the same effects on the gain of the VOR with a mixture of increases and decreases in parallel-fiber weights if we used a plasticity mechanism like that suggested by Bienenstock et al. (1982), which produced potentiation or depression depending on whether parallel-fiber activity was below or above its average level when a climbing-fiber spike occurred. Furthermore, it is important to note that a uniform decrease in all parallel-fiber weights would not cause any change in the VOR.
We performed similar computations to those illustrated in Figure 9using Tj values derived from the eight other individual HGVPs in which complex-spike times were recorded during all four stimulus frequencies. The results shown in Figure 9 are typical. For none of the nine cells did computations using the simultaneous plasticity mechanism predict appropriate gain changes for all stimulus frequencies. Thus, a plasticity mechanism guided by coincident activity in climbing fibers and vestibular inputs cannot account for the induction of appropriate learned changes in the gain of the VOR across the range of effective stimulus frequencies.
Nonsimultaneous plasticity mechanism
We next evaluated whether a plasticity mechanism tuned to nonsimultaneous activity in climbing fibers and vestibular parallel fibers might provide consistent guidance for learning across the range of effective stimulus frequencies:
 Equation 9where TPF-CF
is a constant time delay we will refer to as the parallel fiber to climbing fiber (PF-CF) interval. When TPF-CF
= 0, the nonsimultaneous plasticity mechanism described by Equation 9 is equivalent to the simultaneous plasticity mechanism of Equation 8. When TPF-CF
≠ 0, climbing-fiber spikes induce a change in the weight of each parallel fiber proportional to the level of activity in that parallel fiber TPF-CF
milliseconds before (for positiveTPF-CF
) or after (for negativeTPF-CF
) the climbing-fiber spike.
Equation 9where TPF-CF
is a constant time delay we will refer to as the parallel fiber to climbing fiber (PF-CF) interval. When TPF-CF
= 0, the nonsimultaneous plasticity mechanism described by Equation 9 is equivalent to the simultaneous plasticity mechanism of Equation 8. When TPF-CF
≠ 0, climbing-fiber spikes induce a change in the weight of each parallel fiber proportional to the level of activity in that parallel fiber TPF-CF
milliseconds before (for positiveTPF-CF
) or after (for negativeTPF-CF
) the climbing-fiber spike.
Figure 10 compares the results for several different values of TPF-CF when complex spike times from the example in Figure 4 provided theTj values used by the nonsimultaneous plasticity mechanism. Changes in the weights of each of the 36 parallel fibers were computed for the ×0 and ×2 stimuli from Equation 9, withTPF-CF = 50 msec (Fig.10A,D),TPF-CF = 100 msec (Fig.10B,E), orTPF-CF = 200 msec (Fig.10C,F). As in Figure 9B, thetop panels of Figure 10 plot the phase of the vestibular parallel fiber that underwent the largest reduction in weight as a function of the stimulus frequency. The predicted changes in all the parallel-fiber weights were used to compute predicted changes in the gain of the VOR from Equations 3-7 and were plotted as a function of the stimulus frequency in the bottom panels of Figure 10. When TPF-CF was 100 msec, parallel fibers with a phase close to 180° (those that fire most during contraversive head velocity) underwent the greatest weight reduction for ×0 stimuli at all frequencies tested, and parallel fibers with a phase of ∼0° (those that fire most during ipsiversive head velocity) underwent the greatest weight reduction for all ×2 stimuli (Fig. 10B). There was no overlap in the sets of parallel fibers undergoing the greatest weight reduction in response to the ×0 versus ×2 stimuli (thin and thick vertical lines at right edge of graph). These changes in parallel-fiber weights forTPF-CF = 100 msec predicted consistent decreases in the gain of the VOR in response to the ×0 stimuli and consistent increases in the gain of the VOR in response to the ×2 stimuli for the full range of stimulus frequencies included in the experiments (Fig.10E). In contrast, when TPF-CF = 50 or 200 msec, there was considerable variation in the phase of the parallel fibers undergoing the greatest weight changes for ×0 or ×2 stimuli at different frequencies, and there was overlap in the range of parallel fibers undergoing the largest weight reductions in response to ×0 versus ×2 stimuli (Fig.10A,C). These changes in parallel-fiber weights predicted appropriate gain changes at some frequencies and inappropriate gain changes at other frequencies (Fig.10D,F).

Predicted synaptic and behavioral changes for a plasticity mechanism driven by nonsimultaneous activity in climbing fibers and vestibular parallel fibers. Spike trains from the typical climbing fiber in Figure 4 were used as the input to the nonsimultaneous plasticity mechanism (Eq. 9). Reduction in the parallel-fiber weights was proportional to the activity in the parallel fiber at some interval (TPF-CF ) before a spike in the climbing fiber. Results are shown for three different values of TPF-CF : 50, 100, and 200 msec. A–C, Phase of the parallel fiber undergoing largest synaptic weight reduction as a function of the stimulus frequency. The thin vertical lines to theright of each graph mark the range of phases for ×0 stimuli at frequencies of 0.5, 2, 5, and 10 Hz, and the thick vertical lines represent the range of phases for the ×2 stimuli. D–F, Predicted change in the gain of the VOR as a function of stimulus frequency. Open symbols, Predicted changes for the climbing-fiber spike trains present during ×0 stimuli; filled symbols, predicted changes for the climbing-fiber spike trains present during ×2 stimuli.
Figure 11 delimits the range of values for the PF-CF interval (TPF-CF ) that predicted appropriate changes in the gain of the VOR using the complex-spike times from the example in Figure 4 as the inputTj values. These ranges were obtained from computations performed using values of TPF-CF from −250 to 250 msec, at intervals of 10 msec. The bold trace in Figure 11A plots the predicted change in the gain of the VOR for a ×0 stimulus at 0.5 Hz as a function of the PF-CF interval. For this low-frequency ×0 stimulus, a decrease in the gain of the VOR was predicted for all PF-CF intervals examined. Figure 11B plots the predicted change in the gain of the VOR for a ×0 stimulus at 2 Hz (bold trace) and replots the prediction for 0.5 Hz (light trace) on the same graph for comparison. Figure 11,C and D, adds the predictions for ×0 stimuli at 5 and 10 Hz (bold traces), and replots the predictions for lower frequencies as light traces. Figure 11,E–H, plots the predictions for ×2 stimuli in the same manner.

Range of PF-CF intervals (range of values forTPF-CF ) yielding appropriate changes in the VOR. Spike trains from the typical climbing fiber in Figure 4 were used as the input to the nonsimultaneous plasticity mechanism (Eq. 9). Predicted changes in the gain of the VOR for ×0 stimuli (A–D) and ×2 stimuli (E–H) are plotted as a function of the value ofTPF-CF . A, E, Predictions for 0.5 Hz stimuli. B, F, Predictions for 2 Hz stimuli (bold traces) and 0.5 Hz stimuli (thin traces). C,G and D, H, Predictions for 5 and 10 Hz stimuli (bold traces), with predictions for lower frequencies replotted (thin traces).Shaded regions in each graph mark the range of values for TPF-CF that yielded appropriate predicted changes in the gain of the VOR for all stimuli at or below the indicated frequency.
We define as “effective” any PF-CF interval that predicts decreases in the gain of the VOR for all ×0 stimuli and increases in gain for all ×2 stimuli. Any PF-CF interval with a trace plotting above 1.0 for a ×0 stimulus or below 1.0 for a ×2 stimulus cannot be considered effective, because that PF-CF interval fails to satisfy the criterion of predicting a change in the gain of the VOR in the experimentally observed direction across all stimulus frequencies. Theshaded regions in each panel of Figure 11 mark successive approximations of the range of effective PF-CF intervals as additional stimulus frequencies are considered. These shaded regions show that the inclusion of more and higher stimulus frequencies increasingly narrows the range of PF-CF intervals that could be effective. For ×0 stimuli, values of TPF-CF from ∼90 to 130 msec predicted decreases in the gain of the VOR at all stimulus frequencies tested (Fig. 11D). For ×2 stimuli, values of TPF-CF from ∼80 to 120 msec predicted increases in the gain of the VOR at all stimulus frequencies tested (Fig. 11H). Other values ofTPF-CF predicted inappropriate changes in the gain of the VOR at one or more stimulus frequency. The computations predicted only small changes in the phase of the VOR, <20° for all values of TPF-CF and all stimulus frequencies (not plotted).
Figure 12 summarizes the effective PF-CF intervals estimated for the climbing-fiber inputs to each of the nine HGVPs in which complex-spike responses to all four stimulus frequencies were recorded. Each bold horizontal line in Figure 12 shows the range of values ofTPF-CF that yielded appropriate changes in the gain of the VOR at all four frequencies when a different climbing fiber provided the input Tj values to the nonsimultaneous plasticity mechanism. For all nine climbing fibers, a range of values of TPF-CF around 100 msec predicted appropriate changes in gain for both ×0 and ×2 stimuli. For five cells, a TPF-CF value of approximately −100 msec consistently predicted increases in the gain of the VOR for ×2 stimuli. In addition, this value of TPF-CF predicted consistent decreases in gain for ×0 stimuli for one of the climbing fibers. It is likely that this extra range of values forTPF-CF at approximately −100 msec would have failed if we had tested with a greater number of stimulus frequencies.

Range of PF-CF intervals (range of values forTPF-CF ) that yielded appropriate predicted changes in the gain of the VOR for all four stimulus frequencies tested (0.5, 2, 5, and 10 Hz). Each linerepresents the range of effective values ofTPF-CF for one individual climbing fiber.A, Range of values of TPF-CF that yielded decreases in gain in response to ×0 stimuli.B, Range of values of TPF-CF that yielded increases in gain in response to ×2 stimuli.
Figure 12 shows unequivocally that a value forTPF-CF of 0 msec failed to predict appropriate changes in VOR gain for even a single climbing fiber. Therefore, plasticity mechanisms tuned to coincident activity in climbing-fiber and vestibular parallel-fiber pathways cannot provide consistent guidance for learning in the VOR. To account for learning under all stimulus conditions tested, a plasticity mechanism should be specifically “tuned” to climbing-fiber activity that follows activity in the vestibular inputs by ∼100 msec. The small difference between this 100 msec estimate of the time across which vestibular and climbing-fiber inputs should be compared and the value of 122 msec obtained from the fits to Equations 1 and 2 may be attributed to the use of the actual time of each complex spike for the simulations versus a sinusoidal fit of the complex-spike responses in Equations 1 and2.
Could the simultaneous plasticity mechanism be used if circuit properties delayed the vestibular parallel fiber inputs to Purkinje cells?
One potential implementation of the nonsimultaneous plasticity mechanism would be to use neural circuit properties to delay the vestibular signals in the parallel fibers and then use a simultaneous plasticity mechanism to change synaptic weights. However, Figure13 illustrates that this mechanism would introduce delays in the learned, parallel-fiber-mediated eye movements that would result in incorrect changes in the VOR. The effects of delaying the vestibular signals in the parallel fibers on the predicted changes in the VOR are shown in Figure 13 for ×2 stimuli at 0.5 Hz (left) and 5 Hz (right). For the purpose of illustration, we used only two vestibular afferents in this simulation, one whose activity peaked during peak ipsiversive head velocity and one whose activity peaked during peak contraversive head velocity (Fig. 13, AFFi ,AFFc ). We introduced a 100 msec delay between activity in the primary vestibular afferents driven by head movement and activity in the vestibular parallel fibers driven by the primary afferents (Fig. 13, PFi ,PFc ). This 100 msec delay translates into a phase lag of 18° at 0.5 Hz and 180° at 5 Hz, causing elevated activity in PFi to coincide with elevated climbing fiber activity (CFR) during ×2 stimuli at both frequencies. Therefore, a simultaneous LTD plasticity mechanism would produce the most synaptic depression in the PFi during ×2 stimuli at both frequencies. The weights of the two parallel fibers (wi ,wc ) were initially set to an equal and arbitrary value. The ×2 stimuli at both frequencies induced more depression in wi than inwc . This frequency-independent change in the balance of input to the Purkinje cell from parallel fibers driven by ipsiversive and contraversive head movement can be seen by comparingPFi × wi andPFc × wc before (Fig.13, dashed trace) and after (Fig. 13, solid trace) learning at both frequencies.

Predicted synaptic and behavioral changes for a simultaneous plasticity mechanism when a 100 msec delay was introduced in the vestibular parallel-fiber signals. Predictions were calculated for ×2 stimuli at 0.5 and 5 Hz, using two parallel fibers whose vestibular signals lagged ipsiversive or contraversive head velocity by 100 msec. H, Head velocity;AFFi , AFFc , activity in vestibular afferents that fire in phase with ipsiversive and contraversive head velocity, respectively;PFi , PFc , activity in parallel fibers whose responses are delayed 100 msec relative to those in AFFi ,AFFc (note that the different time scales in the left and right panels affect the apparent size of the 100 msec shift); CFR, average responses in the climbing fiber shown in Figure 4;PFi × wi ,PFc × wc , input to the Purkinje cell from each of the vestibular parallel fibers before (dashed trace) and after (solid trace) learning, computed as activity in the parallel fiber multiplied by its synaptic weight; ΔPC, learned change in the response of the Purkinje cell to the head velocity stimulus; ΔVOR, learned change in the VOR-driven eye velocity;VORpre (dashed trace), eye velocity elicited by the head velocity stimulus before learning;VORpost (solid trace), eye velocity elicited by the head velocity stimulus after learning. ForH, ΔVOR,VORpre , andVORpost traces, upward deflection represents ipsiversive (I) head or eye velocity, anddownward deflection represents contraversive (C) head or eye velocity. For AFF,PF, and ΔPC traces,upward and downward deflections represent increases and decreases in neural activity. Vertical dashed lines mark the time of peak activity inPFi to highlight its phase relationship toH and to CFR at stimulus frequencies of 0.5 and 5 Hz.
We then used Equations 4-7 to determine how the reduced weights of the delayed vestibular parallel-fiber signals would affect the gain of the VOR. Comparison of VORpost (Fig. 13,solid trace) and VORpre (dashed trace) shows a correct prediction of a learned increase in the gain of the VOR for the ×2 stimulus at 0.5 Hz and an incorrect prediction of a learned decrease in the gain of the VOR for the ×2 stimulus at 5 Hz. Delaying the vestibular parallel fiber inputs to Purkinje cells delays the effect of those vestibular inputs on eye movements so that they are 180° late at 5 Hz. Elevated activity inPFi coincided with ipsiversive head movement at 0.5 Hz, but the 100 msec delay caused elevated activity inPFi to coincide with contraversive head movement at 5 Hz. Thus, reduction in the synaptic weight ofPFi had opposite effects at the two frequencies, causing an increase in the gain of the VOR at 0.5 Hz and a decrease at 5 Hz. This example illustrates that filtering or delaying the vestibular signals by network properties cannot enable a plasticity mechanism tuned to simultaneous climbing-fiber and vestibular inputs to provide consistent guidance for motor learning in the VOR.
Effect of sharpness of tuning in the nonsimultaneous plasticity mechanism
Finally, we analyze how learning would be affected by the sharpness of tuning to the optimal TPF-CF
of ∼100 msec. In the above computations, plasticity was very sharply tuned: the amount of plasticity induced in a parallel fiber by a spike in a climbing fiber was solely determined by the activity in that parallel fiber exactly TPF-CF
milliseconds before the climbing-fiber spike. Here, we modify the plasticity mechanism so that the amount of plasticity induced by a spike in a climbing fiber depends on parallel-fiber activity in a window of time surrounding TPF-CF
milliseconds before the climbing-fiber spike. This is accomplished by convolving parallel-fiber activity with a Gaussian g(t), centeredTPF-CF
milliseconds before the climbing-fiber spike:
 Equation 10

 with B = 4 × 10⁻⁴. The* represents convolution, which can be thought of as a second-order process (e.g., the concentration of a second messenger), rising and decaying in response to parallel-fiber activity.
The value of ς determines the sharpness of tuning of the plasticity mechanism. Figure 14 shows the predicted changes in the gain of the VOR as a function of ς, computed using a value for TPF-CF of 100 msec. Eachpanel in Figure 14 plots the predictions for a single stimulus frequency. Each set of connected points represents the predictions obtained from the complex-spike activity of an individual HGVP during ×2 stimuli (Fig. 14, filled symbols) or ×0 stimuli (open symbols). For all stimulus frequencies, the predicted change in the gain of the VOR was largest for the smallest values of ς, which produced the sharpest tuning. As the value of ς increased, the predicted change in the gain of the VOR decreased, falling off more quickly for higher-stimulus frequencies than for lower-stimulus frequencies. This can be understood by considering the width of g(t) for different values of ς. For ς = 1 msec, g(t) is large for times very close to TPF-CF msec before the climbing-fiber spike (Tj −TPF-CF ), and g(t) is close to zero at all other times. For each climbing-fiber spike, the weight change in a parallel fiber is almost entirely determined by its activity within a few milliseconds of Tj −TPF-CF . Therefore, the predicted changes in each parallel fiber weight and in the VOR were very similar to those predicted by the nonsimultaneous plasticity mechanism described by Equation 9. For ς = 100 msec, g(t) is similar in amplitude over a window of several tens of milliseconds aroundTj − TPF-CF . For 0.5 Hz (Fig. 14A), this window is short compared with the stimulus period of 2000 msec, and learning is preserved. However, for higher frequencies, such as 5 or 10 Hz (Fig.14C,D), the window covers much of the stimulus period, and plasticity therefore depends more on the average firing rate in each parallel fiber rather than on the timing of the parallel-fiber activity. Thus, for values of ς that are large relative to the period of the sinusoidal stimulus, the learning mechanism fails to produce selective changes in the parallel fibers that increase their activity at different times in the vestibular stimulus, and there is less of a change in the gain of the VOR.

Predicted change in the gain of the VOR as a function of the width of tuning of the plasticity mechanism. Predictions for stimulus frequencies of 0.5, 2, 5, and 10 Hz are shown in separate plots. Responses of nine individual climbing fibers were used as the input to the nonsimultaneous plasticity mechanism (Eq. 10), with a fixed value for TPF-CF of 100 msec. Reduction in the weight of a parallel fiber was proportional to activity in that parallel fiber in an eligibility window centered 100 msec before a spike in the climbing fiber. Changes in the VOR predicted from the changes in parallel fiber weights are shown for eligibility windows of various widths, defined by values for ς of 0.001–1 sec (width of tuning). Open symbols, Predicted changes for the ×0 stimuli; filled symbols, predicted changes for the ×2 stimuli.
Behavioral studies have shown that ×0 and ×2 stimuli at a frequency of 5 Hz are approximately comparable in their effectiveness in inducing learning in the VOR as ×0 and ×2 stimuli at 2 Hz but that 10 Hz stimuli are considerably less effective at inducing learning than 5 Hz stimuli (Raymond and Lisberger, 1996). Figure 14 indicates that these results are consistent with the plasticity mechanisms for the VOR having ς = ∼25 msec, which is below values of ς at which predicted learning is significantly impaired for 5 Hz stimuli but above the values of ς that predict highly effective learning at 10 Hz. For ς = 25 msec, the width at half amplitude ofg(t) is ∼60 msec.
Insensitivity of predictions to features of the model
Our recording results indicate that a plasticity mechanism driven by simultaneous activity in climbing-fiber and vestibular parallel-fiber pathways cannot account for motor learning in the VOR. The simulation results in Figures 6-12 illustrate this point for the specific case in which vestibular parallel fibers exhibit sinusoidal modulation in their firing and a broad range of response phases, but the conclusion is not dependent on the particular form of the vestibular representation at the site of plasticity. Because Purkinje cell activity drives ipsiversive eye movement, a decrease in the amplitude of the VOR would require a decrease in the excitatory drive to Purkinje cells during contraversive head movement. This means decreasing the synaptic strength of whichever parallel fibers fire most vigorously during contraversive head movement, regardless of their specific firing rate profiles or how those responses are driven by various head movement parameters. During ×0 stimuli at 5 Hz, LTD driven by simultaneous climbing-fiber and parallel-fiber activity could not depress the parallel fibers active during contraversive head movement, because the climbing fibers were not active during contraversive head movement.
We confirmed that our fundamental conclusions were valid for other types of vestibular representation by running simulations in which the vestibular parallel fibers covered a more limited range of phases and clustered in two populations whose activity peaked near peak ipsiversive head velocity (V-i) and peak contraversive head velocity (V-c), and simulations in which the parallel fibers exhibited bursts of activity at different times in the head movement rather than sinusoidally modulated firing rates. Results for these simulations were similar to those in Figures 6-12.
We also want to emphasize that our analysis is not affected by the controversy that has existed about the sites of plasticity for motor learning in the VOR (Ito, 1993; Lisberger and Sejnowski, 1992). At present, there is general agreement that the cerebellar cortex is one likely site of plasticity (Ito 1993; Lisberger, 1994). However, disagreement remains about the direction of changes in vestibular sensitivity in the cerebellar cortex and about the contribution of plasticity in the vestibular nucleus to learning. Therefore, it is important to note that our analysis is independent of both the site and the direction of plasticity. Our computational analysis focused on plasticity in the cerebellar cortex. However, a similar analysis could apply to plasticity in the vestibular nucleus, based on the finding that climbing fiber collaterals may project to this brainstem region (Balaban et al., 1981). Furthermore, we focused on plasticity mechanisms for synaptic depression, but the same principles revealed by our computational analysis also hold for plasticity rules that assume other blends of decreases and/or increases in synaptic weights. Similar results were obtained for simulations that used a unidirectional LTD plasticity mechanism without threshold (Eq. 9), a unidirectional LTD plasticity mechanism with a threshold for parallel fiber activity (data not shown), or a bidirectional plasticity mechanism that produced LTD for climbing-fiber spikes associated with a high level of parallel-fiber activity and LTP for climbing-fiber spikes associated with a low level of parallel fiber activity (data not shown).
DISCUSSION
Previously, two mechanisms of motor learning in the VOR had been hypothesized. The first suggested that simultaneous activity in visual climbing fibers and vestibular parallel fibers would induce LTD in the cerebellar cortex that could mediate motor learning (Ito, 1972, 1982). The second suggested that coincident activity in vestibular inputs and Purkinje cell simple-spike inputs to floccular target neurons (FTNs) in the vestibular nuclei would mediate learning by guiding plasticity at that site (Miles and Lisberger, 1981). These hypotheses were based on observations of the neural signals present during low-frequency visual–vestibular stimuli that induced learned increases and decreases in the gain of the VOR. When we challenged the system with a broader range of stimulus frequencies, both hypotheses failed to account for learning. Our analysis suggests that either there is a single mechanism of learning driven by nonsimultaneous climbing-fiber and vestibular activity or there are multiple mechanisms of learning driven by different combinations of neural signals.
Is motor learning in the VOR mediated by a single mechanism driven by nonsimultaneous climbing-fiber and vestibular activity?
The climbing fiber recordings at high-stimulus frequencies (e.g., 5 Hz) reveal that a plasticity mechanism driven by simultaneous activity in climbing-fiber and vestibular parallel-fiber pathways cannot account for motor learning in the VOR. The simulations further demonstrate that a comparison of climbing-fiber spikes with the vestibular signals present ∼100 msec earlier contains the information required to guide learning. The question of how to implement a neural learning rule in the brain that compares events across time represents a general challenge in linking cellular and systems-level analyses of associative learning. Cellular studies have emphasized the importance of temporal coincidence, of either presynaptic and postsynaptic activity or of activity in two presynaptic inputs, in the induction of associative plasticity. The assumption has been that plasticity mechanisms that detect coincident neural activity would be useful for detecting events that are paired in time during associative learning. However, at the behavioral level, associative learning often involves the detection and comparison of events that are related in time but nonsimultaneous. For example, classical conditioning is most effectively induced when an unconditioned stimulus (e.g., an electric shock) follows a conditioned stimulus (e.g., a tone) by some nonzero interval.
Learning in the VOR is analogous to classical conditioning in that the pairing of two stimuli (head turns and visual image motion) results in learned changes in the eye movement response to one of the stimuli (head turns) (Raymond et al., 1996). Learning in the VOR is induced by simultaneous head turns and image motion. However, visual processing causes a delay of ∼100 msec between image motion on the retina and the representation of that motion in visual climbing-fiber activity at the site of plasticity (Stone and Lisberger, 1990). Thus, for both classical conditioning and motor learning in the VOR, a time interval between two nonsimultaneous events must be bridged to enable learning.
Models of classical conditioning have adopted two basic strategies for bridging the time interval between nonsimultaneous events. The first hypothesizes that circuit properties bridge the gap by delaying or filtering neural signals related to one of the events. During cerebellum-dependent classical conditioning of the eyelid response, for example, mossy-fiber activity related to the conditioned stimulus (tone) precedes climbing-fiber activity related to the unconditioned stimulus (shock). It has been suggested that granule–Golgi pathways in the cerebellum could delay and filter the mossy fiber signals so that the resultant parallel-fiber activity would coincide with the climbing-fiber activity (Fujita, 1982; Moore et al., 1986;Chapeau-Blondeau and Chauvet, 1991; Buonomano and Mauk, 1994). A cellular plasticity mechanism driven by simultaneous activity in climbing-fiber and parallel-fiber inputs could then mediate learning. A second hypothesis suggests that biochemical pathways bridge the gap between nonsimultaneous events. For example, parallel-fiber activity could cause the slow rise of a biochemical eligibility trace, such as the concentration of a second messenger or phosphorylation of a receptor, which in turn could determine the extent to which climbing-fiber activity induces plasticity (Klopf, 1989; Bullock et al., 1994; Fiala et al., 1996; Kettner et al., 1997). Peak eligibility would then follow peak parallel-fiber activity, causing the plasticity mechanism to be tuned to climbing-fiber activity that follows parallel-fiber activity by some amount of time.
One might expect that for the VOR, a nonzeroTPF-CF in Equations 9 and 10 could be implemented by either mechanism. However, we found that introducing a delay in the vestibular signals carried by parallel fibers did not work, because it delayed both the signals that guide plasticity and their contribution to motor output. In contrast, if the delayed representation of a stimulus used for the induction of plasticity is a biochemical eligibility trace produced by nondelayed parallel-fiber activity, then the timing of the learned behavior need not be delayed. This latter property is required to account for learning in the VOR induced by high-frequency stimuli.
The suggestion of an eligibility trace with a 100 msec delay is difficult to reconcile with most cellular studies, which have used electrical or pharmacological stimulation to study LTD in the cerebellar cortex. These generally have found that LTD is most effectively induced when climbing-fiber activity is simultaneous with or precedes parallel-fiber stimulation (Ito et al., 1982; Ekerot and Kano, 1985, 1989; Sakurai, 1987; Schreurs and Alkon, 1993; Lev-Ram et al., 1995, 1997). Even reports that depression can be induced in the cerebellar cortex when climbing-fiber stimulation follows parallel-fiber stimulation by 100–250 msec (Chen and Thompson, 1995;Shreurs and Alkon, 1996) cannot account for motor learning in the VOR. It is not sufficient for a 100 msec delay between vestibular and climbing-fiber activity to be effective at inducing plasticity. It must be the most effective input configuration for inducing plasticity; that is, it must induce the largest synaptic changes. A plasticity mechanism that produced the same synaptic changes in vestibular parallel-fiber inputs active 100 msec before climbing-fiber activity, as it did in vestibular parallel-fiber inputs whose activity coincided with activity in the climbing fiber, would fail to produce changes in the gain of the VOR during learning with ×0 and ×2 stimuli at 5 Hz. To produce the empirically observed learning in the VOR, tuning for the 100 msec interval between activity in vestibular and climbing-fiber inputs must be sharp enough to change the balance between the populations of vestibular inputs that fire at different times during the period of the vestibular stimulus. Specifically, to account for the ability of 10 Hz stimuli to induce some learning, a ς of < 25 msec was required (width at half-amplitude of ∼60 msec) (Fig. 14).
Our data do not necessitate the abandonment of cerebellar LTD as a putative cellular mechanism of learning in the VOR. However, our analysis highlights the importance of new experiments to determine whether LTD in the functioning cerebellum has temporal contingencies suitable for guiding learning in response to the natural patterns of input activity that are actually present during learning. Further experiments should also examine the possibility that plasticity in the vestibular nucleus might be regulated by climbing-fiber and vestibular inputs with the required temporal precision.
Is motor learning in the VOR mediated by multiple mechanisms driven by different combinations of neural signals?
If plasticity in the functioning cerebellum is tuned to simultaneous climbing-fiber and parallel-fiber activity, then there must exist at least two mechanisms for motor learning in the VOR that contribute differentially to learning induced by high- and low-frequency stimuli. The results in Figure 3 indicate that the correlation of vestibular and Purkinje cell simple-spike signals cannot account for the induction of learning by high-frequency stimuli but could contribute to learning during low-frequency stimuli. Likewise, the correlation of simple-spike and climbing-fiber signals cannot account for all learning but could make a contribution during high-frequency stimuli.
Several previous observations are consistent with the idea of multiple mechanisms of learning in the VOR. First, behavioral studies have suggested the existence of two components of learning in the VOR that are differentially induced by high- and low-frequency stimuli (Raymond and Lisberger, 1996). Second, different combinations of retinal image movement and eye movement signals are available during low- versus high-frequency stimuli (Raymond and Lisberger, 1997). During low-frequency stimuli, visual tracking mechanisms greatly reduce the amplitude of retinal image motion, and the eye movements during ×0 and ×2 stimuli are quite different (Fig. 1). During high-frequency stimuli, visual tracking mechanisms fail to reduce retinal image motion, and the eye movements are similar during ×0 and ×2 stimuli. Third, there is considerable evidence that plasticity occurs at both the cerebellar cortex and vestibular nucleus sites during motor learning in the VOR (Dufosse et al., 1978; Miles et al., 1980b;Watanabe, 1984; Lisberger and Pavelko, 1988; Lisberger, 1994; Lisberger et al., 1994b,c; Luebke and Robinson, 1994; Pastor et al., 1994;Partsalis et al., 1995), and it seems possible that different anatomical sites would use plasticity mechanisms that are driven by different combinations of neural signals. Finally, the complex-spike activity of most HGVPs was not modulated during ×0 or ×2 tracking of a small spot at 0.2 Hz (Miles et al., 1980a). This raises the possibility that climbing fibers may not be able to guide motor learning below a certain frequency range. To address this issue, it will be necessary to record complex-spike responses at low frequencies during ×0 and ×2 stimuli with a large visual stimulus like the one we used in the present study.
Together, these results raise the possibility that the mechanisms underlying learning during the low- and high-frequency stimuli may be different. Learning could be guided by the correlation of the vestibular input with either climbing-fiber activity or simple spikes in the Purkinje cells during low-frequency stimuli, and it could be guided by the correlation of climbing-fiber activity with either the vestibular input or Purkinje cell simple spikes during high-frequency stimuli. We are not suggesting that the brain analyzes the frequency of the vestibular stimulus and selects from a menu of available mechanisms. Rather, there may be multiple mechanisms that contribute differentially depending on the available neural signals. The use of multiple cellular mechanisms of plasticity and error signals may ensure that learning can be induced by stimuli with a wide range of temporal properties.
Footnotes
This work was supported by National Institutes of Health Grants EY10198, EY03878 (S.G.L.), and DC03342 (J.L.R.), and a National Aeronautics and Space Administration Research Associate Fellowship (J.L.R.). We thank members of the Lisberger and Sejnowski laboratories and D. Buonomano, H. Mahncke, and R. Venturini for many helpful comments on earlier drafts of this manuscript. We especially thank M. Kahlon for input throughout the writing process.
Correspondence should be addressed to Jennifer L. Raymond, Department of Physiology, Box 0444, University of California at San Francisco, San Francisco, CA 94143.


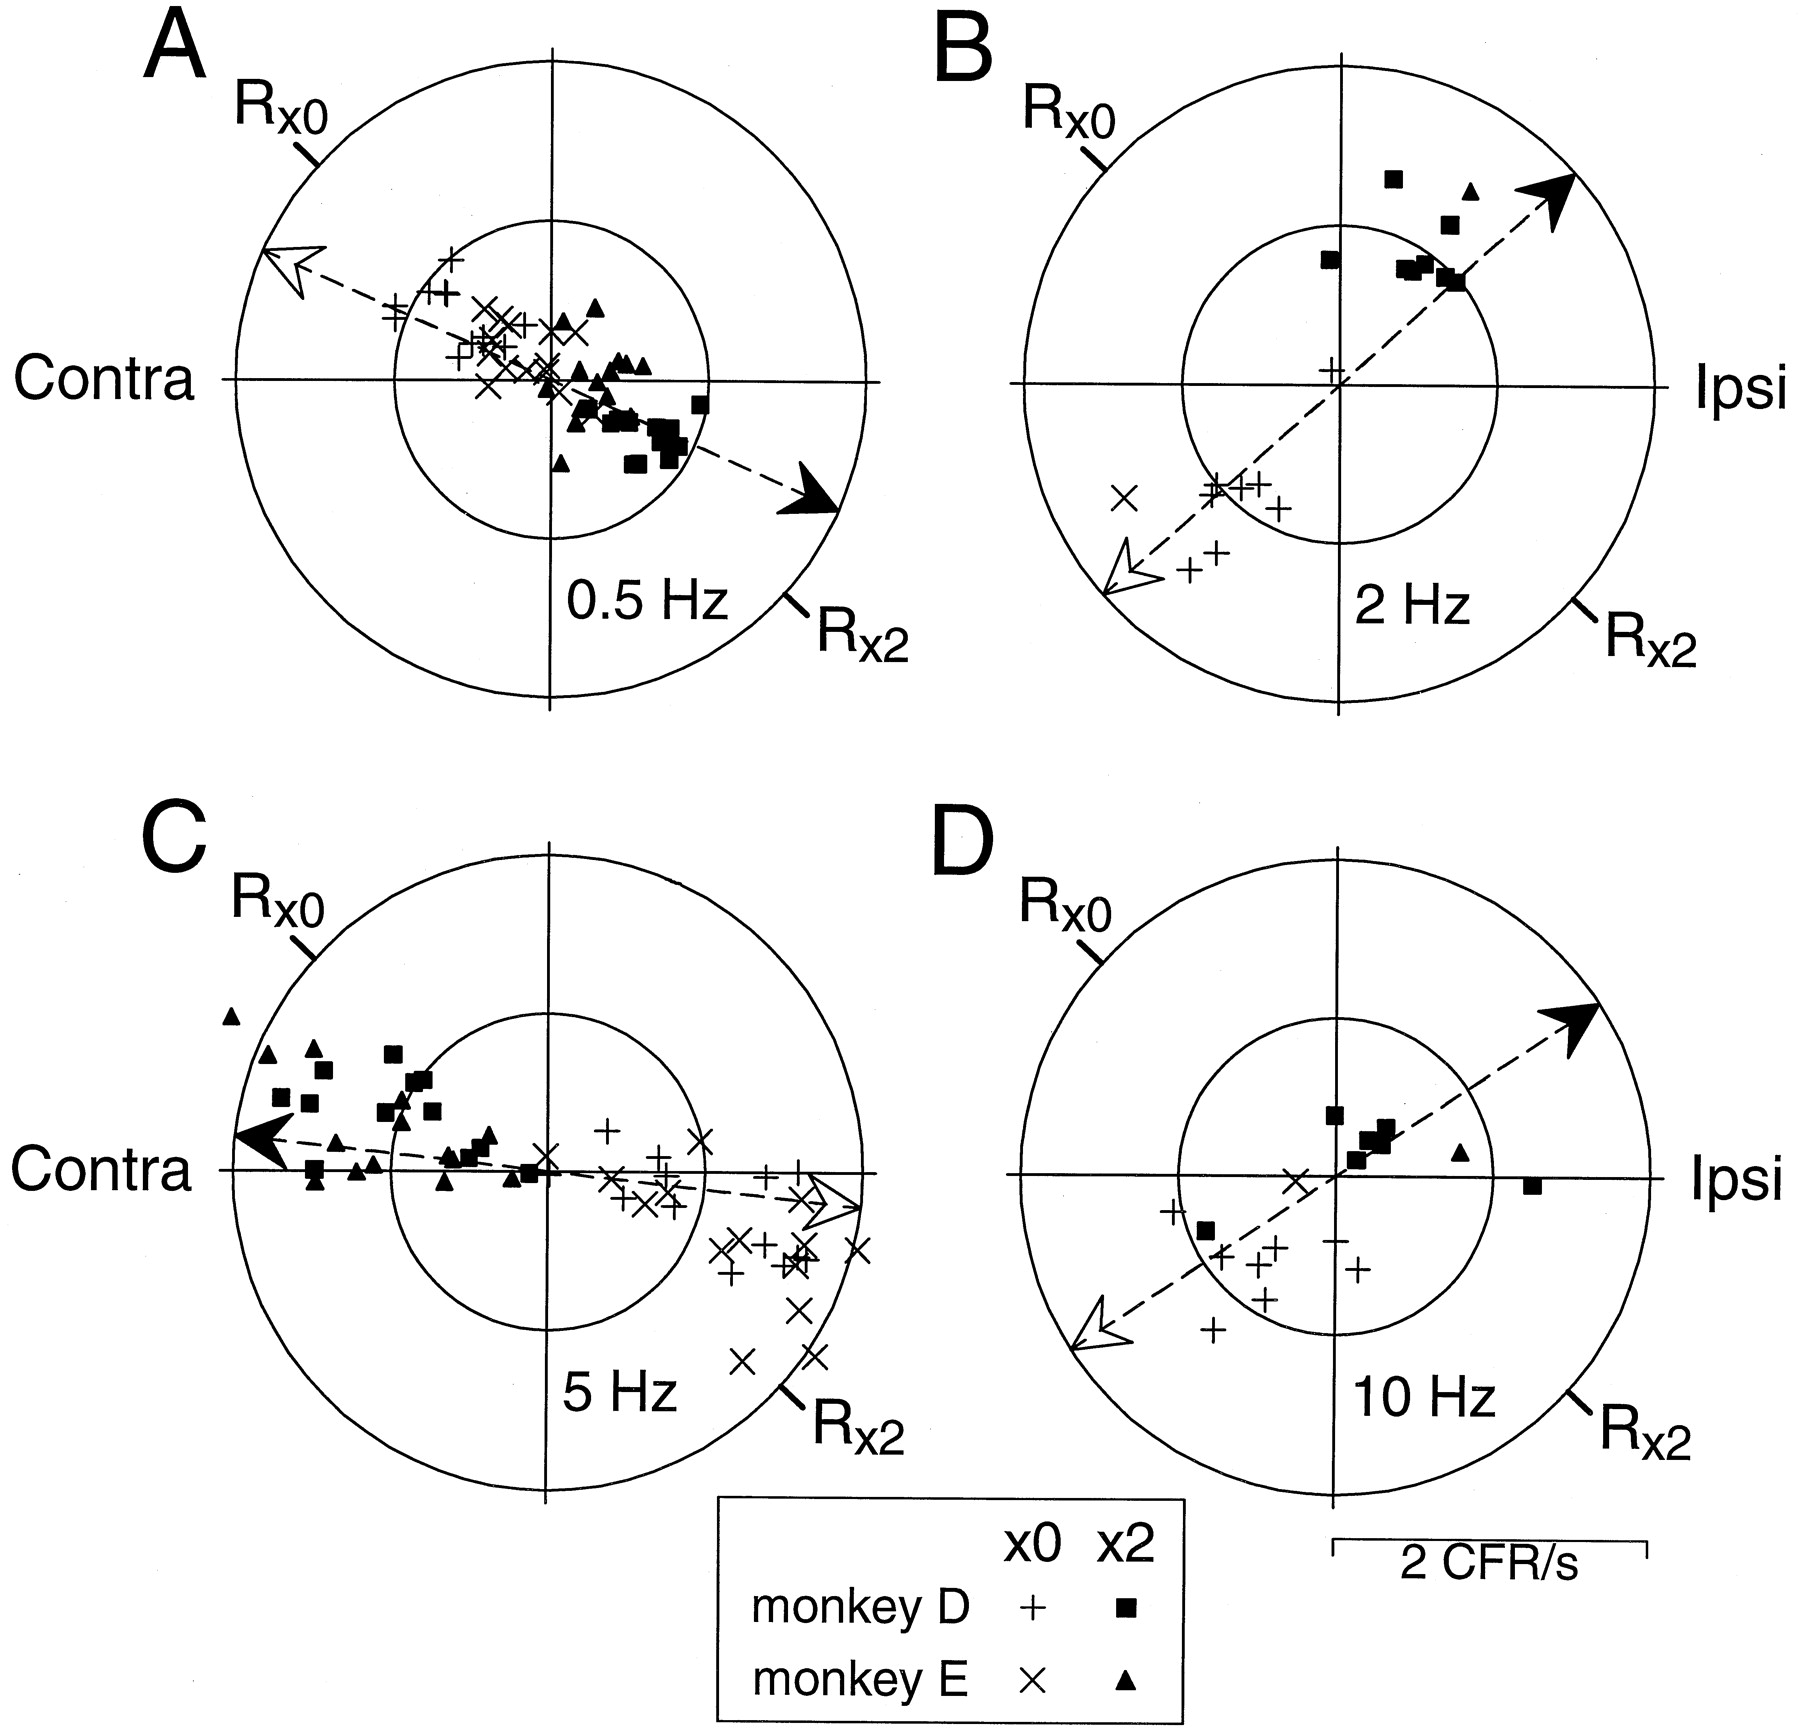