

Abstract
To understand the mechanism of pulsatile luteinizing hormone-releasing hormone (LHRH) release, we examined whether cultured LHRH neurons exhibit spontaneous intracellular Ca2+([Ca2+]i) signaling. The olfactory placode and the ventral migratory pathway of LHRH neurons from rhesus monkey embryos at embryonic ages 35–37 were dissected out and cultured on glass coverslips. Two to five weeks later, cultured cells were labeled with fura-2 and examined for [Ca2+]i signaling by recording changes in [Ca2+]i every 10 sec for 30–175 min. Cells were fixed and immunostained for LHRH and neuron-specific enolase. In 20 cultures, 572 LHRH-positive cells exhibited [Ca2+]i oscillations at an interpulse interval (IPI) of 8.2 ± 0.7 min and a duration of 88.8 ± 2.9 sec. LHRH-negative neurons in culture exhibited only occasional [Ca2+]i oscillations. In 17 of 20 cultures with LHRH-positive cells, [Ca2+]i oscillations occurred synchronously in 50–100% of the individual cells, whereas [Ca2+]i oscillations in cells in the remaining three cultures did not synchronize. Strikingly, in 12 of 17 cultures the synchronization of [Ca2+]i oscillations repeatedly occurred in complete unison at 52.8 ± 3.0 min intervals, which is similar to the period observed for LHRH release, whereas in 5 of 17 cultures the less tight synchronization of [Ca2+]i oscillations repeatedly occurred at 23.4 ± 4.6 min intervals. IPI of [Ca2+]i oscillations in cells with tight synchronization and less tight synchronization did not differ from IPI in cells without synchronization. The results indicate that LHRH neurons derived from the monkey olfactory placode possess an endogenous mechanism for synchronization of [Ca2+]i oscillations. Whether synchronization of [Ca2+]ioscillations relates to neurosecretion remains to be investigated.
- intracellular Ca2+ signaling
- intracellular Ca2+ oscillations
- synchronization
- LHRH neurons
- olfactory placode
- GnRH neurons
It has been well documented that the release of luteinizing hormone-releasing hormone (LHRH) and luteinizing hormone (LH) are both pulsatile (Dierschke et al., 1970; Carmel et al., 1976; Clarke and Cummins, 1982; Levine et al., 1982; Gearing and Terasawa, 1988; Moenter et al., 1990) and that changes in the pulsatile pattern of gonadotropins are important for gamete maturation, steroid hormone secretion, ovulation, maintenance of luteal function, and hence, the onset of puberty (Crowley et al., 1985; Hutchison et al., 1987; Knobil and Hotchkiss, 1988). However, the cellular mechanisms regulating pulsatile LHRH release are scarcely known. One of the most significant obstructions to progress in studying the cellular mechanism of the LHRH pulse-generating system is the fact that LHRH neurons are small in number (∼2000) and scattered widely over the preoptic area and the hypothalamus, intermingled with other neurons and neuroglia.
Recently, cell lines that express the rat LHRH gene and human LHRH gene promoter have been established (Mellon et al., 1990; Radovick et al., 1992) and made a significant contribution to our understanding of LHRH pulse generation (Tsai and Weiner, 1997). However, these cells are not primary LHRH neurons and are of mouse origin. Accordingly, we have established a primary cell culture system for LHRH neurons derived from the olfactory placode of the rhesus monkey at embryonic age 35–37 (E35–E37) (Terasawa et al., 1993). Because, in rhesus monkeys, LHRH neurons arise from the olfactory placode/pit, outside the brain, at an early age (E32–E37) during a relatively long period (168 d) of embryonic development (Ronnekleiv and Resko, 1990; Quanbeck et al., 1997), this culture system contains a large number of LHRH neurons and a relatively small number of non-LHRH neurons. Using a cell culture system derived from the olfactory placode of monkey embryos, we have previously shown that (1) LHRH cells release the decapeptide into media in a pulsatile manner at ∼50 min intervals and that (2) LHRH release requires depolarization stimuli followed by Ca2+entry through voltage-sensitive Ca2+ channels (Terasawa et al., 1999). However, because our culture contains a large number of non-neuronal cells such as fibroblasts and epithelial cells, as well as a relatively small number of non-LHRH neurons, the question of whether LHRH cells have an endogenous pulse-generating mechanism remains unanswered. Therefore, in the present study, we examined the behavior of individual LHRH cells in culture by monitoring intracellular Ca2+([Ca2+]i) signaling. Results suggest that individual LHRH cells exhibit [Ca2+]i oscillations, which synchronize at intervals of ∼50 min.
MATERIALS AND METHODS
Animals. Female rhesus monkeys were housed in cages in a room that had controlled lighting (12 hr light/dark) and temperature (22°C). They were fed Purina monkey chow once a day, supplemented with fruit and high-vitamin sandwiches. Water was available ad libitum. Sex-skin color changes and menstrual records were obtained on a daily basis.
A few days before maximum sex-skin color change, female rhesus monkeys were placed with a fertile male until the breakdown of sex-skin color. Pregnancy was determined by ultrasound examination and uterine palpation. The day of pregnancy was designated as day 0 of gestation (E0) based on the estimated day of the LH surge, which usually occurs 2 d before the breakdown of sex-skin color. The age of fetuses was determined by the sex-skin color record and the developmental characteristics of the fetuses, which were precisely described in a previous study (Quanbeck et al., 1997). Fetuses were delivered by Cesarean section under halothane anesthesia. A total of ten fetuses at E35–E37 were used in this study. All experiments presented in this manuscript were performed following the standards established by the Animal Welfare Act and the document entitled Principles for Use of Animals and Guide for the Care and Use of Laboratory Animals.The protocol for this study was reviewed and approved by the Animal Care and Use Committee, University of Wisconsin.
Tissue preparations and cultures. Before dissection of fetuses the crown–rump length was measured, the developmental characteristics were observed under a stereomicroscope, and the developmental stage was determined as described previously (Quanbeck et al., 1997). Two tissue areas from the fetuses were used for culture: (1) the nasal area, which included the olfactory pit (placode) and (2) the ventral migratory pathway, which included mostly the terminal nerve, but on occasion encroached on a small portion of the telencephalon, as described previously (Terasawa et al., 1993). These tissues were dissected out into chilled sterile imidazole-buffered L15 medium (Life Technologies, Grand Island, NY) using a stereomicroscope under a Plexiglass enclosure, very fine watchmakers’ forceps, a scalpel, and fine iris scissors. Tissues were then cut into very small pieces (<0.5 mm3), and two to three pieces of tissue were plated onto round (diameter, 25 mm) glass coverslips (no. 2; Fisher Scientific, Pittsburgh, PA). These coverslips were previously photoengraved with grids using the methods described by Lin and Ruddle (1981) and modified by Villalobos et al. (1998). Coverslips were also coated with a layer of dried rat-tail collagen and sterilized under a UV light before cell plating (Hawrot and Patterson, 1979). Cultures on coverslips were maintained in 35 mm tissue culture dishes (Corning, Corning, NY) containing medium 199 (Life Technologies) supplemented with 10% fetal bovine serum (HyClone, Logan, UT), 0.6% glucose, 75 μg/ml gentamicin, and incubated at 37°C with 1.5% CO2 and 98.5% O2 (Lillien and Claude, 1985). Medium was replaced every 3–4 d at the beginning of cultures and every 1–2 d after the cultures were established. Cultures were maintained up to 5 weeks, except for a few cases in which cultures were maintained for 7.5 weeks. The majority of the experiments were conducted after at least 2 weeks in culture, usually between 2 and 4 weeks. However, for comparison, we examined several cultures at 10–12 d in vitro. From one fetus, we were able to obtain 12–16 cultures from the olfactory placode and 6–8 cultures from the ventral migratory pathway.
Ca2+ imaging. Two to four weeks after the initiation of culture, cells were exposed to the Ca2+ indicator fura-2 AM (Texas Fluorescence Labs, Austin, TX) for 30 min in an incubator at 37°C. The dye was dissolved in 2 ml of either culture medium or a modified Krebs’–Ringer’s phosphate buffer (KRP; Terasawa, 1994) containing 0.05% BSA and 0.1% glucose, pH 7.4, with a 6 μl solution consisting of two parts dimethyl sulfoxide (Sigma, St. Louis, MO) and one part pluronic F-127 (BASF Corporation, Parsippany, NY) by weight. This results in a final concentration of 18 μm fura-2 AM. Cultured cells were washed with three rinses of culture medium. In most cases a coverslip with cells was mounted in a Dvorak–Stotler chamber. However, a small number of coverslips with cells were examined in Petri dishes. Fluorescence imaging of the dye-loaded cultured cells was achieved with a Zeiss inverted microscope with a 20× epifluorescence objective lens. Cultured cells were continuously perifused with either culture medium or KRP with 0.05% BSA and 0.1% glucose, pH 7.4, under 95% O2 and 5% CO2 at a rate of 50 μl/min. All experiments were conducted at room temperature (22–23°C). Under the microscope, a location containing LHRH neuron-like cells was chosen. LHRH cells were identifiable by their size, morphology, and unique appearance, forming neuronal bundles, as described previously (Terasawa et al., 1993). Approximately 30–130 cells, which included LHRH neurons, LHRH progenitor cells in the placode, non-neuronal cells, and in rare cases non-LHRH neurons were selected on each coverslip. Using a xenon lamp and a shutter wheel, cells were excited successively with 340 and 380 nm UV light (133 msec delay), and an emission fluorescence light of 510 nm was captured every 10 sec by a video camera (Hamamatsu Photonics, Hamamatsu, Japan) attached to the microscope. In a few cases, images were captured every 5 sec. The ratio of the emission from 340 nm excitation to 380 nm excitation in an average of 16 images, which is proportional to [Ca2+]i concentrations, was calculated by the computer program Metafluor Software (Universal Imaging Corporation, West Chester, PA). [Ca2+]i concentration was estimated using the equation described by Grynkiewicz et al. (1985) from the ratio image. The equation is [Ca2+]i =Kd{(R −Rmin)/(Rmax−R)}Sf2/Sb2, where R is the ratio of the light emitted when the dye is excited by the two excitation wavelengths, Rminand Rmax are the values of R at very low and high Ca2+ concentrations, respectively,Sf2 and Sb2 are intensities of free and bound fura-2 at 380 and 340, respectively, andKd is the effective dissociation constant of fura-2 under these particular experimental conditions.
Most of the data were obtained from cultures continuously monitored for 60–175 min, although in a few cultures conducted in the early stage of this study, we only acquired data for 30 min.
To examine if [Ca2+]i oscillations were caused by experimental conditions, we examined the [Ca2+]i oscillatory pattern while changing the perifusion speed to either a faster rate (1 ml/min) or a slower (2.5 μl/min) rate. Furthermore, in several cases we examined the cells directly in Petri dishes. Finally, to determine whether the culture age was important, we compared results between relatively young (2 weeks in vitro), and old (>7.5 weeks in vitro) cultures.
After the perifusion experiment, the recorded region was photographed, and the photoengraved grid location was determined for later histological analysis. Subsequently, cells were fixed with 2% paraformaldehyde, pH 7.6, and immunostained for LHRH and neuron-specific enolase (NSE).
Cell identification with immunocytochemistry. All cultures were immunostained after perifusion experiments as described previously (Terasawa et al., 1993). Cultured cells were gently rinsed with PBS and fixed with 2% paraformaldehyde in PBS for 30 min at room temperature. They were rinsed thoroughly with PBS and then were placed in 10% normal goat serum in PBS for 2 hr at room temperature. Cells were exposed to primary antibody for 48 hr at 4°C. For LHRH staining, the polyclonal antiserum LR-1, which primarily recognizes mammalian LHRH (a gift from Dr. Benoit, University of Montreal, Montreal, Canada) or GF6, which recognizes several forms of LHRH (a gift from Dr. Sherwood, University of British Victoria, Victoria, Canada) (see Quanbeck et al., 1997) was used at a dilution of 1:10,000 and 1:6000, respectively. Cultured cells were again rinsed thoroughly with PBS and incubated with biotinylated anti-rabbit IgG for 1.5 hr at room temperature. After rinsing in PBS, endogenous peroxidases were removed with a methanol/H2O2 solution, avidin–biotinylated peroxidase complex (Vector Laboratories, Burlingame, CA) in PBS was applied for 1.5 hr at room temperature, followed by rinses in Tris-buffered saline (TBS). For visualization of LHRH, 3,3′-diaminobenzidine and H2O2 in Tris buffer were applied. To stain neuron-specific protein, some cultures were further exposed to antibody against NSE (Incstar, Stillwater, MN) at a dilution of 1:1000. Double staining was accomplished using a similar procedure except for a different chromagen (Vector SG complex; Vector Laboratories). Coverslips with cultures were mounted on glass slides with glycerol jelly.
After immunostaining, the cell type of cultures examined for imaged Ca2+ signaling was determined with a microscope using the photoetched grids and/or photographs taken at the end of Ca2+ imaging as a guide.
Data analysis. All data were processed on Excel spread sheets, and intervals between Ca2+ oscillations, pulse duration (ascending phase plus descending phase), and pulse amplitude (difference between the baseline and the peak) were calculated for each cell. The ascending phase was defined as the period between the last point of the baseline and the peak, and the descending phase was defined as the period between the peak and the baseline. Group mean (± SEM) from all cells was calculated from individual data. Because LHRH neurons in young cultures (10–12 d in vitro) exhibited either no or infrequent [Ca2+]i oscillations, we excluded them from the data analysis.
We defined that a synchronization of [Ca2+]i oscillations occurred when the peak of [Ca2+]i was detectable within 20–60 sec in at least 50% of the recorded cells. Two types of synchronization were observed: tight synchronization (the peaks of [Ca2+]i oscillations occurred within 20 sec) and less tight synchronization (the peaks of [Ca2+]i oscillations occurred within 60 sec). The mean (± SEM) interval between synchronizations was calculated among the synchronized cases.
To examine whether the synchronization in a cell group was caused by the regularity of the oscillatory pattern, interpulse interval (IPI) histograms were made for representative cases, such as when two to four synchronizations were repeatedly observed (n = 3) and no obvious synchronization or only one synchronization during the 68–170 min of observation (n = 2).
Differences between groups were considered to be significant whenp < 0.05 using ANOVA followed by post hocanalysis with Student–Newman–Keuls’ test.
RESULTS
The pattern of [Ca2+]i signaling
The baseline concentrations of [Ca2+]i in LHRH cells (LHRH-immunopositive neurons and their progenitor cells) were 50–200 nm. The steady-state levels of [Ca2+]i were disrupted by a twofold to fivefold transient increase repeatedly, i.e., cultured LHRH cells exhibited an oscillatory pattern of [Ca2+]i increase. Individual cells within a culture showed a variety of the IPIs ranging from 1 to 35 min in [Ca2+]i oscillations, with the baseline level (50–200 nm), the amplitude (100–350 nm), and the pulse duration (40–240 sec) unique to each cell (Fig. 1). In general, patterns in individual cells could be classified into three categories: (1) a short ascending phase with a longer descending phase (39.4% ofn = 572 cells; Fig.2A,D), (2) the time course of the ascending phase and descending phase were similar, forming a symmetric appearance (29.5%; Fig.2B,E), and (3) a short ascending phase with a sustained plateau phase followed by a longer descending phase (8.8%; Fig. 2C,F). In all these groups [Ca2+]i oscillations were regular in some cells (Fig. 2A–C) and irregular in others (Fig. 2D–F). The remaining population (22.3%) exhibited a mixture of the three patterns and was not possible to classify. Overall, the mean (± SEM) IPI of [Ca2+]i oscillations was 8.2 ± 0.7 min (n = 572), the mean (± SEM) durations of the ascending and descending phases were 29.0 ± 1.4 and 58.9 ± 2.3 sec, respectively, and the pulse amplitude was 280 ± 10 nm. A few of the LHRH-positive neurons and all the LHRH-negative neurons (Fig. 3) rarely exhibited [Ca2+]i oscillations. The decrease in imaging interval from 10 to 5 sec did not alter the [Ca2+]i oscillatory pattern in LHRH cells or the [Ca2+]i signaling pattern in LHRH-negative neurons.
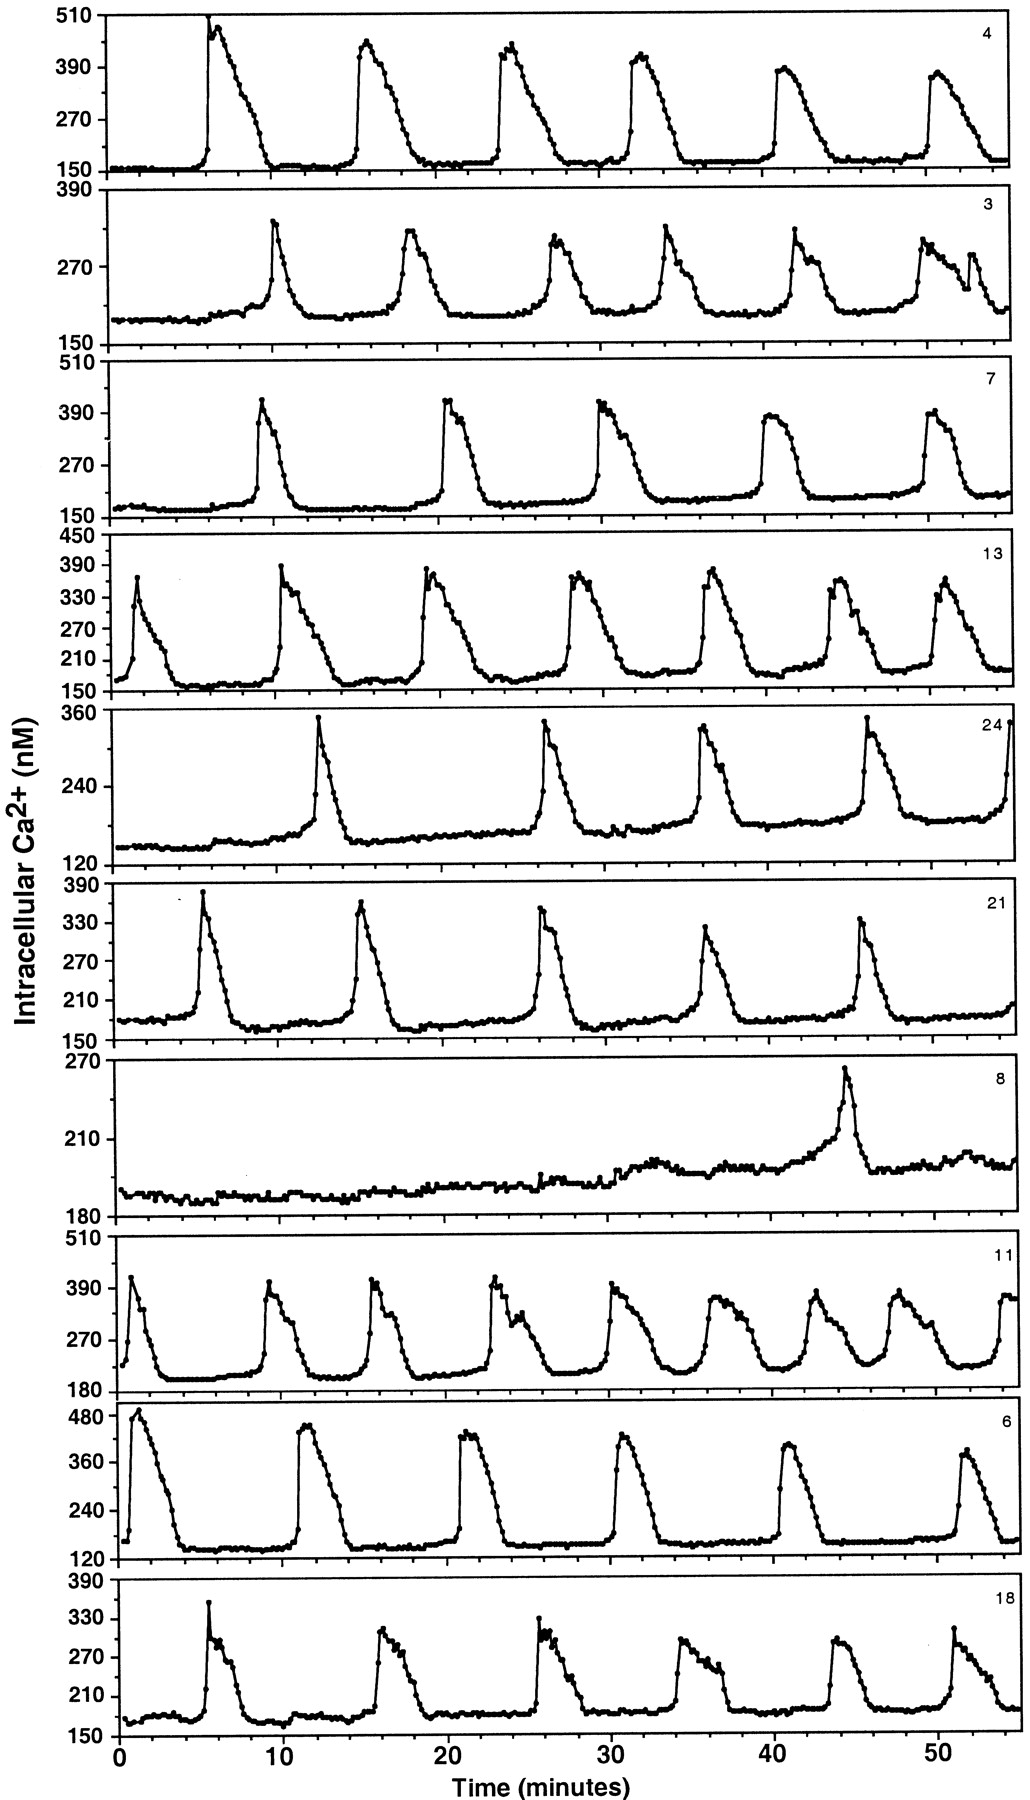
The pattern of [Ca2+]i oscillations in 10 cells from 24 LHRH cells recorded from one culture is shown. The data were acquired every 10 sec for the 55 min period. In general, the baseline [Ca2+]i levels ranged from 50 to 200 nm, and the peak levels were 170–510 nm. Note that all cells exhibited independent oscillatory patterns.
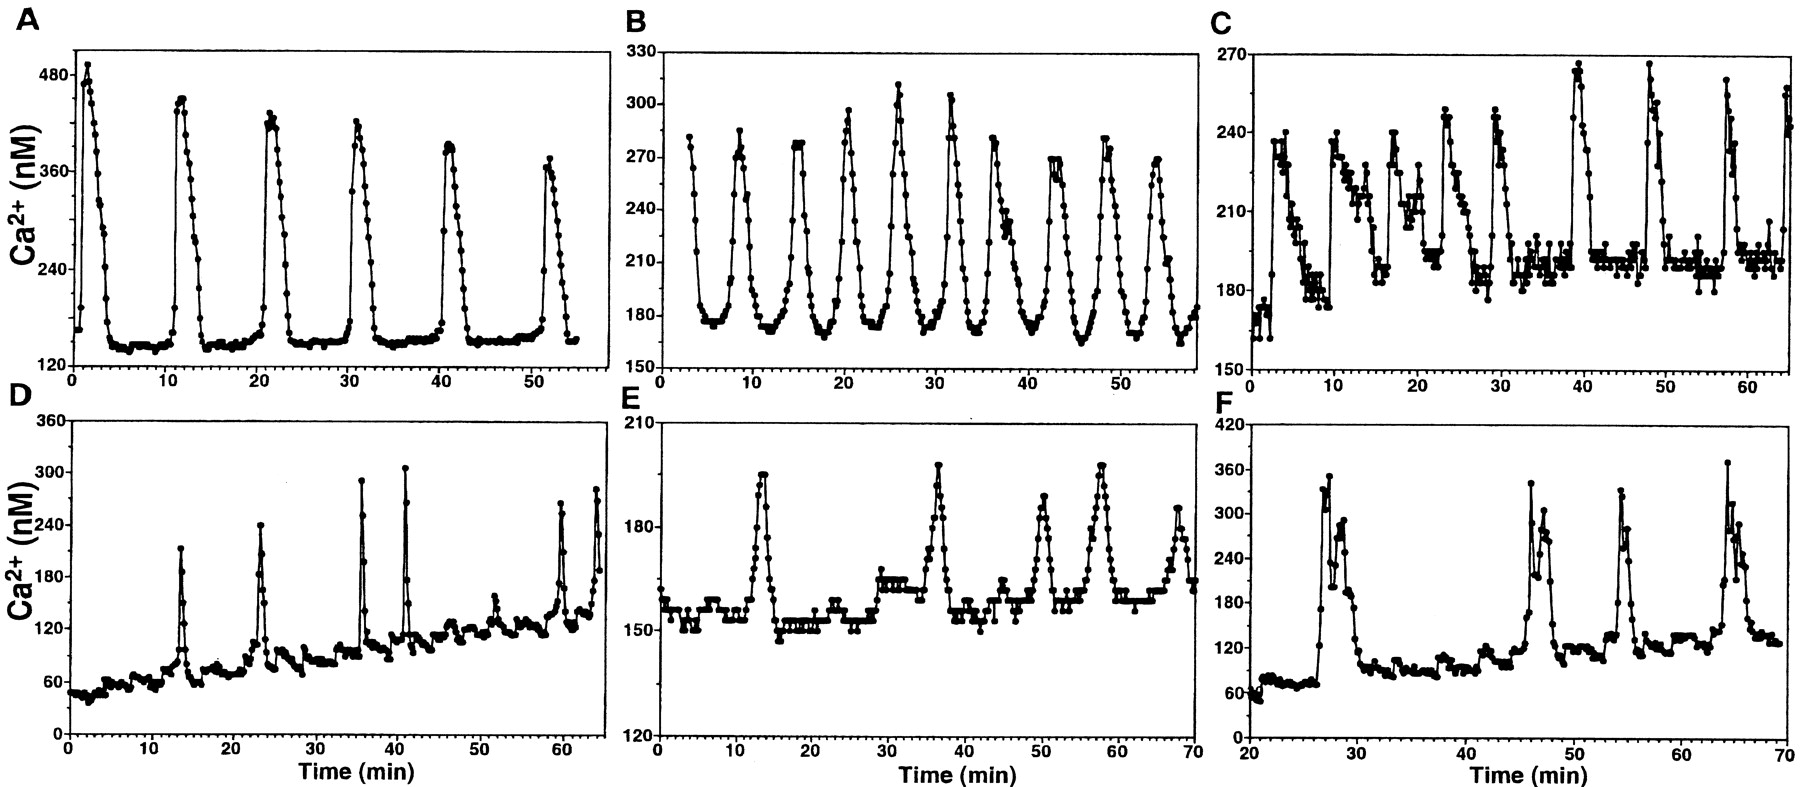
[Ca2+]ioscillations in LHRH neurons are classified into three patterns: (1) a short ascending phase with a longer descending phase (A,D), (2) the time course of the ascending phase and descending phase were similar, forming a symmetric appearance (B, E), and (3) a short ascending phase with a sustained plateau phase followed by a longer descending phase (C, F). Relatively regular oscillations and irregular oscillations are shown in thetop (A–C) andbottom (D–F) rows, respectively.

The pattern of [Ca2+]i in non-LHRH neurons. A Ca2+ image (380 nm excitation picture) of a neuronal network (A) and a ratio graph of these cells (B) are shown. In non-LHRH neurons, [Ca2+]i oscillations were rarely observed.
To examine if [Ca2+]i oscillations were caused by experimental conditions, we compared the [Ca2+]i oscillatory patterns in a culture perifused with the medium at a slow speed (2.5 μl/min), normal speed (50 μl/min), and fast speed (1000 μl/min). We also examined the cells kept in a Petri dish, in which no medium was exchanged for up to 30 min. Finally, we compared the differences in culture ages, i.e., 2–4 weeks in vitro and >7.5 weeksin vitro. These conditions did not alter the [Ca2+]i oscillatory pattern in LHRH cells, with the exception that cultures <2 weeks of age (10–12 din vitro) had little oscillatory activity.
Synchronization of [Ca2+]i oscillations
One of the most interesting characteristics of [Ca2+]i oscillations in olfactory placode cultures was synchronization involving a large number of cells. The synchronization started in a few cells and then spread into the adjacent areas (Fig. 4), showing the trend of a Ca2+ wave. The phenomenon of synchronization is clearly shown in Figure5A. In this case all 50 LHRH-like cells (100%) synchronized at 22, 81, and 142 min. The amplitude of [Ca2+]i oscillations at the synchronization was often, but not always, larger than the amplitude of normal [Ca2+]ioscillations, and the peak of synchronized [Ca2+]i increase was often, but not always, followed by a postexcitatory suppression (Figs.6, 7), although some cases did not follow these patterns. In one case, synchronization of [Ca2+]i occurred as doublets (Fig. 8).

An example of the synchronization of cells in an olfactory placode culture. Video images (ratio pattern) of cells at 0, 30, 70, 100, 110, 120, 140, 160 and 190 sec are shown. At 30 sec, [Ca2+]i signals in a few cells (bottom left corner) start to increase, at 70 and 100 sec more cells are recruited, reaching the peak at 110 sec. At 120 sec, the intensity of [Ca2+]i signals starts to decrease, although the number of cells involved is larger than at 110 sec. At 140–160 sec, [Ca2+]i signals are gradually returning to the baseline level seen at 190 sec. There is a trend for [Ca2+]i signals to move toward thetop right corner, as a [Ca2+]i wave, in this example. [Ca2+]i concentrations are expressed with a color scale: white, red,orange, yellow, green,blue, and purple from high to low concentrations, respectively. Because individual cells are not clearly seen on the video ratio images, cells were marked using the 380 nm excitation image.

An example of the synchronization of [Ca2+]i oscillations in 50 LHRH neuron-like cells for the period of 152 min (A). Each color represents the activity of an individual cell. Note that synchronization occurred at 22, 81, and 143 min after time 0, which gives 59 and 61 min intervals between synchronizations. The amplitude of the synchronized pulses is larger than normal pulses, and the postexcitatory suppressions are seen right after the synchronized pulse. The gradual decrease of signal is caused by photobleaching. Examples of tight (B) and less tight (C) synchronizations or no synchronization (D) are shown. Tight synchronization and less tight synchronization occurred at 22 and 9 min, respectively.

The individual pattern and synchronization of [Ca2+]i oscillations in 10 of 50 LHRH neuron-like cells from the culture demonstrated in Figure 4 are shown. The pulses regarded as a synchronization are marked byhorizontal lines. Note that synchronization occurred at 22, 81, and 143 min after time 0.

Another case of the individual pattern and synchronization of [Ca2+]ioscillations in 12 of 38 LHRH neuron-like cells. Note that synchronization occurred at 6, 47, and 90 min after time 0, which is at 41 and 43 min intervals.

The case where synchronization of [Ca2+]i oscillations occurred as doublets. Twelve of 70 recorded LHRH neuron-like cells are shown. Two synchronized pulses occurred 3–11 min apart, but the interval between the doublet pulses was 53–73 min.
In 17 of 20 cultures (85%) analyzed, the peak of [Ca2+]i oscillations occurred within 20–60 sec, with the interval of the synchronization ranging from 20 to 75 min. In the remaining three cultures (15%), no obvious synchronization was observed (Fig. 5D). In 12 of 17 cultures in which synchronization was observed, tight synchronization (Fig.5B) occurred at the interval of 52.8 ± 3.0 min, whereas in 5 of 17 cultures less tight synchronization (Fig.5C) occurred at the interval of 23.4 ± 4.6 min. The IPI (8.2 ± 0.8 min) of cells that exhibited synchronization of [Ca2+]i oscillations did not differ from the IPI (8.5 ± 0.4 min) of cells that did not exhibit any obvious synchronization (Table 1). Similarly, the IPI (7.8 ± 0.7 min) of cells that exhibited tight synchronization did not differ from the IPI (9.2 ± 1.0 min) of cells that exhibited less tight synchronization (Table 1).
The interpulse interval of synchronized cells versus non-synchronized cells
Detailed analysis of video pictures with corresponding immunocytochemistry indicated that synchronized cells were not only LHRH neurons and LHRH progenitor cells, but were also non-LHRH cells, the nature of which remains to be identified.
Frequency histogram of the interpulse interval
It is possible that the cultures that exhibited synchronization of [Ca2+]i oscillations may have a different frequency distribution from the cultures that did not exhibit synchronization. Therefore, frequency histograms for representative cases with or without synchronization were plotted. As seen in Figure9, regardless of the status of the synchronization, all cases had a Pareto long-tailed distribution.

Frequency histograms for the IPI of [Ca2+]i oscillations in cultures in which three synchronizations were observed (A), and two to three synchronizations were observed (B). In C, a frequency histogram for the IPI of [Ca2+]i oscillations in a culture, in which no synchronization was observed, is shown.
Histological correlation of [Ca2+]i signaling
After the [Ca2+]i signaling experiment, cultures were immunostained to identify cell type. LHRH neurons (Fig. 10), other cell types, and LHRH progenitor cells in the placode (data not shown) were intensely labeled with fura-2, exhibited [Ca2+]i oscillations, and all these cells participated in synchronization. LHRH-positive cells usually grew on the top of fibroblasts, but fibroblasts rarely exhibited [Ca2+]i oscillations. The LHRH-like neurons on the fiber tracts and progenitor cells in the placode were immunopositive for both LHRH and NSE. Although during Ca2+ imaging, the data from all LHRH-like neurons with similar shape and size aligned on fiber bundles were obtained, some neurons were not found after immunocytochemistry (Fig. 10). These missing cells on the fiber tracts indicated that long hours of Ca2+ imaging followed by immunocytochemistry were harsh to these cells, resulting in detachment and/or cell death. There were non-LHRH cells, which did not have any neuronal appearance but exhibited [Ca2+]i oscillations. These cells were immunonegative with both LHRH and NSE, whereas non-LHRH neurons such as shown in Figure 4 were NSE-positive but LHRH-negative.

Correlation between a video image of [Ca2+]i signaling (left) and LHRH cells immunostained with the GF-6 antibody (right) is shown. LHRH neurons seen in the Ca2+ image labeled with fura-2 are also immunopositive. Note that some LHRH neurons appeared to be lost during staining procedures.
DISCUSSION
The present study demonstrates that (1) LHRH cells derived from the olfactory placode/pit exhibit [Ca2+]i oscillations at a frequency unique to individual cells (an average of 8 min intervals) and (2) [Ca2+]i oscillations in a population of LHRH cells synchronize at an interval of ∼50 min.
There are significant differences between primate LHRH cells and other neurons, including GT1 cells. The IPI of [Ca2+]i oscillations at ∼8 min and the duration of ∼90 sec in LHRH neurons are much slower than those in GT1 cells and other neurons, in which [Ca2+]i oscillates at 3–120 sec with a duration of 3–20 sec (Charles and Hales, 1995; Feller et al., 1996;Leinekugel et al., 1997). Furthermore, although the synchronization of [Ca2+]i oscillations similar to that of LHRH neurons has been reported in GT1 cells (Costantin and Charles, 1997), immature cortical neurons (Owens and Kriegstein, 1998), and hippocampal pyramidal neurons (Leinekugel et al., 1997), the synchronization interval of 50 min in primate LHRH cells is again much longer than that (15–60 sec) reported in other neuronal systems (Charles et al., 1996; Owens and Kriegstein, 1998). Acquiring images at intervals of 5 sec did not alter the pattern of [Ca2+]i oscillations, suggesting that the slower time course is either characteristic of LHRH neurons in placode cultures or of the primate model. It may be informative, if time resolution is improved, to acquire the data as fast as every 2 sec or shorter, however, currently our system has technical limitations in this aspect.
There is concern whether [Ca2+]ioscillations in LHRH cells are characteristics of immature neurons and therefore not relevant to neurosecretion. This concern arises from the observation that (1) [Ca2+]ioscillations and/or propagation of the Ca2+ wave have been shown in association with cell division (Owens and Kriegstein, 1998), cell differentiation (Spitzer et al., 1995), neuronal plasticity to establish ocular dominance (Feller et al., 1996), and growth cone movement (Komuro and Rakic, 1998, Takei et al., 1998); (2) LHRH cells from E11.5 mouse embryo cultures (6–14 din vitro) responded to GABAA receptor stimulation with depolarization (Kusano et al., 1995), as was seen in hippocampal pyramidal neurons from neonatal rats (Ben-Ari et al., 1997), and to GABA through GABAA receptors with inhibition of migration (Fueshko et al., 1998); and (3) GT1 cells responded to GABA through GABAA receptors with depolarization (Hales et al., 1994) or stimulated release of LHRH (Farvit et al., 1993; Martinez de la Escalera et al., 1994) because GT1 cells are apparently not fully mature.
Certainly, LHRH neurons in this study may not be comparable to those in the adult hypothalamus. Nonetheless, we will discuss the degree of maturity in these neurons in vitro, because they were derived from the embryonic olfactory placode. There is little evidence indicating that LHRH neurons derived from the monkey olfactory placode are immature neurons. First, our studies suggest that LHRH neurons do not appear to divide or differentiate in vitro, because the number of LHRH-immunopositive cells in culture does not change as long as cells are obtained from embryos at E35–E36 (Terasawa et al., 1993), and the addition of the antimitotic agent fluorodeoxyuridine to placode cultures does not alter the number of LHRH-immunopositive cells (our unpublished observations). Second, before experiments we grew LHRH cells in culture for 2–4 weeks, yielding the equivalent agein vivo of 50–65 d, in which LHRH neurons would have migrated into the hypothalamus (Quanbeck et al., 1997). In various neuronal systems, it has been shown that in vitro age is parallel to in vivo age (Obrietan and van den Pol, 1995; Xie and Ziskind-Conhaim, 1995). Third, the olfactory placode from E35–E36 embryos is functional by 5 weeks. Our study indicates that transplantation of the olfactory placode from E35–E36 embryos into the adult hypothalamus, whose LHRH neurosecretory system has been lesioned, causes a resumption of ovulatory cycles as early as 5 weeks after transplantation (Saitoh et al., 1995). Fourth, a preliminary experiment suggests that GABA is inhibitory, but not excitatory, to [Ca2+]i oscillations in our LHRH cells. Nonetheless, the progenitor cells also exhibited [Ca2+]i oscillations, indicating that we cannot completely exclude the possibility that LHRH neurons in our experimental model are immature. Alternatively, oscillatory behavior of [Ca2+]i oscillations is intrinsic to LHRH neurons from a very early developmental age.
A line of evidence indicates that LHRH neurons have an endogenous pulse-generating mechanism. First, GT1 cells release LHRH in a pulsatile manner with IPIs of ∼22–30 min (Krsmanovic et al., 1992;Martinez de la Escalera et al., 1992; Wetsel et al., 1992). LHRH neurons isolated from the adult male rat brain release LHRH at ∼19 min intervals (Melrose et al., 1987). These IPIs are similar to those reported for LH pulses in rats and mice (Steiner et al., 1982; Kokoris et al., 1988), but are different from those in primates (Knobil, 1980). Second, we have shown that cultured LHRH neurons from monkey embryos at E35–E37 released the decapeptide in a pulsatile manner with an IPI of ∼50 min (Terasawa et al., 1999), which is very similar to that in adult monkeys in vivo (Knobil, 1980; Gearing and Terasawa, 1988; Woller et al., 1992). Third, electrophysiological studies in LHRH neurons from the terminal nerve in adult fish (Oka and Matsushima, 1993), from the mouse embryonic olfactory placode (Kusano et al., 1995), and in GT1 cells (Bosma, 1993; Charles and Hales, 1995) indicate that LHRH cells exhibit spontaneous oscillatory action potentials. Whether these oscillatory action potentials are related to LHRH neurosecretion is unknown. Finally, we observed that individual LHRH cells not only exhibited spontaneous [Ca2+]i oscillations with their own rhythm, but also synchronized at an interval of ∼50 min, which is again similar to that of LHRH release in vitro (Terasawa et al., 1999) and in vivo (Gearing and Terasawa, 1988). Furthermore, a preliminary study (Fernandez et al., 1998) shows that the oscillatory pattern of [Ca2+]i was stimulated by high K+ and the Na+channel opener veratridine, whereas low extracellular Ca2+, the Ca2+ chelator EGTA, as well as the L-type Ca2+ channel blocker nifedipine, suppressed [Ca2+]i oscillations in a manner similar to that observed for LHRH release (Terasawa et al., 1999). Therefore, it is hypothesized that each [Ca2+]i oscillation in LHRH neurons is accompanied by neurosecretion. This hypothesis is supported by the observations that [Ca2+]i oscillations are associated with insulin secretion in pancreatic β-cells (Bergsten et al., 1994; Pralong et al., 1994) and with vesicular exocytosis in LHRH-stimulated gonadotropes (Tse and Hille, 1992; Tse et al., 1993).
The mechanism of the synchronization of [Ca2+]i oscillations involved in more than a dozen cells is currently unknown, and communication between individual LHRH neurons is limited to speculation. GT1 cells can release LHRH synchronously by communication through synapses, gap junctions, electrical couplings (Wetsel et al., 1992; Matesic et al., 1993), or diffusible substances (Martinez de la Escalera et al., 1992). Because in GT1 cells an increase in [Ca2+]i is preceded by a barrage of action potentials (Costantin and Charles, 1997), there may be electrical coupling. Furthermore, the presence of synapses and dye-coupling between GT1 cells has been reported (Wetsel et al., 1992), and connexin 26, a protein associated with gap junctions, was found in GT1 cells (Krsmanovic et al., 1993). Because LHRH neurons in our cultures are mostly found in association with neuronal bundles, communication through synapses is quite probable. Moreover, the observation that GT1 cells (Martinez de la Escalera et al., 1992) or LHRH cells grown on two separate coverslips enclosed within one chamber release LHRH with distinct, presumably synchronized, pulses (Terasawa et al., 1999) indicates that cells may communicate with diffusible substances such as LHRH itself and/or nitric oxide (NO). It has been reported that changes in the extracellular concentration of LHRHin vitro determines the pulse frequency of LHRH release in GT1 cells (Krsmanovic et al., 1993) and that NO synthase mRNA is present in GT1 cells (Mahachoklertwuttana et al., 1994). Our cultures contained cells immunopositive to connexin 32, another protein associated with gap junctions (our unpublished observations). Nonetheless, the mechanism of the LHRH neuronal network communication requires further study.
[Ca2+]i oscillations and synchronization of [Ca2+]ioscillations occur not only in LHRH neurons, but also LHRH progenitor cells and a group of non-LHRH cells, the nature of which remains to be determined. The non-LHRH cells in our cultures are not fibroblasts or glial cells, because our cultures contain no glial cells (Terasawa et al., 1993), and fibroblasts exhibited very few [Ca2+]i oscillations. Non-LHRH cells that exhibited [Ca2+]i oscillations were round in shape and uniform in size and did not have a neuronal appearance. Furthermore, LHRH neurons in young cultures (10–12 din vitro) exhibited infrequent [Ca2+]i oscillations. A question then arises as to why progenitor cells and mature LHRH neurons exhibit [Ca2+]i oscillations, whereas young neurons do not. Apparently not all GT1 cells exhibit [Ca2+]i oscillations (Charles and Hales, 1995). Because GT1 cells express cDNA coding SV40 T-antigen, it is conceivable that a culture contains various cells at different stages of the cell cycle. Undoubtedly, the degree of maturation of the LHRH neurons is important for [Ca2+]ioscillations. Nonetheless, the fact that synchronization of [Ca2+]i oscillations occurs not only in LHRH neurons, but also LHRH progenitor cells and a group of non-LHRH cells, can be interpreted that even though the synchronization of [Ca2+]i oscillations does not directly relate to neurosecretion per se, the property of synchronization in the olfactory placode at 50 min intervals is involved in entraining the LHRH neurons before they arrive at their final position in the hypothalamus.
In summary, in the present study, we have shown that LHRH neurons derived from the embryonic nasal region exhibit an oscillatory pattern of [Ca2+]i concentrations, which synchronizes at ∼50 min intervals. It is hypothesized that each [Ca2+]i oscillation is associated with LHRH neurosecretion and that synchronization of [Ca2+]i oscillations in these LHRH cells is related to pulsatile LHRH release.
Footnotes
This study (publication number 38–33 from the Wisconsin Regional Primate Research Center) was supported by National Institutes of Health Grants HD15433, HD11355, and RR00167 to E.T. We thank Dennis Mohr for his technical assistance, Drs. Carol Emerson and Christine O’Rourke for their veterinary services, and Dr. David Fernandez for his comments on this manuscript.
Correspondence should be addressed to Dr. Ei Terasawa, Wisconsin Regional Primate Research Center, 1223 Capitol Court, Madison, WI 53715-1299.


