

Abstract
The C-terminal domain of NMDA receptor 2 (NR2) subunits has been proposed to play a critical role in regulating NMDA receptor localization and function in postsynaptic densities. However, the mechanism of this regulation is not completely understood. In this paper we show that C-terminal truncation of NR2A and NR2C subunits in mice (NR2A/CΔC/ΔC) impairs synaptic transmission and plasticity at the cerebellar mossy fiber–granule cell relay. Activation of synaptic NMDA receptors could be distinguished from that of extrasynaptic receptors by using the glutamate scavenger glutamate pyruvate transaminase and the open channel blocker MK801. NR2A/CΔC/ΔC mice exhibited a specific reduction in synaptic NMDA receptor activation attributable to a severalfold decrease in channel open probability but not channel conductance. Immunodetection revealed normal developmental expression of NR subunit proteins. Quantitative immunogold analyses with an antibody to NR1 indicated that the reduction in receptor activation is not attributed to a reduced number of NR1-containing receptors in postsynaptic densities. Thus, NR2A/NR2C subunits and particularly their C termini regulate synaptic NMDA receptor activation and function by enhancing channel open probability, which is critical for long-term potentiation induction.
NMDA receptors (NRs) are crucial in regulating synaptic excitation and plasticity at glutamatergic synapses, and their activation is related to learning and memory, brain development, and degeneration (Bliss and Collingridge, 1993). NMDA receptors are formed by different NR1 (ζ) and NR2 (ε) subunits (Dingledine et al., 1999), whose neuron- and age-specific incorporation (Monyer et al., 1994) determines diverse regulatory properties. The interaction of NR2 subunit C-terminals with proteins in the postsynaptic density (PSD) is thought to affect NMDA receptor function. First, in addition to NR1 binding through α-actinin to actin, NR2 C-terminal binding to PSD may favor NMDA receptor clustering in postsynaptic specializations (Takumi et al., 1999; Nusser, 2000;Scannevin and Huganir, 2000). Second, after Ca2+ influx through NMDA channels and activation of PSD-associated Ca2+-sensitive enzymes (including protein kinases, phosphatases, and nitric oxide synthase), NR2 C-terminal phosphorylation may regulate NMDA channel gating (Kim and Huganir, 1999). This mechanism is thought to play an important role in the induction of long-term potentiation (LTP; Tezuka et al., 1999; Gardoni et al., 2001; Huang et al., 2001; Lan et al., 2001). The functional importance of NR2 C termini has been highlighted by investigations in mice bearing NR2 C-terminally truncated subunits (Mori et al., 1998;Sprengel et al., 1998; Steigerwald et al., 2000). These mice showed altered NMDA receptor-dependent neurotransmission and plasticity at hippocampal synapses. Nonetheless, the mechanisms that enable NR2 C termini to regulate NMDA receptor functions need to be clarified.
Because mice with truncation of NR2A and NR2C C termini (NR2A/CΔC/ΔC mice; Sprengel et al., 1998), as well as NR2A/C knock-out mice (Kadotani et al., 1996), have altered motor coordination of potential cerebellar origin, we have investigated the consequences of the NR2A/CΔC/ΔC mutation at the cerebellar mossy fiber–granule cell relay. This mediates the most important glutamatergic input to the cerebellum and shows NMDA receptor-dependent synaptic transmission and plasticity (D'Angelo et al., 1995, 1999; Armano et al., 2000; Hansel et al., 2001). NMDA channel properties and NMDA receptor-dependent synaptic currents have been intensely investigated in granule cells (Rossi and Slater, 1993;Farrant et al., 1994; Clark et al., 1996; Ebralidze et al., 1996;Takahashi et al., 1996) (for review, see Cull-Candy et al., 1998). The developmental profile of NR2 subunits is characterized by a precisely timed switch from NR2B to NR2A/NR2C (Monyer et al., 1994), causing distinctive changes in single-channel and synaptic currents (Farrant et al., 1994; Rumbaugh and Vicini, 1999; Cathala et al., 2000).
Here we show that in NR2A/CΔC/ΔC mice, there was a marked NMDA EPSC reduction, and LTP was impaired. By investigating the effects of the open channel blocker MK801 (Hessler et al., 1993; Rosenmund et al., 1995; Chavis and Westbrook, 2001; Tovar and Westbrook, 2002) and the scavenger glutamate-pyruvate transaminase (GPT; Rossi and Slater, 1993; Overstreet et al., 1999; Turecek and Trussel, 2000), we have found that the NMDA EPSC reduction was explained by reduced open probability in synaptic NMDA receptors. Conversely, immunogold electron microscopy, immunoblotting, and single-channel recordings showed normal NMDA receptor density in PSDs, subunit composition, and elementary conductance. These results indicate that NR2 C termini play an important role in regulating synaptic transmission and plasticity by controlling synaptic NMDA receptor open probability.
MATERIALS AND METHODS
Whole-cell patch-clamp recordings, immunogold electron microscopy, and Western blotting were performed in the cerebellum of C57BL-6J mice (wild type) and in mice lacking the intracellular domain of NR2A and NR2C NMDA receptor subunits (NR2A/CΔC/ΔC; Sprengel et al., 1998). Measurements were performed at postnatal day 20 (P20; 20 ± 1 d after birth), except for developmental controls reported in Figure 3, which were performed at P10 (10 ± 1 d after birth). Both wild-type and NR2A/CΔC/ΔC mice were grown in the same animal facility and were genotyped at the end of the experiments.
Electrophysiological recordings. Whole-cell patch-clamp recordings were performed from granule cells in acute cerebellar slices as reported previously (D'Angelo et al., 1999). Briefly, the mice were anesthetized with halothane (Aldrich, Milwaukee, WI) and killed by decapitation. Acute 250-μm-thick slices were cut in the sagittal plane from the cerebellar vermis in cold Krebs' solution and maintained at room temperature before being transferred to a 1.5 ml recording chamber mounted on the stage of an upright microscope (Axioscope FS2; Zeiss, Thornwood, NY). The preparations were superfused with Krebs' solution and maintained at 30°C with a Peltier feedback device (HCC-100A; Dagan Corp., Minneapolis, MN).
The Krebs' solution for slice cutting and recovery contained (in mm): 120 NaCl, 2 KCl, 1.2 MgSO4, 26 NaHCO3, 1.2 KH2PO4, 2 CaCl2, and 11 glucose and was equilibrated with 95% O2 and 5% CO2, pH 7.4. For recordings, Krebs' solution was added with the GABA-A receptor antagonist 10 μm bicuculline (Tocris Cookson, Bristol, UK). When Mg2+ was omitted, atomic absorption measurements showed that the actual Mg2+ concentration in the perfusate was <10 μm (virtual Mg2+-free solution). Local perfusion through a multibarrel pipette was used to apply various solutions to the preparation. Local perfusion with Krebs' solution and 10 μm bicuculline was commenced before seal formation and was maintained until switching to the test solutions. The drugs were diluted to their final concentration in Krebs' solution and 10 μm bicuculline before use. The patch–clamp pipette solution contained (in mm): 81 Cs2SO4, 2 KCl, 1.2 MgSO4, 0.02 CaCl2, 0.1 BAPTA, 10 glucose, 3 ATP-Mg, 0.001 GTP, and 15 HEPES, pH adjusted to 7.2 with CsOH. Bicuculline was obtained from Sigma (St. Louis, MO), and BAPTA tetrapotassium salt was from Molecular Probes (Eugene, OR). The glutamate receptor antagonists d-2-amino-5-phosphonovaleric acid (APV), 7-Cl-kynurenic acid (7-Cl-Kyn), and 6-cyano-7-nitroquinoxaline-2,3-dione (CNQX) were obtained from Tocris Cookson. (1S,2S)-1-(4-Hydroxyphenyl)-2-(4-hydroxy-4-phenylpiperidino)-1-propanol (CP-101–606) was kindly provided by Dr. Edward Pagani (Pfizer, Groton, CT). Stock solutions were prepared for all drugs and stored frozen at −20°C.
Electrical signals were recorded with an Axopatch 200-A amplifier [−3 dB; cutoff frequency (fc) = 5 kHz], sampled with a Digidata-1200 interface, and analyzed off-line with pClamp software (Axon Instruments). Membrane potential was measured relative to an Ag-AgCl reference electrode (Clark Instruments, Pangbourne, UK). Mossy fibers were stimulated with a bipolar tungsten electrode via a stimulus isolation unit. EPSCs were elicited at 0.1 Hz, and passive granule cell parameters were monitored throughout the recordings (Table1). In LTP experiments, after a 10 min control period, either eight bursts of 10 impulses at 100 Hz or 16 bursts of 10 impulses at 200 Hz were repeated every 250 msec [theta burst stimulation (TBS)]. During TBS, membrane potential was stepped from −70 to −30 mV. In some experiments, EPSCs were measured at different holding potentials to investigate their voltage dependence. In LTP experiments, sojourns at +60 mV lasted <1 min every 4 min at −70 mV (D'Angelo et al., 1999). Episodic EPSC acquisition (1 sec tracing, 50 μsec/point for fast and 250 μsec/point for slow EPSC components) was usually alternated with continuous acquisition of interleaved spontaneous activity (subsequent 9 sec tracing, 25 μsec/point), comprising spontaneous synaptic currents and channel openings.
Cerebellar granule cell passive properties in wild-type and NR2A/CΔC/ΔC mice
EPSC peak amplitude and EPSC amplitude 25 msec after stimulation (average of 20 contiguous data points) were taken to measure the non-NMDA and NMDA current amplitude. RT10–90was defined as the time needed for the EPSC to rise from 10 to 90% of peak amplitude, and HW was defined as the time needed to decay to 50% of peak amplitude. A quantitative estimate of NMDA channel gating was obtained by fitting the correspondingI–V relationships to the Woodhull equation:
 Equation 1where gmax is the maximum conductance, Vrev is the current reversal potential, [Mg2+] is the extracellular Mg2+ concentration,KD(0) is the Mg2+ dissociation constant at 0 mV, δ is the proportion of the electric field at the Mg2+ binding site, and Fz/RT is the molar energy content (Chen and Huang, 1994; Kuner and Schoepfer, 1996; Kirson and Yaari, 2000). The driving force calculated by using the reversal potential derived from Equation 1 was used to estimate the NMDA conductance of EPSCs, spontaneous synaptic currents (minis), and single NMDA channels (see below). NMDA EPSC kinetics were measured at +60 mV in the presence of 10 μm CNQX. Current decay was fitted with a double-exponential function of the formy(t) = A1exp−t/τ1 +A2exp−t/τ2. The weighted decay time constant (Rumbaugh and Vicini, 1999) was estimated as:
 Equation 2Spontaneous synaptic currents were measured at –70 mV, filtered at 3 kHz, scanned by a homemade program performing automatic threshold detection (threshold was usually adjusted to six times the baseline noise SD) and baseline adjustment, and stored for off-line analysis with standard pClamp routines.
NMDA channel openings were analyzed in 9 sec tracings recorded at –70 mV in Mg2+-free solution (Rossi and Slater, 1993; Clark et al., 1996; Ebralidze et al., 1996) and digitally filtered to the final fc of 0.95 kHz (−3 dB). After visual inspection to exclude spontaneous synaptic currents or noisy events, channel transitions were automatically detected by setting a threshold between −2 and −3pA and a minimum open time of 0.2 msec (Fetchan;Axon Instruments). These settings allowed NMDA channel openings of >30 pS to be detected (Farrant et al., 1994; Clark et al., 1996), but smaller openings were overlooked (cf. Ebralidze et al., 1996). Channel amplitude distributions were fitted with the linear combination of one or two weighted Gaussian functions. A similar procedure was used to measure single NMDA channel openings between 100 and 400 msec after the EPSC peak. Single-channel conductance was estimated by assuming a reversal potential of –10 mV (Fig. 1B). Because the number of channels contributing to the response could not be determined, cluster analysis was not performed.
Results are reported as mean ± SD. Statistical comparisons were done using Student's t test (a difference was considered not significant at p > 0.05).
Western blot analysis. Cerebellar tissue homogenates were prepared from wild-type and NR2A/CΔC/ΔC mice both at P10 and P20 (three brains per genotype and age) as described previously (Steigerwald et al., 2000). Ten micrograms of each protein sample, determined by a BCA kit (Pierce, Rockford, IL), were separated on either 7 or 10% SDS-PAGE (Laemmli, 1970) and transferred onto nitrocellulose (n = 3). The blotted proteins were probed with the following primary antibodies: rabbit polyclonal, C-terminal splice variant specific (C2 cassette) anti-NR1, 1:800 (Chemicon International, Temecula CA); mouse monoclonal, C-terminal pan anti-NR1, 1:500 (PharMingen, San Diego, CA); affinity-purified rabbit antiserum, N-terminal anti-NR2A, 1:1000 (Steigerwald et al., 2000); mouse monoclonal, C-terminal anti-NR2B, 1:1000 (1B3.3B6; Roche Molecular Biochemicals, Mannheim, Germany); rabbit polyclonal, N-terminal anti-NR2C, 1:200 (Research Biochemicals, Natick, MA); and β-actin mouse monoclonal clone AC-15 ascites, 1:20,000 (Sigma). C-terminal C2 cassette anti-NR1 detected lower NR1 protein levels at P20 than at P10 (see Fig. 3A), and the pan NR1 antibody detected similar NR1 protein levels at P10 and P20 (e.g., in wild-type tissue; data not shown), indicating the developmental increase in NR1 containing the C2′ cassette in relation to C2 in cerebellar tissue (Laurie and Seeburg, 1994; Prybylowski and Wolfe, 2000). The secondary antibodies were peroxidase-coupled anti-rabbit or anti-mouse IgG (Jackson ImmunoResearch, West Grove, PA). The enhanced chemiluminescence method (ECL Plus; Amersham Biosciences, Buckinghamshire, UK) was used to detect the blotted proteins.
Immunogold electron microscopy. Postembedding immunogold cytochemistry was performed on four wild-type and two NR2A/CΔC/ΔC mice (age P20). The animals were deeply anesthetized by intraperitoneal injection of Equithesin (0.5 ml/100 gm body weight) and transcardially perfused with a mixture of 4% paraformaldehyde and 0.1% glutaraldehyde in phosphate buffer. Small specimens from the cerebellum were subjected to freeze–substitution and low-temperature embedding in Lowicryl HM 20 (Matsubara et al., 1996). Ultrathin sections (∼70 nm) were mounted on adhesive-coated (Coat Quick G; Daido Sangyo Co. Ltd.) nickel grids (500 mesh) and processed for immunogold cytochemistry (Takumi et al., 1999). In brief, sections were immersed in a saturated solution of NaOH in absolute ethanol for 1–2 sec and incubated at room temperature first for 10 min in 50 mm glycine and 5 mm Tris buffer containing 0.3% NaCl and 0.1% Triton X-100 (TBST), followed by incubation in 2% human serum albumin (HSA) in TBST and then overnight in TBST solution containing 2% HSA and C-terminal C2 cassette anti-NR1 (kindly provided by Dr. R. J. Wenthold, National Institutes of Health, Bethesda, MD) (Petralia et al., 1994). The final concentration was 2 μg/ml. Thereafter, sections were placed in 2% HSA in TBST for 10 min and finally in goat anti-rabbit Fab fragments coupled to 10 nm gold particles (GFAR10; British BioCell International, Cardiff, UK) diluted 1:20 in TBST containing 2% HSA and polyethylene glycol (0.5 mg/ml) for 2 hr.
To determine the percentage of labeled synaptic profiles at the mossy fiber→granule cell synapses in the cerebellar glomeruli, the grid squares were systematically analyzed in the electron microscope. Every asymmetric synapse was examined, but only those profiles that appeared cut vertically, with clearly visible presynaptic and postsynaptic membranes, were photographed. When the profile was slightly oblique with respect to the axis of microscope, the grid was tilted until the synaptic cleft reached a maximum width. The photographs were recorded with a CCD camera mounted on a Philips CM 10 transmission electron microscope and coupled to a personal computer. A modified (Nagelhus et al., 1999) commercially available imaging analysis program (AnalySIS; Soft Imaging Software Gmbh, Münster, Germany) was used for recording and analyzing the photographs. A gold particle was considered associated with a specific profile when it was located within 35 nm of the postsynaptic membrane. Membrane segments of interest were drawn on an overlay and assigned a type label. Gold particles in the neighborhood of each membrane segment were detected semiautomatically, and the program calculated the distance between the center of gravity of each particle and the membrane segment. All images, with associated segments, particles, and measurements, were saved to allow later verification and correction. The data were obtained from single sections incubated at the same time to ensure identical labeling conditions and did not involve serially reconstructed synapses.
RESULTS
Smaller and slower NMDA synaptic currents in NR2A/CΔC/ΔC cerebellar granule cells
Synaptic transmission and plasticity at the mossy fiber–granule cell relay were investigated by whole-cell patch-clamp recordings from granule cells in acute cerebellar slices obtained from P20 mice with NR2A and NR2C C-terminal truncation (NR2A/CΔC/ΔC; Sprengel et al., 1998). In voltage-clamp recordings, granule cells from NR2A/CΔC/ΔC and wild-type mice showed similar passive properties, i.e., input capacity and resistance (Table1). The small cell size and low resting membrane permeability allowed high-frequency resolution of synaptic currents (Table 1; Silver et al., 1996; D'Angelo et al., 1999). Figure1A shows representative EPSCs recorded in the presence of 1.2 mmMg2+ in P20 mice. Both in wild-type (n = 6) and NR2A/CΔC/ΔC mice (n = 7), EPSCs showed a fast non-NMDA and a slow NMDA component.
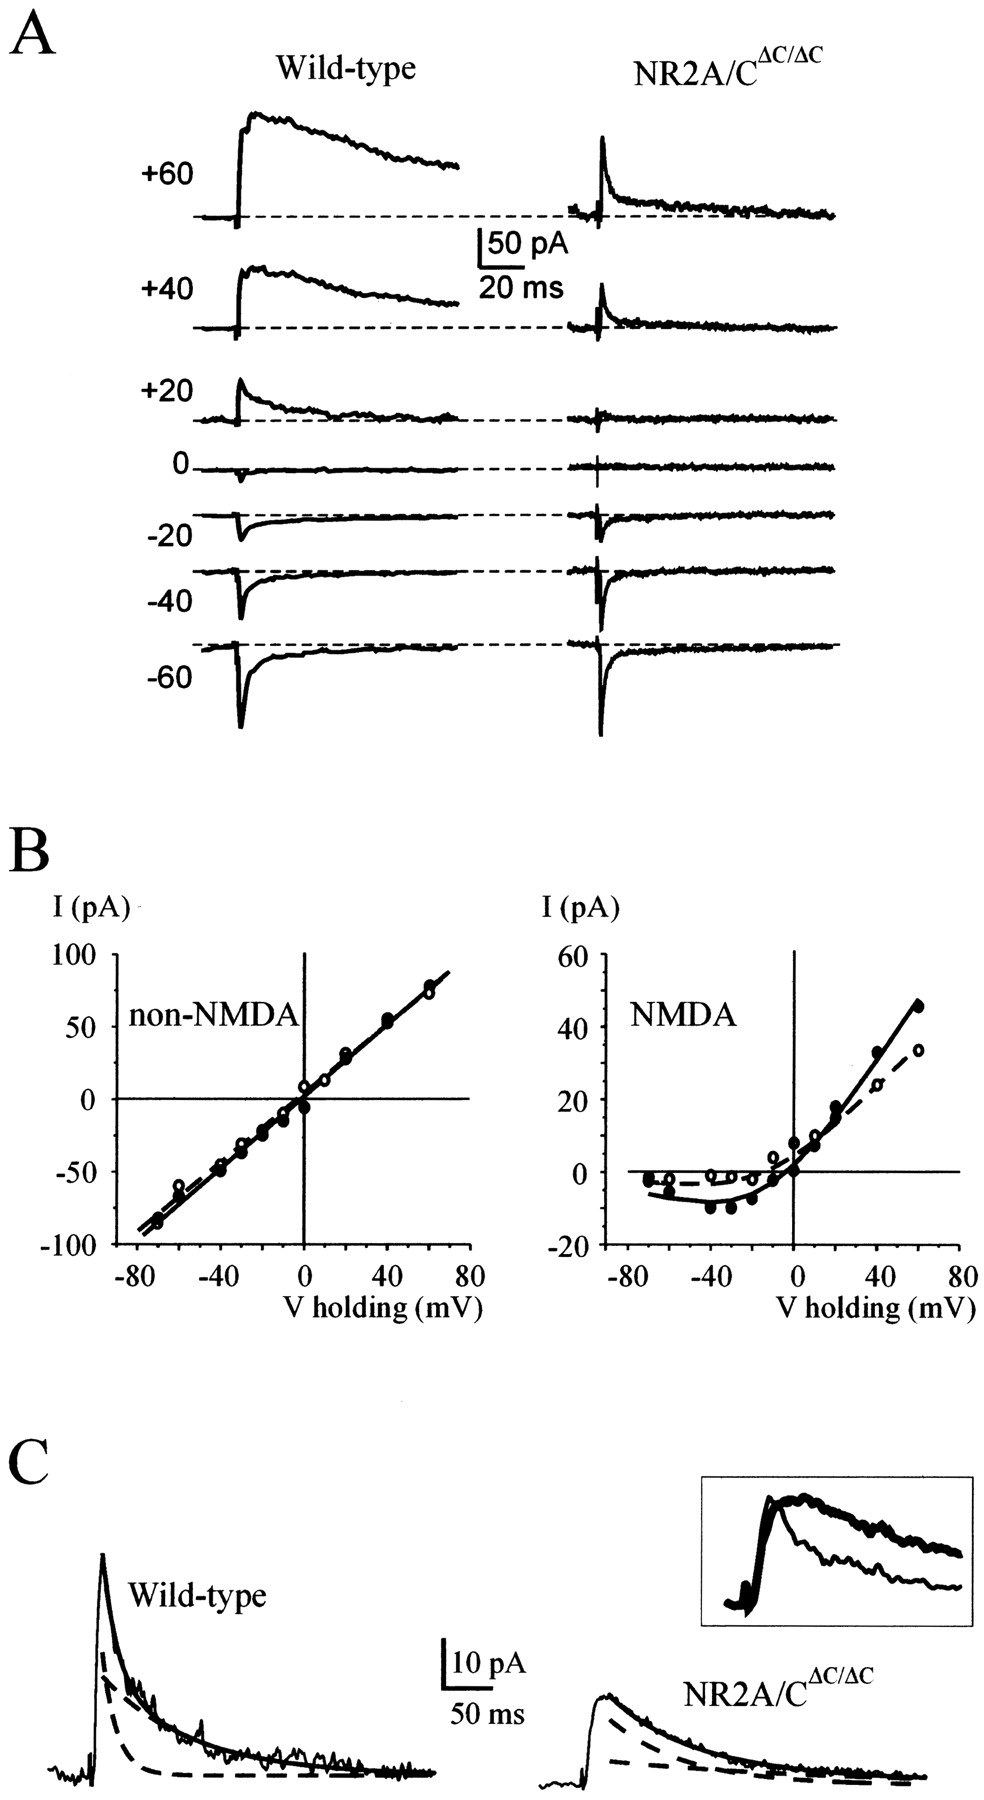
NMDA and non-NMDA receptor-dependent EPSCs. EPSCs were recorded with extracellular solutions containing 1.2 mm Mg2+. In this and following figures, except otherwise stated, recordings were performed from P20 ± 1 mice. A, EPSCs recorded at different holding potentials. Despite similar non-NMDA currents, the NMDA current is smaller in NR2A/CΔC/ΔC than in wild-type EPSCs.B, I–V relationship for non-NMDA and NMDA current components of EPSCs recorded from NR2A/CΔC/ΔC (open circles;n = 7) and wild-type mice (filled circles; n = 6). SDs ranged from ±3 to ±14 pA (data not shown). I–V relationships of non-NMDA currents are fitted with a straight line;I–V relationships of NMDA currents are fitted with Equation 1 (for details, see Materials and Methods).C, NMDA EPSC kinetics at +60 mV after application of 10 μm CNQX (averaging of 5 EPSCs). Biexponential fittings to EPSC decay were obtained by the equationy(t) =A1exp−t/τ1 +A2exp−t/τ2 (solid line; individual exponential components are shown asbroken lines). Wild-type:A1 = 24.8 pA;A2 = 20 pA; τ1 = 15 msec; τ2 = 93.1 msec. NR2A/CΔC/ΔC:A1 = 22.5 pA;A2 = 8.1 pA; τ1 = 77.6 msec; τ2 = 247.9 msec. Inset, Peak–scaled tracings on an expanded time scale (thick line, NR2A/CΔC/ΔC; thin line, wild-type recordings).
The non-NMDA EPSC component (Fig. 1A–C) showed a similar amplitude in NR2A/CΔC/ΔC as in wild-type mice, and linear fittings to the average non-NMDA EPSCI–V relationships (obtained from six wild-type and seven NR2A/CΔC/ΔC recordings) yielded a similar maximum conductance (1191 vs 1239 pS) and reversal potential (−3.9 vs −1.9 mV).
The NMDA EPSC component, whose size was estimated 25 msec after mossy fiber stimulation, was smaller in NR2A/CΔC/ΔC than in wild-type mice (Fig. 1A–C). NMDA current voltage dependence was investigated by fitting the average NMDA EPSC I–Vrelationships with Equation 1 (Fig. 1B; see Materials and Methods). The fittings yielded similar values for the Mg2+ dissociation constant at 0 mV (KD(0), 2 vs 2.3 mm) and for the proportion of electric field at the Mg2+ binding site (δ, 0.99 vs 0.99). KD(0) and δ values were close to those reported previously for NMDA receptors (Chen and Huang, 1994; Kuner and Schoepfer, 1996; Kirson and Yaari, 2000), ruling out noticeable changes in voltage-dependent Mg2+ blocking. The NMDAVrev was also similar (–11.6 vs –9.6 mV). However, maximum conductance was lower in NR2A/CΔC/ΔC than in wild-type mice (gmax, 410 vs 790 pS). After normalization for the non-NMDA peak, the NMDA conductance was reduced by 47%.
The non-NMDA EPSC component showed similar kinetics in NR2A/CΔC/ΔC as in wild-type mice (Fig.2A,B). However, in the same recordings, NMDA EPSCs (isolated by 30 μmCNQX application) were slower in NR2A/CΔC/ΔC compared with wild-type mice (Fig. 1C; also see Fig. 8). This change was significant in decaying (Eq. 2; τw = 120.8 ± 33.6 vs 87.8 ± 38.1 msec; n = 16 and 13;p < 0.02) but not in rising kinetics (RT10–90 = 11.7 ± 3.5 vs 7.7 ± 2.7 msec; n = 16 and 13; p< 0.09).

Paired pulse stimulation and minis.A, Paired pulse stimulation (100 Hz) in NR2A/CΔC/ΔC and wild-type mice.B, Minis (average of 35 events from the cells in Fig.1A) recorded in NR2A/CΔC/ΔC and wild-type mice. Note the almost identical time course of NR2A/CΔC/ΔC and wild-type non-NMDA currents. Average EPSCs values wereRT10–90 = 0.65 ± 0.1 msec (n = 20) versus 0.55 ± 0.07 msec (n = 21); and HW = 2.6 ± 0.4 msec (n = 20) versus 2.3 ± 0.2 msec (n = 21). Average mini values wereRT10–90 = 0.32 ± 0.06 msec (n = 20) versus 0.29 ± 0.02 msec (n = 21); and HW = 1.01 ± 0.05 msec (n = 20) versus 0.9 ± 0.05 msec (n = 21).
These results indicate a specific alteration in NMDA EPSC amplitude and kinetics with intact non-NMDA synaptic currents. After normalization for the non-NMDA peak and correction for slower kinetics, which lead to overestimation of the current at 25 msec, the NMDA conductance reduction in NR2A/CΔC/ΔCwas 68%.
Similar neurotransmitter release
Potential alterations in neurotransmitter release were investigated by three series of measurements on the non-NMDA current of composite EPSCs at –70 mV. First, we measured the response to paired pulse stimulation with a 10 msec interval between the first and second pulses (Fig. 2A; Schultz, 1997). The paired pulse ratio was similar in NR2A/CΔC/ΔC and wild-type mice (0.53 ± 0.08 vs 0.56 ± 0.12; n = 8 in both cases). Second, we recorded minis (Fig. 2B), which reflect spontaneous release of neurotransmitter quanta. Minis showed a similar size [−13.7 ± 4.3 pA (n = 23) vs −14 ± 4.8 pA (n = 21)] and frequency [0.27 ± 0.08 Hz (n = 23) vs 0.2 ± 0.02 Hz (n = 21)] in NR2A/CΔC/ΔC and wild-type mice (also see Table 1). Finally, we estimated the EPSC coefficient of variation (CV; SD/mean), which is altered by changes in release probability. However, CV was almost identical in NR2A/CΔC/ΔC as in wild-type mice (0.25 ± 0.03 vs 0.26 ± 0.04; n = 14 in both cases). These results indicate that release probability was unaltered in NR2A/CΔC/ΔC mice.
Normal developmental expression of NMDA receptor subunits
The functional alterations of NMDA receptor-dependent synaptic transmission and plasticity could be attributable to (1) an abnormal NR2 subunit composition, (2) a reduced number or abnormal expression pattern of NMDA receptors, (3) a reduced elementary conductance, (4) a reduced channel open probability, or (5) a combination of these factors.
NMDA receptor properties are developmentally regulated through incorporation of different NR2 subunits. Western blot analyses of cerebellar homogenates (Fig.3A) showed similar expression of NR1 in homozygous NR2A/CΔC/ΔC and wild-type mice. The lower expression of NR1 at P20 in both genotypes reflects the developmental increase in the C2′ cassette in relation to C2 (see Materials and Methods). The expression pattern of the truncated NR2A and NR2C proteins was also comparable with the pattern of full-length proteins in wild-type mice. For both genotypes, expression of NR2A and NR2C was higher at P20 than at P10, but NR2B was more intensely expressed at P10 than at P20. Thus, in NR2A/CΔC/ΔC as in wild-type mice, NMDA receptors of cerebellar granule cells changed their subunit composition postnatally, showing a switch from NR2B to NR2A and NR2C (Farrant et al., 1994; Monyer et al., 1994; Takahashi et al., 1996; Rumbaugh and Vicini, 1999; Cathala et al., 2000).
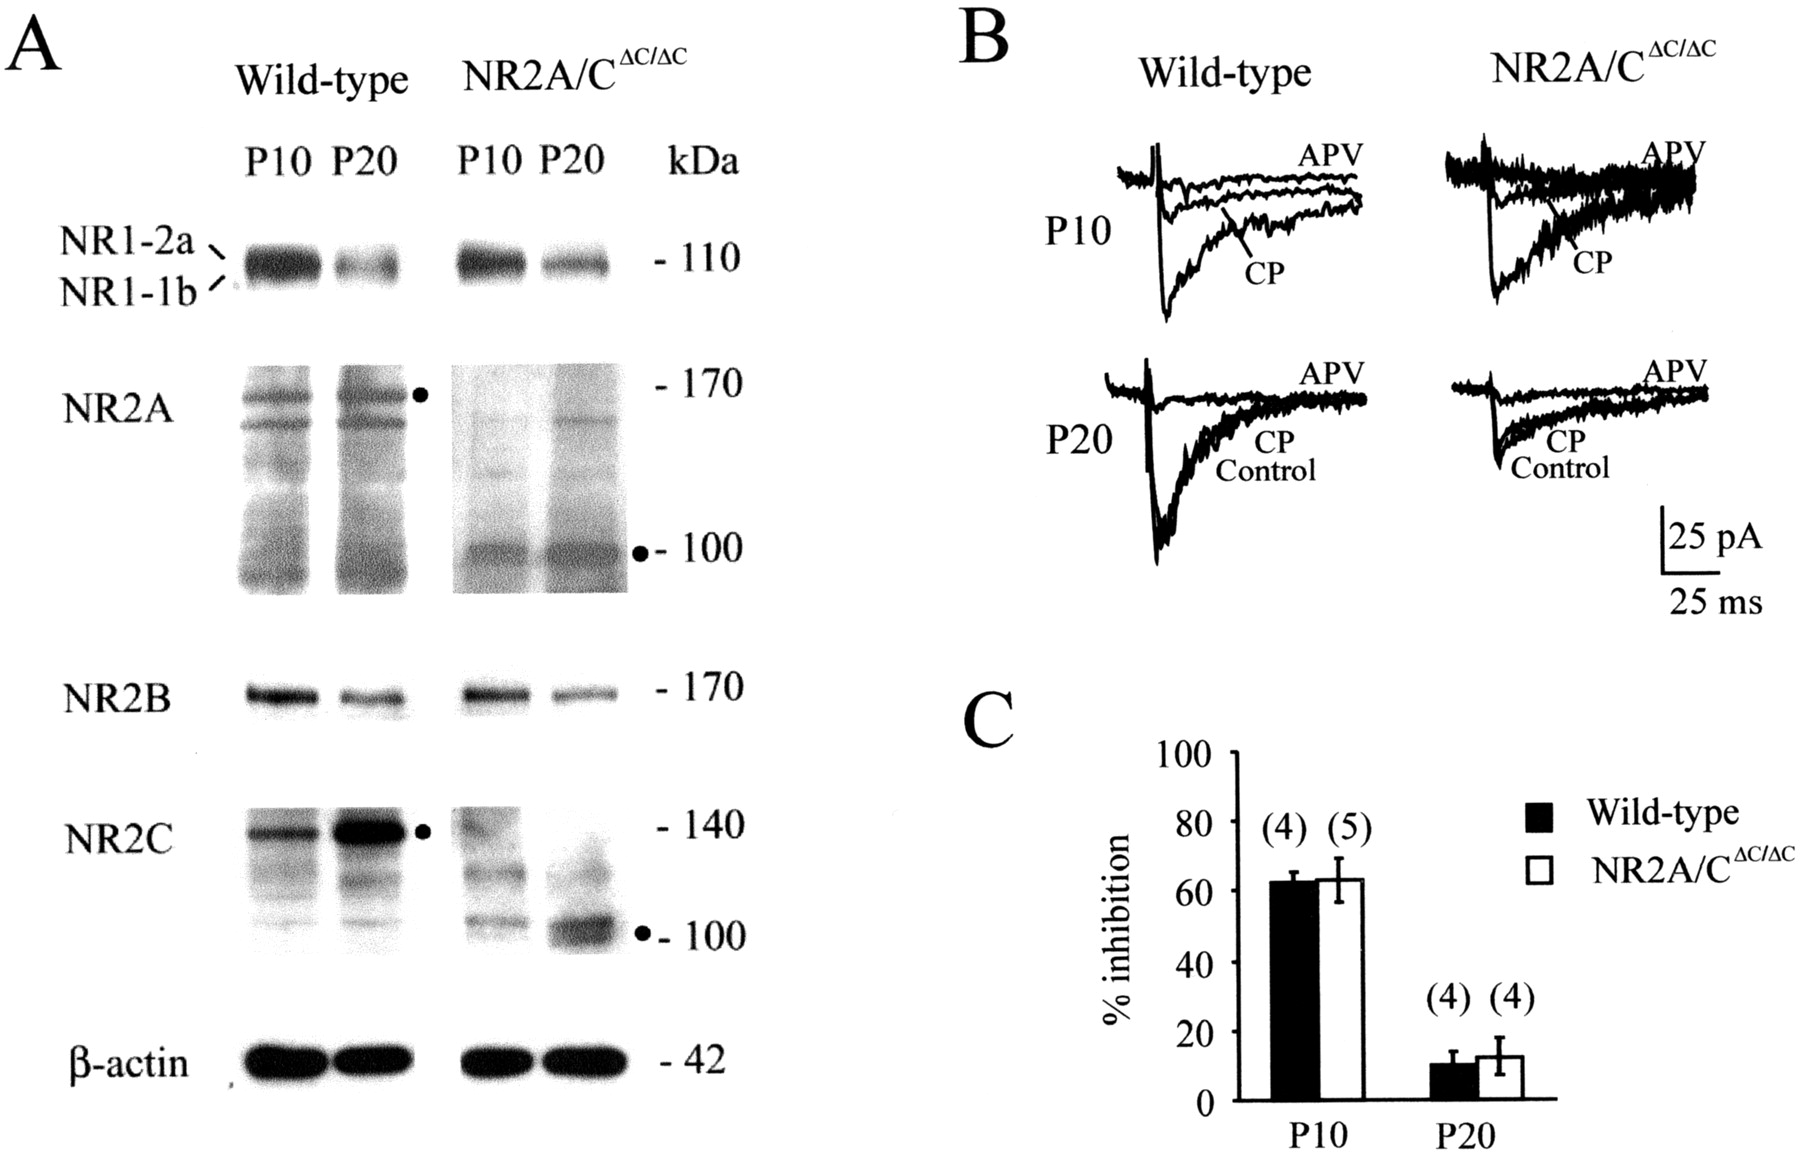
Ontogenetic expression of NMDA receptor subunits. A, Immunoblots on cerebellar homogenates with antibodies against NR1 splice variants containing exon 22 (NR1–2a, P10; NR1–1b, P20), NR2A, NR2B, and NR2C. The electrophoretic bands of full-length and truncated NR proteins are indicated by the Mr of the corresponding proteins (in kilodaltons). Note that NR2B expression decreases, whereas NR2C expression increases from P10 to P20 both in NR2A/CΔC/ΔC and in wild-type mice. Similar β-actin immunoreactivity demonstrates comparable protein loading.B, NMDA EPSCs were recorded from granule cells in acute cerebellar slices in a solution containing 10 μm CNQX and no added Mg2+ (holding potential, –70 mV). NMDA EPSC inhibition by 10 μm CP-101,606 was similar in NR2A/CΔC-ΔC mutant as in wild-type mice. Note the greater inhibition at P10 than P20, consistent with a developmental reduction of NR2B-containing NMDA receptors (compare with A). C, Mean percent inhibition of the NMDA current by CP-101,606 (thenumber of experiments is indicated inparentheses). Both at P10 andP20, inhibition was similar in NR2A/CΔC-ΔC and wild-type mice.
The presence of NR2B subunits suggested that they might be incorporated in synaptic receptors. We have therefore recorded NMDA currents in granule cells (Mg2+-free, 10 μm CNQX) after mossy fiber stimulation and applied CP-101,606, which blocks NR2B subunit-containing NMDA receptors. Both in NR2A/CΔC/ΔC and wild-type mice, CP-101,606 caused negligible EPSC inhibition at P20 (n= 4) (Fig. 3B,C). The effectiveness of CP-101,606 on NR2B-containing receptors was demonstrated by its block of NMDA EPSCs at P10 (Fig. 3B,C; cf. Rumbaugh and Vicini, 1999). Because CP-101,606 like ifenprodil may also block hetero-oligomeric channels containing NR2B in combination with other NR2 subunits (Kew et al., 1998), the absence of any significant CP-101,606 sensitivity suggests that NR2B subunits are not key determinants of mossy fiber synaptic transmission at P20 in NR2A/CΔC/ΔC(Cathala et al., 2000).
Similar NMDA receptor density in postsynaptic specializations
As a second step, we examined whether NMDA receptors were normally incorporated in postsynaptic specializations of NR2A/CΔC/ΔC cerebellar granule cell dendrites of P20 mice. To this end, we used immunogold labeling (Fig.4A) with anti-NR1 antibodies. In the wild type, 45.2% of the synaptic profiles were labeled with one or more gold particles. The proportion of labeled profiles was reduced to 39.1% in the NR2A/CΔC/ΔC mice, but the difference was not statistically significant (p = 0.44, Pearson's χ2 test) (Fig.4B). It should be noted that the PSD profiles were slightly longer in NR2A/CΔC/ΔC than in wild-type mice (p = 0.048, Mann–WhitneyU test). When the number of gold particles was expressed per unit length (particles per micrometer of membrane), medians for the labeled populations were 7.49 for wild-type and 6.57 for NR2A/CΔC/ΔC mice (Fig. 4C). Again, the difference was not statistically significant (p = 0.78, Mann–Whitney U test).

NMDA receptor expression in postsynaptic densities. A, Immunogold labeling (10 nm) of NR1 with anti-NR1 antibodies in a mossy fiber (M)→granule cell (G) synapse of wild-type (left) and NR2A/CΔC/ΔC (right) mice. Thearrowheads indicate the edge of the PSD.B, Percentage of postsynaptic densities associated with one or more gold particles. C, Linear density of gold particles (particles per μm membrane) over postsynaptic densities in wild-type and NR2A/CΔC/ΔC mice. This summary plot is based on the median, quartiles, and extreme values.Boxes represent the interquartile range that contains 50% of values. The bars represent maximum and minimum values, excluding outliers (circles, between 1.5 and 3 box lengths from the top or bottom edgeof the box) and extremes (asterisks, >3 box lengths from the edge of the box). The line across the box indicates the median.
Similar properties and activation of extrasynaptic NMDA receptors
Glutamate spillover in the cerebellar glomerulus may involve extrasynaptic NMDA receptors (Barbour and Häusser, 1997;Overstreet et al., 1999; Petralia et al., 2002). To investigate their potential contribution, we applied 10 U/ml GPT, which in the presence of 2 mm pyruvic acid slowly metabolizes glutamate to α-ketoglutarate (Fig. 5A) (Turecek and Trussel, 2000). In recordings performed in Mg-free solutions containing 10 μm CNQX, GPT reduced the NMDA EPSC more strongly in NR2A/CΔC/ΔC than wild-type mice (53.6 ± 15 vs 22.8 ± 14% charge reduction;n = 7 in both cases; p < 0.01) (Fig.5A). However, the GPT-sensitive component was similar (−396.4 ± 134 vs –392.7 ± 104.6 fC; n = 7 in both cases; NS). Thus, the effect of glutamate spillover is unchanged, but its contribution to EPSCs is proportionately greater in NR2A/CΔC/ΔC than wild-type mice. Glutamate spillover slowed down NMDA EPSCs, as revealed by subtracting GPT from control tracings (a summary of kinetic alterations will be presented in Fig. 8). It should be noted that GPT had almost no effect on the non-NMDA current (e.g., −2 ± 5% for wild-type EPSCs in five recordings without CNQX in the bath) (Fig. 5B), reflecting the inability of the present GPT-pyruvic acid concentrations to sensibly modify glutamate transients at postsynaptic specializations (Overstreet et al., 1999; Turecek and Trussel, 2000).

GPT sensitivity of NMDA receptor-mediated currents. Whole-cell recordings of NMDA EPSCs and single-channel openings were recorded in Mg2+-free solutions and (except B) in 10 μm CNQX.A, Application of 10 U/ml GPT blocked a similar NMDA current in NR2A/CΔC-ΔC as in wild-type mice. Subtraction of GPT from control tracings (bottom) shows the slow NMDA receptor-mediated component related to glutamate spillover. B, Absence of GPT effect on non-NMDA EPSCs (a different cell than in A). C, Spontaneous single-channel openings (3 times expanded in the insets) show similar size and frequency in NR2A/CΔC/ΔCand wild-type mice. The frequency of spontaneous openings is reduced by 10 U/ml GPT and 2 mm pyruvate and is suppressed by 100 μm APV and 50 μm 7-Cl-kyn.
Extrasynaptic receptors have been reported to generate spontaneous GPT-sensitive NMDA channel openings in cerebellar granule cells, reflecting the action of ambient glutamate (Rossi and Slater, 1993). Spontaneous NMDA channel openings, which were recorded during whole-cell recordings in Mg2+-free solutions containing 10 μm CNQX at least 1 sec after EPSCs (Rossi and Slater, 1993; Clark et al., 1996; Ebralidze et al., 1996), showed a similar frequency in NR2A/CΔC/ΔC and wild-type mice (52.8 ± 13.1 vs 42.7 ± 10.3/sec; n = 5 in both cases; p = 0.8) (Fig. 5C). The opening frequency was similarly reduced by 10 U/ml GPT and 2 mm pyruvic acid in NR2A/CΔC/ΔC as in wild-type mice (69.1 vs 67.8%; n = 5 in both cases). Two amplitude levels consistent with high- and low-conductance openings could usually be resolved both in NR2A/CΔC/ΔC as in wild-type mice (Fig. 5C, insets). These results thus suggest that extrasynaptic NMDA channels take part to NMDA EPSC generation and that their properties are similar in NR2A/CΔC/ΔC as in wild-type mice.
Normal conductance in synaptic NMDA channels
Single NMDA channel openings were isolated between 100 and 400 msec in the NMDA EPSC tail, where the current is almost stationary and openings are rare. Recordings were performed in Mg-free solutions containing 10 μm CNQX, and 10 U/ml GPT and 2 mm pyruvic acid were added to prevent contamination from spontaneous openings generated by extrasynaptic NMDA channels (see above). Openings corresponding to high- and low-conductance NMDA channels were observed in both NR2A/CΔC/ΔC and wild-type mice (Fig.6A), giving rise to similar amplitude histograms (Fig. 6B). The histograms could usually be fitted with a single Gaussian function (Fig. 6B), with a peak corresponding to low-conductance openings (41.6 ± 0.9 pS in NR2A/CΔC/ΔC mice and 40.6 ± 2.4 pS in wild-type mice; n = 4 in both cases). The prevalence of low-conductance openings may reflect prolonged activity in NR2C-containing channels (Ebralidze et al., 1996; Takahashi et al., 1996), whereas NR2A-containing channels are already closed after 100 msec. Smearing in amplitude distributions caused by superposition of multiple channel openings could contribute to mask the contribution of high-conductance channels. Overall, these measures indicated that single EPSC channel openings had similar conductance in NR2A/CΔC/ΔC as wild-type mice.

NMDA channel conductance. Whole-cell recordings were performed in Mg2+-free solutions containing 10 μm CNQX and 10 U/ml GPT and 2 mm pyruvate.A, Single NMDA channel openings were isolated in the NMDA EPSC tail between 100 and 400 msec after mossy fiber stimulation. Examples of high- and low-conductance openings from the same NMDA EPSCs are shown enlarged. C, Amplitude histograms obtained from NMDA channel openings in the same cells shown in A. Note almost identical single-channel currents in wild-type and NR2A/CΔC/ΔC mice.
Reduced peak open probability in synaptic NMDA channels
The probability of a channel being open at the EPSC peak (p) depends on multiple factors, comprising the probability of glutamate release and binding to the receptor and the probability of channel opening (formally, p is the product of all these individual probabilities). p can be estimated from the rate of EPSC block by an irreversible open-channel blocker, MK801 (p = τ −1) (Fig.7) (Hessler et al., 1993; Rosenmund et al., 1995; Chen et al., 1999; Chavis and Westbrook, 2001; Tovar and Westbrook, 2002). Provided that single channel conductance (γ) and open probability are known, the number of available NMDA channels (N) can also be estimated in MK801 experiments from the initial EPSC amplitude, (A), as N= (A/p)/γ.

Peak NMDA channel open probability. The probability of NMDA channel opening was compared in NR2A/CΔC/ΔC and wild-type mice by using the open channel blocker MK801 (40 μm). Tracingsshow NMDA EPSCs recorded in Mg2+-free solutions with 10 μm CNQX at different stimulus pulses after commencing MK801 perfusion. The plots show the time course of the MK801 block obtained by measuring the peak NMDA EPSC amplitude in the same exemplar cells. A, MK801 block was biphasic both in wild-type and NR2A/CΔC/ΔC mice. Biexponential fittings are obtained as y(t) = A1exp−t/τ1 +A2exp−t/τ2 (wild-type:A1 = −15 pA; 1/τ1 = 0.31; A2 = −24 pA; 1/τ2 = 0.05. NR2A/CΔC/ΔC: A1= −16 pA, 1/τ1 = 0.21;A2 = −8 pA; 1/t2 = 0.006. B, GPT selectively suppressed the fast component of MK801 block. Monoexponential fittings are obtained asy(t) =A2exp−t/τ2 (wild-type:A2 = −19 pA; 1/τ2 = 0.04; NR2A/CΔC/ΔC:A2 = −10 pA; 1/τ2 = 0.008). Both in A and B, the slow component of the MK801 block was slower in NR2A/CΔC/ΔC than in wild-type mice.
NMDA EPSCs were isolated in Mg2+-free solution with 30 μm CNQX. Then synaptic stimulation was interrupted, and 40 μm MK801 was applied. At this concentration, MK801 has been reported to saturate NMDA channels (Hessler et al., 1993; Rosenmund et al., 1995). After 5 min, mossy fiber stimulation was restarted. Both in wild-type and NR2A/CΔC/ΔC mice, an MK801 block developed with a double-exponential time course (Fig. 7A). The faster component decayed with almost identical time constants in wild-type and NR2A/CΔC/ΔC mice (p1 = 0.22 ± 0.08 vs 0.22 ± 0.02; n = 5). The slower component decayed with a 6.6 times faster time constant in wild-type than in NR2A/CΔC/ΔC mice (p2 = 0.04 ± 0.01 vs 0.006 ± 0.008; n = 5; p < 0.005). Thus, a lower channel open probability was revealed in a subset of NR2A/CΔC/ΔC NMDA channels.
Whereas the faster component of the MK801 block showed a similar initial amplitude (A1 = −8.5 ± 2.5 vs −10.0, 2.7 pA; n = 5; ratio, 0.85; NS), the slower component was much smaller in NR2A/CΔC/ΔC than in wild-type mice (A2 = −4.9 ± 1.1 vs −30.6 ± 8.1 pA; n = 5; ratio, 0.16; p < 0.001). Given equal single-channel conductance, bothN1 =A1/p1(38.6 vs 45.5) and N2 =A2/p2(816 vs 765) were similar in NR2A-CΔC/ΔC and wild-type mice, consistent with GPT experiments (compare Fig. 5) and NR1 immunolabeling in electron microscopic (EM) sections (compare Fig. 3). The NMDA response estimated from A1 +A2 was 67.0% lower in NR2A-CΔC/ΔC than in wild-type mice, in close agreement with Woodhull fittings to NMDA EPSC I–Vrelationships (compare Fig. 1).
To investigate the nature of dual MK801 blocking kinetics, we performed recordings in the presence of 10 U/ml GPT and 2 mmpyruvate. In all the experiments, both in wild-type and NR2A/CΔC/ΔC mice, GPT abolished the faster component of the MK801 block (Fig. 7B). The component remaining in the presence of GPT decayed with a time constant that was significantly faster in wild-type than in NR2A/CΔC/ΔC mice (pGPT = 0.03 ± 0.04 vs 0.009 ± 0.003; n = 5; p < 0.0005). Thus, the GPT-insensitive component coincides with the slow component of the MK801 block observed without GPT. Slow blocking kinetics in NR2A/CΔC/ΔC mice caused a sizeable EPSC fraction to remain unblocked even after 150 stimulation pulses. This residual response was rapidly blocked by 100 μm APV and 50 μm7-Cl-kyn (data not shown), demonstrating efficient drug perfusion at NMDA receptor sites.
Summary of NMDA EPSC kinetic changes
The conclusion that MK801 causes a more rapid block of extrasynaptic than synaptic receptors was confirmed by measuring its effect on NMDA EPSC kinetics. Peak-scaled tracings showed a similar NMDA EPSC acceleration with GPT or 50–100 pulses after restarting stimulation in the presence of MK801 (Fig.8A). Biexponential fittings revealed that τw (Eq. 2) decreased by a similar amount after either GPT or MK801 application. τw changes were significant both in wild-type and NR2A/CΔC/ΔC mice, although these latter showed overall slower kinetics (n = 5 for all measurements) (Fig. 8B).

Kinetics of synaptic and extrasynaptic NMDA EPSC components. A, Peak–scaled tracings (averaging of 10 EPSCs) show the accelerating effect of GPT and MK801 on NMDA EPSC kinetics. B, τw values in the experimental conditions shown in A. τw is slower in NR2A/CΔC/ΔC than wild-type mice and shows similar acceleration with GPT and MK801 (mean ± SD;p < 0.05; n = 5 for all measurements).
Impaired NMDA receptor-dependent LTP
NMDA synaptic current alterations suggested that NMDA receptor-dependent LTP could be impaired. Similar to rats (D'Angelo et al., 1999), in wild-type mice, high-frequency mossy fiber stimulation (8 × 100 Hz bursts) induced LTP (n = 5 of 5 cells) (Fig. 9A). Both the NMDA and non-NMDA components increased, following a similar time course, and remained potentiated throughout the duration of the recordings (at least 30 min). Thirty minutes after induction, the non-NMDA current was increased by 23.7 ± 2% (n = 5), and the NMDA current was increased by 69.5 ± 9.3% (n = 5). By using the same induction protocol, no LTP was observed in NR2A/CΔC/ΔC mice (n = 6 of 6). Thirty minutes after induction, the non-NMDA EPSC component changed by –9.8 ± 8.7% (n = 6), and the NMDA EPSC component changed by –17.8 ± 13.5% (n = 6).

Long-term potentiation: impairment and restoration. To induce LTP, high-frequency bursts were applied to mossy fibers at t = 0. Tracings are average EPSCs recorded at –70 and +60 mV either before (thin line) or 20 min after having applied the induction bursts (thick line). Shown is the time course of EPSC amplitude changes (filled circles, NMDA current measured at +60 mV;open circles, non-NMDA current measured at –70 mV).A, Induction was performed with eight bursts (1 every 250 msec) consisting of 10 impulses at the frequency of 100 Hz while the granule cell was depolarized to –30 mV. Note that LTP was present in wild-type but absent in NR2A/CΔC/ΔC mice.B, Induction was reinforced by using 16 bursts (one every 250 msec) consisting of 20 impulses at the frequency of 200 Hz while the granule cell was depolarized to –30 mV. LTP in wild-type mice was similar to that shown in A, indicating that LTP was already saturated with 8 × 100 Hz induction bursts. LTP of the non-NMDA current was fully restored in NR2A/CΔC/ΔC mice, although the NMDA current increased less than in wild-type mice.
We then tested the effect of a reinforced induction paradigm, in which both burst frequency and the number of bursts were doubled (16 × 200 Hz bursts) (Fig. 9B). In the wild type (n = 5 of 5), 30 min after induction, the non-NMDA component increased by 24.7 ± 16.7 (n = 5), and the NMDA component increased by 81 ± 27.7% (n = 5), indicating that LTP was already saturated with 8 × 100 Hz bursts. Interestingly, in NR2A/CΔC/ΔCmice, LTP was partially restored (n = 4 of 4). Thirty minutes after induction, the non-NMDA component increased by 28.9 ± 7% (n = 4), and the NMDA component increased by 42 ± 14% (n = 4). It was thus still possible to elicit LTP in NR2A/CΔC/ΔC mice, but it needed stronger induction than in wild-type mice.
These experiments indicate a defect in the LTP induction mechanisms, because both non-NMDA and NMDA currents were either unpotentiated or potentiated depending on the induction protocol. In addition, a defect in LTP expression may specifically affect NMDA receptors, whose current was poorly potentiated even with the reinforced induction paradigm. LTP impairment and restoration could be related to charge transfer through NMDA channels (Fig.10A). During TBS, the NMDA conductance in NR2A/CΔC/ΔC was 49.2% compared with wild-type mice but increased to 132% of control values with the reinforced induction protocol (Fig.10B).

Charge transfer during tetanic stimulation: impairment and restoration. The charge transfer during TBS and reinforced TBS (TBS+) was measured as the time integral of the synaptic response. Contribution of non-NMDA currents, which are small at –30 mV and decay rapidly compared with NMDA currents, was negligible. A, Exemplar TBS andTBS+ tracings in wild-type and NR2A/CΔC/ΔC mice. Individual non-NMDA EPSCs are often invisible on this scale. Note the tail NMDA current arising on jumping back from the pairing (−30 mV) to holding (−70 mV) potential.B, Average charge transfer in recordings from wild-type and NR2A/CΔC/ΔC mice (mean ± SD;n = 5 in both cases). Both in A andB, the charge transfer is greater in wild-type than NR2A/CΔC/ΔC mice. Using TBS+, the charge transfer in NR2A/CΔC/ΔC recovers to wild-type levels using TBS.
DISCUSSION
In NR2A/CΔC/ΔC mice, C-terminal truncation of NR2A and NR2C subunits caused a profound impairment in NMDA receptor-dependent synaptic transmission and plasticity at the mossy fiber–granule cell relay of the cerebellum. Despite this, cell maturation indices, including NR2 subunit expression (Monyer et al., 1994), non-NMDA current size (Losi et al., 2002), and firing pattern (data not shown), were normal. This probably reflects the expression of mutated NR2A and NR2C genes after the major granule cell developmental changes have occurred. Moreover, we found no indication of abnormal release probability, because the paired pulse stimulation ratio, mini frequency, and coefficient of variation of non-NMDA EPSC were unchanged. We have been able to identify a specific reduction in peak open probability of synaptic NMDA receptors during the EPSC (p) as the main functional alteration.
The estimate of p and the functional distinction between synaptic and extrasynaptic NMDA EPSC components were based on two observations. First, MK801 blocking kinetics were biphasic, revealing two distinct NMDA receptor populations. The corresponding pvalues (0.04 vs 0.22 in wild-type mice) coincided with those reported for the closed–open transition in synaptic and extrasynaptic NMDA receptors in cultured neurons (Rosenmund et al., 1995). Second, GPT caused a significant NMDA EPSC reduction (20% in the wild type) and accelerated NMDA EPSC decay by selectively inhibiting the NMDA receptors with higher p. GPT prevents NMDA receptor activation by low glutamate concentrations (Overstreet et al., 1999;Turecek and Trussel, 2000), which are likely to occur after glutamate spillover on extrasynaptic receptors (Barbour and Häusser, 1997). Thus, extrasynaptic NMDA receptors, whose role in cerebellar granule cells remained speculative so far (Rossi and Slater, 1993; Petralia et al., 2002), can be activated in the NMDA EPSC. Glutamate released from mossy fibers has also been proposed to activate metabotropic Glu receptors on Golgi cell presynaptic terminals (Mitchell and Silver, 2001), and GABA released from Golgi cell presynaptic terminals can activate extrasynaptic GABA-A receptors on granule cells (Rossi and Hamann, 1998). Thus, our observations support the role of neurotransmitter spillover during synaptic transmission in the cerebellar glomerulus (Barbour and Häusser, 1997). The molecular nature of granule cell extrasynaptic NMDA receptors is an object of debate, mainly concerning NR2B subunit incorporation (cf. Rumbaugh and Vicini, 1999; Cathala et al., 2000). Slower kinetics in extrasynaptic than synaptic EPSCs may reflect either increased contribution of NR2B or slow receptor activation during spillover. Based on the data of Chen et al. (1999) showing lower p in NR1/NR2B than NR1/NR2A heteromers, our results do not favor an enhanced NR2B contribution to extrasynaptic receptors.
Strikingly, in NR2A/CΔC/ΔC mice,p was reduced in synaptic but not extrasynaptic receptors. Ap reduction is a potential consequence of NR2 subunit truncation, because NR2 C-terminal phosphorylation by PSD-associated kinases regulates channel gating (Kim and Huganir, 1999; Lan et al., 2001). The specific alteration of synaptic receptors suggests that their modulatory properties, subunit composition, and interactions with subsynaptic proteins differ from those of extrasynaptic receptors (Chen et al., 1999; Petralia et al., 2002, their Discussion). The selective action of GPT provides a further argument against a reduction in glutamate release as the cause of p reduction in the mutant. Because both synaptic and extrasynaptic receptors are activated by the same mossy fiber terminal inside the glomerulus, a decreased release probability would similarly decrease channel opening in the GPT-sensitive and -insensitive components of NMDA EPSCs.
The p reduction in synaptic NMDA receptors precisely predicts the NMDA EPSC decrease observed in NR2A/CΔC/ΔC mice. Because of a 6.6 times smaller p, the contribution of synaptic receptors drops from 80 to 12%. This, added to an invariant 20% contribution of extrasynaptic receptors (see above), yields 32%, corresponding to the 68% NMDA EPSCs amplitude reduction measured in NR2A/CΔC/ΔC mice. Additional experiments excluded alternative explanations. Western blots revealed normal expression of NR1 and NR2 subunits, suggesting an unaltered subunit composition, and NR1 EM immunolabeling indicated a normal density of NMDA receptors in the synapse. Estimates using MK801 blockage ruled out a reduced NMDA channel number; single-channel recordings ruled out reduced NMDA channel conductance; and Woodhull fittings ruled out an enhanced voltage-dependent Mg2+ block. Single-channel recordings, by showing both high- and low-conductance openings, also supported the presence of NR2A- and NR2C-containing NMDA receptors (Cull-Candy et al., 1998). Similar CP-101,606 blockage of NMDA EPSCs excluded an increase in NR2B-containing receptors. Moreover, contrary to our observation, reduced NR2C expression would accelerate NMDA EPSC decay, increasing Mg2+ sensitivity as well as single-channel conductance (Ebralidze et al., 1996). Reduced NR2A expression, although slowing down the NMDA EPSC, would decrease Mg2+ sensitivity and single-channel conductance (Takahashi et al., 1996). A reduced open probability has been recently proposed to contribute to NMDA EPSC reduction in cultured neurons with C-terminal truncation of the NR2B subunit C terminus (Mohrmann et al., 2002).
Unlike amplitude decrease, the NMDA EPSC slowdown observed in NR2A/CΔC/ΔC mice is difficult to explain with a p reduction. At hippocampal synapses, it has been proposed that changes in NMDA receptor localization protract NMDA EPSCs by raising the average distance traveled by glutamate to reach the receptors (Steigerwald et al., 2000). This hypothesis was based on the assumption that the NR2A truncation would lead to a decrease of NMDA receptors inside the PSDs and an increase of NMDA receptors outside the PSDs and was recently supported by immunogold labeling (G. Köhr and O. P. Ottersen, unpublished observations). However, NMDA receptor density in PSDs of cerebellar granule cells was not significantly altered, probably reflecting alternative molecular interactions such as binding of NR1 to actin through α-actinin (Scannevin and Huganir, 2000). Moreover, kinetics slowdown persisted even after extrasynaptic currents, which are the most sensitive to spillover, were blocked by GPT or MK801. Thus, changes in NMDA receptor localization do not seem sufficient to explain the NMDA EPSC slowdown, maybe reflecting different molecular or geometrical organization in cerebellar compared with hippocampal synapses. Alternatively, because NMDA channel kinetics develop on a two- to three-orders-longer time scale compared with glutamate diffusion (Rosenmund et al., 1995; E. D'Angelo and T. Nieus, unpublished observations), the NMDA EPSC slowdown may reflect a reduction in the channel desensitization rate (Steigerwald et al., 2000), closing rate, or glutamate unbinding rate.
NMDA receptor current alterations provide plausible explanations for the LTP induction impairment observed in NR2A/CΔC/ΔC mice. The reduced charge transfer through NMDA channels during high-frequency repetitive stimulation is the most obvious of these. Similarly, LTP induction becomes ineffective when the NMDA current is reduced by a pharmacological block or membrane hyperpolarization (D'Angelo et al., 1999; Armano et al., 2000). The other factor concerns the transient NMDA current increase, which is thought to occur during high-frequency trains needed for LTP induction. This process requires NR2 C-terminal phosphorylation by PSD-related tyrosine kinases such as src(Huang et al., 2001) and fyn (Tezuka et al., 1999) and should therefore be impaired by the NR2A/CΔC/ΔC mutation. LTP restoration with stronger induction bursts indicates that the metabolic processes downstream of NMDA channel opening could still be activated. Nonetheless, despite full potentiation of non-NMDA receptor-mediated currents, NMDA current potentiation was incomplete. This alteration may be directly related to the mutation, because LTP expression is thought to involve NMDA receptor phosphorylation depending on Ca/calmodulin-dependent kinase II exchange with PSD95 on the NR2A C terminus and on PKC activation (Gardoni et al., 2001; Lan et al., 2001).
The reduction in NMDA receptor open probability observed after NR2A/C C-terminal deletion at the cerebellar mossy fiber–granule cell relay has two main implications. First, it reveals a key role for NR2 subunits in NMDA receptor gating. Second, it suggests that appropriate regulation of the open probability of synaptic NMDA receptors is critical for LTP induction. LTP has been proposed to promote sensorimotor learning at the mossy fiber→granule cell synapse (Schweighofer et al., 2000; Hansel et al., 2001). Because the NR2A–NR2C combination is not expressed at other cerebellar synapses (Monyer et al., 1994; Cull-Candy et al., 1998), altered NMDA receptor-dependent transmission and LTP in granule cells provide a key to explaining the deficit in motor learning and coordination observed in NR2A/CΔC/ΔC (Sprengel et al., 1998) and NR2A-C knock-out mice (Kadotani et al., 1996; Imamura et al., 2000).
Footnotes
This work was supported by European Community Grants IST-2001-35271 and QLG3-CT-2001-02256, by Ministero dell' Università e della Ricerca Scientifica e Tecnologica and Istituto Nazionale per la Fisica della Materia of Italy, and by Deutsche Forschungsgemeinschaft Grant Ko 1064. J.K.U. was supported by Prof. Letten F. Saugstad's Foundation. We thank Lia Forti for comments on a previous version of this manuscript, Liliana E. Layer, Rolf Sprengel, and Antonio Caputi for help with Western blot experiments, Raffaela Biesuz for atomic absorption measurements, and Pfizer Inc. for the gift of CP-101,606.
Correspondence should be addressed to Egidio D'Angelo, Dipartimento di Scienze Fisiologiche e Farmacologiche, Via Forlanini 6, I 27100 Pavia, Italy. E-mail: dangelo{at}unipv.it.


