

Abstract
The excitatory feedforward projection from layer (L) 4 to L2/3 in rat primary somatosensory (S1) cortex exhibits precise, columnar topography that is critical for columnar processing of whisker inputs. Here, we characterize the development of axonal topography in this projection using single-cell reconstructions in S1 slices. In the mature projection [postnatal day (P) 14-26], axons of L4 cells extending into L2/3 were confined almost entirely to the home barrel column, consistent with previous results. At younger ages (P8-11), however, axonal topography was significantly less columnar, with a large proportion of branches innervating neighboring barrel columns representing adjacent whisker rows. Mature topography developed from this initial state by targeted axonal growth within the home column and by growth of barrel columns themselves. Raising rats with all or a subset of whiskers plucked from P8-9, manipulations that induce reorganization of functional whisker maps and synaptic depression at L4 to L2/3 synapses, did not alter normal anatomical development of L4 to L2/3 axons. Thus, development of this projection does not require normal sensory experience after P8, and deprivation-induced reorganization of whisker maps at this age is unlikely to involve physical remodeling of L4 to L2/3 axons.
Introduction
The fundamental unit of cortical processing is the cortical column. Columnar processing is achieved in part by precise axonal projections that preferentially connect cells within single, radial columns (Mountcastle, 1957, 1997). In the whisker region of rat primary somatosensory (S1) cortex, each cortical column processes information primarily from one facial whisker (Simons, 1978; Keller, 1995). Neurons in layer (L) 4 of S1 are arranged in clusters, called barrels, with one barrel corresponding to each whisker in an orderly map (Woolsey and Van der Loos, 1970; Welker and Woolsey, 1974). When a whisker is deflected, thalamic afferents excite neurons in the corresponding L4 barrel, which then relay excitation to L2/3 of the radial column centered on that barrel, termed the barrel column (Armstrong-James and Fox, 1987; Petersen and Sakmann, 2001; Laaris and Keller, 2002; Petersen et al., 2003).
In mature S1, the excitatory feedforward relay from L4 to L2/3 is mediated by axons of L4 spiny stellate and star pyramidal cells that project to L2/3 almost exclusively within the home barrel column, forming a topographically precise, columnar projection (Harris and Woolsey, 1983; Lubke et al., 2000; Petersen and Sakmann, 2000, 2001; Feldmeyer et al., 2002). This projection has similar topography in other neocortical sensory areas (Lund et al., 1977; Winer, 1984; Burkhalter, 1989; Callaway and Katz, 1992). In S1, columnar topography is so precise that axons of L4 cells near the edges of barrels project asymmetrically within L2/3, innervating the home column while avoiding neighboring columns (Petersen and Sakmann, 2000). How this precision arises during development is unknown and is the subject of this study.
In the classic model for development of topographic projections, adult precision arises by activity- or age-dependent refinement of initial axons that are either modestly or highly overarborized (Katz and Shatz, 1996; Debski and Cline, 2002; McLaughlin et al., 2003). This basic developmental pattern occurs in neocortex for callosal projections (Innocenti, 1981, 1995), for horizontal projections in L2/3 (Luhmann et al., 1986; Callaway and Katz, 1990; Durack and Katz, 1996), and for laminar target selection by L2/3 pyramidal cells (Callaway, 1998; Borrell and Callaway, 2002). Whether thalamocortical axons develop similarly is controversial, with some studies finding initial axons to be poorly segregated or unsegregated into cortical columns (LeVay et al., 1978; Agmon et al., 1995; Finney and Shatz, 1998; Ruthazer et al., 1999; Rebsam et al., 2002), and other studies showing adult-like topography from the earliest stages of axonal development (Catalano et al., 1996; Crowley and Katz, 2002). Thus, whether topographic projections develop by a common process is unclear.
Another unresolved issue is the role of sensory experience in guiding axonal development. Sensory experience is required for late stages of development of horizontal and thalamocortical axons in visual cortex (Callaway and Katz, 1991; Lowel and Singer, 1992; Antonini and Stryker, 1993b), although not for early establishment of thalamocortical axon topography (Horton and Hocking, 1996; Katz and Crowley, 2002). In S1, experience modulates synaptic strength and functional topography of the developing L4 to L2/3 projection (Lendvai et al., 2000; Stern et al., 2001; Allen et al., 2003; Shepherd et al., 2003; Takahashi et al., 2003); however, whether experience exerts these effects by altering the physical arrangement and targeting of L4 to L2/3 axons, as proposed recently (Stern et al., 2001), is unknown.
To characterize development and experience-dependent plasticity of the L4 to L2/3 axonal projection, we filled and reconstructed single L4 cells relative to column boundaries in S1 slices prepared from animals of different ages and sensory experience. We found that at young ages, axons spread across columns more than in mature rats, and that mature, columnar topography was achieved by targeted axonal growth in the home barrel column. Remarkably, axonal development occurred normally even in the absence of normal sensory experience.
Materials and Methods
Whisker plucking. All procedures were approved by the University of California San Diego Institutional Animal Care and Use Committee. Whiskers were plucked every 2 d from the right side of the face of Long-Evans rats under isoflurane anesthesia. For unilateral deprivation experiments, all large whiskers [A1-4, B1-4, C1-7, D1-8, E1-9, and the straddler row (α, β, γ, δ)] were plucked beginning at postnatal day (P) 9 and continuing every other day until slices were prepared (P14-17). For D-only deprivation experiments, D1-8 and γ were plucked every other day from P8 until slices were prepared (P23-26).
Slice preparation. Rats (P6-26) were anesthetized with isoflurane, and the brain was removed in either chilled normal Ringer's solution (for animals ≤P13) containing (in mm): 119 NaCl, 2.5 KCl, 1.3 MgSO4, 1 NaH2PO4, 26.3 NaHCO3, 11 d-(+)-glucose, 2.5 CaCl2, pH 7.4, bubbled with 95%O2/5%CO2 or low-sodium, low-calcium Ringer's solution (>P13) containing (in mm): 250 sucrose, 2.5 KCl, 4 MgSO4, 1 NaH2PO4, 15 HEPES, 11 d-(+)-glucose, 0.1 CaCl2. Oblique S1 slices (400 μm) were cut 50° toward coronal from the midsagittal plane (Land and Simons, 1985; Finnerty et al., 1999). In one hemisphere, this plane is parallel to the barrel rows and produces slices containing multiple barrels from each row (“within-row slices”). In the other hemisphere, this plane is orthogonal to barrel rows and produces slices with one barrel from each of the five rows (“across-row slices”). Slices were incubated for 30 min at 30°C in normal Ringer's solution and then incubated at room temperature for 0.5-6 hr before recording.
Electrophysiology. Recordings were made at room temperature in normal Ringer's solution. Whisker barrels were visualized with transmitted light and identified on the basis of location and barrel appearance (Finnerty et al., 1999; Petersen and Sakmann, 2000; Allen et al., 2003). Spiny stellate and star pyramidal neurons at least 100 μm below the surface of the slice were visualized with differential interference contrast optics and filled with biocytin during whole-cell recording [Axopatch-200B amplifier; Axon Instruments (Union City, CA); 5-7 MΩ pipettes; 40-60 min recording duration]. Internal solution contained (in mm): 116 K-gluconate, 6 KCl, 2 NaCl, 20 HEPES, 0.5 EGTA, 4 MgATP, 0.3 NaGTP, 0.3% biocytin (w/v), pH 7.23. For within-row slices, fills were made in barrels that were flanked by at least one whisker barrel on either side. In across-row slices, fills were made in the D-barrel. Action potentials (APs) were elicited every 30 sec by current injection for the duration of the recording. Resting membrane potential (Vm), input resistance (Rin), AP threshold, and AP amplitude (from threshold to peak) were measured for each cell. Membrane potential measurements were corrected for a measured junction potential of 10 mV.
Histological procedures. Slices were fixed immediately after recording in 4% paraformaldehyde/20% sucrose in 0.1 m phosphate buffer (PB) overnight. Slices were then transferred to 4% paraformaldehyde/30% sucrose in PB at least 1 hr before resectioning at 100 μm on a freezing microtome. Sections were rinsed in PB and endogenous peroxidases were quenched with 10% methanol and 1% H2O2 (30 min). Sections were incubated in permeabilization/blocking solution (1% normal rabbit serum, 0.75% Triton X-100 in PB) for 2 hr and incubated overnight in primary antibody solution (1:5000 goat anti-biotin, 1% normal rabbit serum, 0.1 Triton X-100) at 4°C. After rinsing, sections were transferred to a secondary antibody solution (1:200 biotinylated rabbit anti-goat, 1% normal rabbit serum, 0.1% Triton X-100) for 2 hr. Biotin was then visualized with a standard avidin-biotin-HRP reaction (Vector Laboratories, Burlingame, CA), with diaminobenzidine hydrochloride (DAB, 0.1%) as a chromogen (DeBello et al., 2001). Sections were mounted on Superfrost slides (Fisher, Pittsburgh, PA) and air-dried. Alternate sections were exposed to 1% osmium tetroxide to increase contrast and visualize barrels (Keller and Carlson, 1999). To intensify the reaction product, sections were dehydrated and cleared in xylenes overnight and then rehydrated and incubated in 1.42% silver nitrate at 56°C for 30 min, followed by 0.2% gold chloride at room temperature for 10 min, and fixed with 5% sodium thiosulfate for 5 min (Kitt et al., 1988). Finally, sections were dehydrated, cleared in xylenes, and coverslipped using Permount. All antibodies were obtained from Vector.
Reconstruction and quantification of axonal morphology. Neurons with consistently intense staining along the axon length and no obvious truncation of axonal processes were reconstructed from live digital images (40× objective; numerical aperture (NA) = 0.75; resolution 0.25 μm per pixel) using Neurolucida software (Microbrightfield, Williston, VT) with a Magnafire camera (Optronics, Goleta, CA) on an Axioskop 2 plus microscope (Zeiss, Thornwood, NY). Neurons with somata near the center of the desired barrel were reconstructed for quantitative analysis of axonal topography. Barrel outlines were determined from osmium-stained sections (Keller and Carlson, 1999). Barrel column boundaries were defined by parallel lines bisecting the septa on either side of the barrel containing the filled cell (“home barrel column”) or by two parallel lines located 220 μm medial and lateral to the soma (“±220 μm column”). This distance corresponds to the mean width of a mature barrel column (440 ± 80 μm for all slices; P14-26 in both planes of section; n = 70). A series of line segments connecting the top of the barrels was used to define the L3/4 border (see Fig. 3A).

Development of columnar topography measured relative to the home barrel column. A, Definition of home barrel column. Dashed lines represent midpoints of septa. Horizontal line represents L3/4 border. A P14 star pyramid in across-row slice is shown. B, Schematic of nondirected axon growth model. Variables (x, d, c) are measured for each experimental group (see Materials and Methods for definitions). ATot is enclosed by solid black lines; AHome is gray. Assuming nondirected growth if uniform density is around the soma, the fraction of axon in the home column in L1-3 is AHome/ATot. Vertical scale indicates percentage depth in L1-3 from pia. C, Sublaminar distribution of axon length in L1-3 for mature cells (P14-26). Of the total axon length (gray), 95% occurs in the deepest 70% of L1-3. Bars represent SEM. D, Percentage of axon length in L1-3 contained within home barrel column as a function of age, for all cells. Solid and dashed lines indicate mean ± SD for mature cells (P14-26). Labels indicate cells shown in Figures 2 and 3A.
Because L2/3 pyramidal cells receive inputs via dendrites located in layers 1-3 (Keller, 1995), topography of the L4 to L2/3 projection was quantified by measuring the location and length of all axon segments in the supragranular layers (L1-3, defined as the region between the pia and the L3/4 border). In practice, ∼5% of axon length was located within 150 μm of the pia (presumptive L1), and thus nearly all reconstructed axon within L1-3 was located in L2/3 proper (see Results). Axon length and spatial distribution in L1-3 were calculated using custom image analysis routines in MATLAB (Mathworks, Natick, MA). Distances and lengths were not corrected for the measured 2% shrinkage of fixed, stained tissue relative to living slices. All values are expressed as mean ± SD unless noted otherwise. Significance was determined using Student's t test unless noted otherwise.
To determine the tangential distribution of axon in L1-3, L1-3 was divided into 50 μm radially oriented columns with the central column centered on the soma. Axonal length was measured within each column. To determine the sublaminar distribution of axon in L1-3 (i.e., depth profile of axon within L1-3), L1-3 was subdivided into 10 equal strips oriented parallel to the pia, and axonal length within each strip was measured. The resulting distributions were normalized by the total axon length in L1-3. Differences in the shape of spatial distributions of axon were tested using Kolmogorov-Smirnov statistics.
The measured fraction of axon within L1-3 of the home barrel column was compared with the fraction expected in a simple model of uniform, nondirected axonal growth around the soma. For each age group and plane of section, the radius (r) of maximal vertical axonal extent from the soma was calculated as the sum of the average measured distance from the soma to the L3/4 border (x) plus the average measured vertical distance (d) from the L3/4 border containing 95% of all axon length in L1-3 (see Fig. 3B). The total area in L1-3 contained within the circle of radius r was calculated as
 , where θ1 = 2cos-1(x/r), which corresponds to the angle between lines KJ and JN in Figure 3B. The area of the circle contained within the home column in L2/3 was calculated as
 , where
 , the angle between lines JL and JM in Figure 3B, and c equals the average measured width of the barrel column. For a model of nondirectional growth in which axonal density is equal in L2/3 throughout the circle of radius r, the fraction of axon in the home column would be AHome/ATot.
Other analyses. For axonal bouton analysis, a section of axon in L2/3 of the home barrel column 200 ± 60 μm in length was chosen randomly. Bouton counts were performed blind to sensory experience at a resolution of 0.16 μm per pixel (63× objective; NA = 1.4). Boutons were defined as swellings visible on either or both sides of an axonal branch, accompanied by increased staining intensity. Dendritic complexity of spiny stellate cells was assessed using Sholl analysis with branch crossings counted on concentric circles spaced every 25 μm and centered on the soma (Sholl, 1953). Significance was tested with Kolmogorov-Smirnov statistics. Axon length in L4 was quantified using methods described for L1-3. Here, an additional series of line segments connecting the bottom of the barrels defined the L4/5 border.
Results
Topography of L4 to L2/3 axons in mature S1 slices
To assess the morphology of excitatory L4 to L2/3 axons, single cells in the central 30% of L4 whisker barrels were filled with biocytin during whole-cell recording in S1 slices. Axons and dendrites were visualized with an antibody-based reaction using DAB as a chromogen (Fig. 1A). These cells had prominent axons with discernable boutons (Fig. 1A, inset) in supragranular layers (L1-3). All axon in L1-3 was analyzed because L2/3 neurons receive inputs in all supragranular layers, including L1 (Keller, 1995). Barrels were visualized in alternate sections by osmium intensification of DAB-stained tissue (Fig. 1B) and used to define barrel columns for each slice (Fig. 1C). Osmium-stained barrels correspond well to barrels visualized by transillumination in living slices (Keller and Carlson, 1999), which in turn correspond to barrels observed by cytochrome oxidase staining (Petersen and Sakmann, 2000).

Labeling and reconstruction of single spiny stellate cell in L4 of S1. A, Photomontage from a single 100-μm-thick section showing a biocytin-labeled L4 spiny stellate neuron in an across-row slice (P21). Insets show dendrite with spines (arrowheads) and axon with boutons (arrows). B, Osmium-intensified barrels in an adjacent section from the same slice. C, Full reconstruction of the neuron in A and B. Soma and dendrite are in black, axon is in dark gray, and barrels and pia are in light gray. Numbers indicate cortical layers.
All 119 cells (P6-26) reconstructed in this study were excitatory, as defined by the presence of dense dendritic spines (Saint Marie and Peters, 1985). Of these, 56 were spiny stellate cells, 40 were star pyramidal cells, and the rest had an incomplete dendritic tree and could not be classified beyond being excitatory. We did not observe any classic (non-star) pyramidal cells, presumably because few exist in the center of barrels (Schubert et al., 2003). The ratio of star pyramids to spiny stellate cells decreased with development (P8-11: 18 star pyramids and 18 stellate cells; P14-26: 18 star pyramids and 36 stellate cells), consistent with reported developmental trends (Peinado and Katz, 1990). No differences in axonal morphology were found between spiny stellate cells, star pyramids, and unidentified excitatory cells, for either immature (P8-11) or mature (P14-26) cell populations (Table 1). Axonal measurements were therefore pooled across cell types for all analyses.
Morphology of axons and membrane properties of spiny stellate, star pyramidal, and unclassified spiny neurons
Cells were selected on the basis of regular spiking responses to a 500 msec depolarizing current injection (Connors and Gutnick, 1990) and Vm rest < -75 mV. Within our data set, AP threshold and AP amplitude showed modest differences across cell classes (Table 1).
Cells were filled in S1 slices cut in one of two orthogonal planes of section, either parallel to whisker barrel rows (within-row slices) or parallel to whisker barrel arcs (across-row slices) to provide a complete description of axonal topography (see Materials and Methods). Each slice contained multiple barrels, with the cell filled in a central barrel [normalized horizontal soma position within central barrel = 0.49 ± 0.1 (0 = lateral edge of barrel, 1 = medial edge of barrel); normalized depth of soma in barrel = 0.49 ± 0.1 (0 = L3/4 border, 1 = L4/5 border); P8-26, n = 112]. In P14-26 rats, axons of L4 cells projecting into L1-3 were primarily restricted to the home barrel column in both planes of section (Figs. 1, 2A). In across-row slices, 87 ± 14% (n = 25) of axon length in L1-3 was confined to the home barrel column (defined as the column enclosing the home barrel and half the adjacent septa) (Fig. 3A). In within-row slices, 76 ± 22% (n = 22) of axon length was confined to the home barrel column, significantly less than in the across-row plane (p < 0.05). Thus, L4 to L2/3 axons were essentially columnar but showed more divergence to neighboring columns within a row than across rows, as do other axonal projections in S1 (Petersen et al., 2003).

Representative examples of L4 excitatory cells in across-row slices at different ages. Lateral is to left. Scale bar, 200 μm. L5 and 6 boundaries are not shown. Letters in barrels indicate barrel rows.
To determine whether axonal topography within L1-3 reflected active targeting to the home barrel column, we calculated the percentage of axon expected in the home column assuming uniformly dense, nontargeted axonal growth in all directions from the soma (see Materials and Methods) (Fig. 3B). In the nondirected growth model, only 59.6 and 58.3% of all axons in L1-3 would be expected in the home barrel column in across-row and within-row slices, respectively, given the column width (c) and maximal vertical axonal spread from the soma (r = d + x)in these slices (x = 161.5, 153.2 μm; d = 313.5, 330.4 μm; c = 465, 413 μm, across- and within-row, respectively). Because substantially higher fractions of axon were actually observed in the home column than predicted by this model, L4 to L2/3 axonal topography must reflect active targeting of axon to the home barrel column in mature rats.
The sublaminar distribution (i.e., depth profile) of axon within L1-3 was quantified by measuring the percentage of axon length as a function of depth in L1-3 (Fig. 3C). Across all mature cells (n = 47), 95% of axon length was contained within the deepest 70% of L1-3. The average pia to L3/4 border distance was 500 ± 70 μm. Thus, 95% of reconstructed axon was contained in the deepest 350 μm of L2/3.
Development of axonal topography in the across-row plane
To characterize development of this projection, neurons were filled in across-row slices from P6, several days after L4 barrels form (Rice et al., 1985), through P26, when cortical circuits are thought to be mostly mature. At P6-7, there was little axonal innervation of L1-3, although innervation of infragranular layers was more extensive. Of seven cells that were reconstructed, four had no axon in L1-3 (Fig. 2C1), and three had extremely sparse projections in L1-3 (Fig. 2C2). By P8, significantly more axonal length was present in L1-3 (Fig. 2B), and topography could be measured. This developmental pattern, in which axons extend initially to infragranular layers and subsequently to supragranular layers, has also been observed for L4 spiny stellate cells in cat area 17 (Callaway and Katz, 1992).
At P8-11, when most cells had axon in L1-3, axons (n = 32) exhibited a range of topographic precision, from very columnar (data not shown), to noncolumnar (Fig. 2B1), to exclusive targeting of a neighboring column (Fig. 2B2). On average, axonal topography of these cells within L1-3, measured relative to the home barrel column, was significantly less precise than that of mature cells (Fig. 3D) (P8-11: 56 ± 30% in home column; P14-26: 87 ± 14% in home column; p < 0.0001). This percentage is similar to that predicted by the nontargeted growth model (Fig. 3B) (58.8%; x = 108.2 μm, d = 259.1 μm, c = 360 μm), suggesting that initial axon growth in L1-3 is nondirected.
Because the width of L4 barrels increases with age [P8-11: 307 ± 55 μm (exclusive of septa); P14-26: 403 ± 73 μm; p < 0.001], developmental sharpening of topography may reflect growth of the home barrel column, remodeling of the axon itself, or both. To determine whether axonal remodeling occurred, we examined axonal topography relative to a constant width column with borders ±220 μm medial and lateral from the soma (“±220 μm column”), which is the mean width of the mature barrel column across both slice planes. We calculated the percentage of axon in L1-3 within the ±220 μm column as a function of age for the same cells as in Figure 3D (Fig. 4A). The mean percentage of axon within the ±220 μm column increased significantly with development (P8-11: 64 ± 32%, n = 32; P14-26: 86 ± 15%, n = 25; p < 0.01), indicating that axonal topography sharpened with age. Thus, both remodeling (spatial sharpening) of axonal arbors and growth of the barrel column occur during development and contribute to developmental sharpening of L4 axonal topography.

Development of columnar topography measured relative to the ±220 μm column. A, Percentage of axon length in L1-3 contained within ±220 μm tangential distance from soma as a function of age. Solid and dashed lines represent mean ± SD for mature cells. B, Distribution of axon length in L1-3 as a function of tangential distance from soma, for immature (P8-11) and mature (P14-26) cell groups. Bars represent SEM. Ellipses show approximate barrel boundaries. Inset, Average falloff of the data determined by summing both flanks of the distributions in B.
To further quantify the developmental sharpening of this projection, we calculated the tangential distribution of axon length in L1-3, relative to the soma position, for mature (P14-26) and immature (P8-11) cells. This tangential distribution of axon showed a strong but nonsignificant tendency to be sharper in mature than immature cells (Fig. 4B) [mature vs immature: p = 0.17; Kolmogorov-Smirnoff (KS) test]. When the mean slope of this function was calculated by averaging across both flanks of the distributions, slope was significantly sharper in mature cells (Fig. 4B, inset) (p < 0.0001; KS test). In contrast to these changes in tangential distribution, the sublaminar distribution of axon in L1-3 did not change during development (p = 0.6; KS test). These results demonstrate that L4 to L1-3 axons develop with initial topography that is less precise than in adults and that adult topography emerges between P11 and P14.
Targeted axonal growth mediates developmental sharpening
Total axon length in L1-3 increased significantly through development (Fig. 5A), with mature L4 cells possessing twice as much axon in L1-3 as immature cells (P14-21, n = 19: 4470 ± 2250 μm; P8-11, n = 32: 1950 ± 1710 μm; p < 0.001). To determine whether topographic sharpening involved targeted axonal growth within the home column, regression outside the home column, or both, we measured the absolute length of axon inside and outside the ±220 μm column in across-row slices. Analyses of absolute axonal length were restricted to cells <P22 because older cells tended to have fainter axonal staining that limited our ability to accurately measure axon length.

Topographic refinement in the across-row plane occurs through targeted axon growth. A, Total axon length in L1-3 as a function of age. Bars are SD. Parentheses indicate number of cells. B, Axon length within (filled circles) and outside (open circles) the ± 220 μm column, as a function of age. Least-squares regression lines show a significant increase in axon length within the ± 220 μm column with age (p = 0.0001; R2 = 0.27), but no significant regression outside the ± 220 μm column.
In young rats (P8-11), total axon length was 1460 ± 1670 μm inside the ±220 μm column and 490 ± 540 μm outside this column. In older rats (P14-21), total axon length was 4070 ± 2280 μm inside and 400 ± 350 μm outside the ±220 μm column. Thus, axon length within the ±220 μm column increased during development (Fig. 5B) (p < 0.0001; R2 = 0.27), but absolute axon length outside the ±220 μm column did not change (p = 0.7; R2 = 0.003). This suggests that topographic sharpening in the across-row dimension occurs via targeted growth in the home column, rather than net retraction of axon outside the column. Correspondingly, the maximal tangential breadth of axon arbors, measured as the distance between the most medial and lateral axonal branches in L1-3, did not change through development (P8-11: 560 ± 280 μm; P14-21: 530 ± 130 μm; p > 0.5).
Axonal topography in the within-row plane
To characterize development in the orthogonal plane (within barrel rows), slices were made that contained multiple barrels within a single whisker row (see Materials and Methods). Cells were filled in a central barrel flanked by at least one barrel on each side. Axons from mature rats (P17-21; n = 22) showed columnar topography in this plane (76 ± 22% of axon in L1-3 was contained in the home barrel column, defined as in Fig. 3A), although this topography was less precise than in the across-row dimension (87 ± 14% in home column; p < 0.05).
To determine why axonal spread into neighboring barrels was greater in this dimension, we compared absolute spatial distribution of axon in the two planes. The absolute tangential distribution of axon length (p > 0.05; KS test), the maximal tangential breadth of axonal arbors (within-row: 650 ± 180 μm; across-row: 550 ± 160 μm; p > 0.05), and the percentage of axon contained in the ± 220 μm column (within-row: 82.5 ± 15.8%; across-row: 86.4 ± 14.6%; p > 0.3) were not different between within-row and across-row planes (Fig. 6A). In addition, the sublaminar distribution of axon was identical between the two planes (p > 0.07; KS test). However, barrel columns (defined to include half the adjacent septa) were narrower in the within-row versus across-row dimension (within-row: 413 ± 90 μm; across-row: 465 ± 82 μm; p < 0.05). This discrepancy in column size primarily reflected the fact that septa between rows were larger than within rows (62 ± 35 μm between rows; 36 ± 24 μm within rows; p < 0.01), whereas barrels were roughly the same diameter in both dimensions (403 ± 73 μm in across-row dimension; 377 ± 86 μm in within-row dimension; p > 0.2) (Welker and Woolsey, 1974; Land and Simons, 1985; Riddle et al., 1992). Because barrel columns were narrower in the within-row dimension, axon segments extending isotropically out of the home column tended to innervate neighboring columns within rows.

Development of axons in the within-row plane. A, Distribution of axon length as a function of tangential distance from soma for mature neurons in within-row and across-row planes of section. B, Distribution of axon as a function of tangential distance from soma for immature (P8-11) and mature (P17-21) cells in the within-row plane. Bars represent SEM. Ellipses show approximate barrel boundaries. C, Total axon length in L2/3 as a function of age. Bars represent SD. Parentheses indicate number of cells. D, Axon length within (filled circles) and outside (open circles) the ±220 μm column as a function of age. Regression lines indicate that axon length increased significantly with age both within (p < 0.02; R2 = 0.18) and outside (p < 0.02; R2 = 0.18) the ±220 μm column.
No significant changes in topographic precision were found during development in the within-row plane. In immature cells (P8-9; n = 10), 84 ± 23% of axon length in L1-3 was within the home barrel column, comparable with mature cells in this plane (p > 0.1). Topographic precision in immature cells was substantially better than predicted with the nontargeted growth model (61.7%; x = 103.7 μm, d = 203.5 μm, c = 310 μm), suggesting that initial axons are actively targeted to the home column in this dimension. Initial topography was also precise when measured in absolute distance: 89 ± 18% of L1-3 axon was inside the ±220 μm column for immature cells, compared with 83 ± 16% for mature cells (p > 0.3). Moreover, the tangential distribution of axon in the within-row dimension was actually sharper for immature than mature cells (Fig. 6B) (p < 0.01; KS test). The sublaminar distribution of axon length also did not change with development (p > 0.9; KS test).
Developmental maintenance of topography in this plane should require that axon length be added proportionately inside the home barrel column and outside it, in neighboring columns within the row. Indeed, we found that as total axon length in L1-3 increased in within-row slices during development (Fig. 6C) (P8-11: 1580 ± 1110 μm; P17-21: 3940 ± 2220 μm; p < 0.01), axon length increased significantly, and approximately proportionally, within (P8-9: 1390 ± 1060 μm; P17-21: 3380 ± 2110 μm; p < 0.02; R2 = 0.18) and outside (P8-9: 190 ± 260 μm; P17-21: 560 ± 540 μm; p < 0.02; R2 = 0.18) the ±220 μm column (Fig. 6D). Consistent with growth outside the home column, the maximal breadth of this projection increased significantly from 470 ± 270 μm in immature cells to 650 ± 180 μmin mature cells (p < 0.04). Thus, unlike in the across-row plane, development in the within-row plane involves net growth of axon both in the home column and in neighboring columns within the row.
Development of L4 axons innervating L4
L4 cells also innervate other L4 barrel neurons, forming a dense local excitatory network. In mature rats, this projection is highly column specific, with 70-90% of axon length restricted to the home barrel (Harris and Woolsey, 1983; Lubke et al., 2000; Petersen and Sakmann, 2000; Brecht and Sakmann, 2002). To determine how topographic precision develops in the L4 to L4 projection, we analyzed axon segments of L4 cells contained within L4. In mature cells (P14-26; n = 25), 93.1 ± 8.1% of axon length in L4 was contained in the home column (the barrel and half the adjacent septa) in across-row slices, and a similar topographic precision was observed in within-row slices (89.8 ± 9.7%; n = 22). In immature cells (P8-11), significantly less axon was confined to the home column in across-row slices (P8-11: 83.9 ± 14.5%; n = 32; p < 0.01 vs mature), indicating that initial projections were less precise than the adult in this dimension. In contrast, adult-like precision was apparent for immature cells (P8-9) in the within-row dimension (94.6 ± 5.5% in home column; n = 10; p > 0.15 vs mature).
Developmental refinement in the across-row dimension was caused primarily by growth of the barrel column itself, because the percentage of axon within the ±220 μm column in L4 was not significantly different between mature (93.5 ± 7.4%) and immature (89.2 ± 11.7%) neurons (p > 0.1). In addition, developmental refinement also involved targeted axonal growth in L4 of the home column, because axon length increased significantly with development inside the ±220 μm column (P8-11: 2210 ± 1260 μm, n = 32; P14-26: 4440 ± 1640 μm, n = 25; p < 0.0001), but axon length remained constant outside the ±220 μm column (P8-11: 250 ± 324 μm; P14-26: 70 ± 310 μm; p = 0.8). Thus, the development of axonal topography in L4 mirrored the pattern of development observed for projections to L1-3.
A summary of axonal topography across development is presented in Figure 7. Individual axonal reconstructions were scaled to normalize horizontal and vertical dimension of the home barrel column to their mean values, aligned to column boundaries, and overlaid. Axon length density was calculated per 10 μm2 pixel (Fig. 7, left) and smoothed by a Gaussian filter (50 μm SD) to show the mean shape of the projection (Fig. 7, right). It is apparent that the mature projection to L2/3 is restricted primarily to a single column in both across-row and within-row dimensions and that mature topography emerges from a more diffuse projection in the across-row dimension. It is also apparent that this maturation occurs both by addition of axon in the home column and by growth of the barrels themselves. Axons segments in L5-6 are presented here for completeness but were not analyzed in this study.

Summary of axonal topography from all reconstructed cells. Left, Overlay of all reconstructed axons relative to barrel column. Individual axons were scaled to normalize barrel width and pia to L4/5 distance to mean values and aligned by barrel boundaries. Dots indicate location of somata in L4. Right, Same data smoothed using a two-dimensional, 50 μm SD Gaussian. Barrels and pia are in red. Barrels and septa size are drawn to accurately reflect mean size for each developmental age and plane of section. Scale bar, 200 μm for all panels.
Sensory experience does not affect anatomical development
We performed two manipulations to determine whether sensory experience guides development of L4 axons. First, we plucked all contralateral whiskers from P9 to P14-17, a manipulation that drives experience-dependent receptive field plasticity in L2/3 and has been proposed to regulate anatomical connectivity of the L4 to L2/3 projection (Stern et al., 2001). Second, in a separate set of rats, we plucked the D-row of whiskers from P8 to P23-26, a manipulation that drives synaptic weakening of L4 to L2/3 synapses and thus may cause synaptic elimination on this pathway (Allen et al., 2003). After both manipulations, neurons were filled in the D-barrel of across-row slices. Passive membrane properties and AP characteristics of L4 neurons were similar in deprived versus control animals (data not shown).
Neither deprivation paradigm caused any discernable change in topography of L4 to L2/3 axons, either relative to age-matched controls or to all mature controls (P14-26) (Table 2). The tangential distribution of axon in L1-3 was not different between control rats and either of the whisker-deprived groups (Fig. 8A,B) (unilateral: p > 0.9; D-only: p > 0.9; KS test). Likewise, total axon length and percentage of axon in the home column were also unaffected by deprivation (Fig. 8C,D, Table 2). Sublaminar distribution of axon was also unaffected (unilateral: p > 0.9 vs control; D-only: p > 0.3 vs control; KS test), and Sholl analysis of L4 dendritic morphology revealed no effect of deprivation (Table 2) (unilateral vs control: p > 0.5; D-only vs control: p > 0.4; KS test). L2/3 dendrites were not examined in this study.
Morphology of axons and dendrites in animals with altered whisker experience

Whisker experience does not alter axonal morphology. A, Tangential distribution of axon length for control rats and rats deprived of all whiskers unilaterally. B, Tangential distribution of axon length for control rats and rats deprived of the D-row of whiskers. Bars represent SEM. Ellipses show approximate barrel boundaries. C, Total axon length in L2/3 for all conditions. D, Percentage of axon in home column for all conditions. Diamonds represent P14-17 rats. Circles indicate P18-22 rats. Triangles indicate P23-26 rats. Horizontal bars represent means.
Finally, we tested for differences in bouton density on L4 axon segments in L2/3 between control and deprived animals. Bouton density has been shown to be relatively constant across different branches within the axonal arbor of single pyramidal cells (Yabuta and Callaway, 1998b), and in our sample, we found no differences in bouton density between central and peripheral axon segments selected randomly from single arbors (p > 0.5; paired t test; n = 4 cells; two central and two peripheral branches per cell). Thus, to measure the effects of deprivation on bouton density, a single axon segment within L2/3 of the home barrel column was selected at random from each cell for bouton analysis. Bouton counts were performed blind to sensory experience. In mature controls, bouton density in L2/3 was 16.9 ± 2.5 boutons per 100 μm (n = 15), consistent with previously reported values (Lubke et al., 2000). Bouton density did not change after either deprivation protocol (Table 2). Together, the results in this section indicate that whisker-related sensory activity during the period in which L4 to L1-3 axons are being elaborated does not significantly affect their morphology at the light microscopic level.
Discussion
These results demonstrate that the L4 to L2/3 excitatory axonal projection develops precise columnar topography from an initial state that is significantly less columnar. In the initial state, many cells extend a large number of branches into neighboring columns representing adjacent-row whiskers, and mean topography in this dimension (across rows) is consistent with completely undirected axonal extension in L2/3. In contrast, initial topography in the within-row dimension is as precise as in mature animals (Figs. 6, 7). Maturation of topography occurs in a 3 d period (P11-14) and involves targeted growth of axon within the home barrel column and growth of the barrels themselves but no net retraction of axon outside the home column (Figs. 5, 6, 7). The period of topographic refinement coincides with the critical period for experience-dependent regulation of spine dynamics and deprivation-induced, large-scale reorganization of L2/3 receptive fields (Lendvai et al., 2000; Stern et al., 2001); however, development of L4 axonal length, topography, and bouton density occurs normally in whisker-deprived animals (Fig. 8). Thus, axonal development and topographic refinement of this projection are independent of sensory experience, at least after P8. These results imply that deprivation-induced map plasticity during this period does not involve large-scale physical remodeling of L4 axons.
Mature axonal topography
The mature columnar topography that we observed is consistent with previous studies from cell fills in vitro (Kim and Ebner, 1999; Lubke et al., 2000; Petersen and Sakmann, 2000; Feldmeyer et al., 2002) and in vivo (Brecht and Sakmann, 2002), with the columnar relay of excitation from L4 to L2/3 inferred from single-unit recording (Armstrong-James et al., 1992) and imaging studies in vivo (Petersen et al., 2003) and in vitro (Petersen and Sakmann, 2001; Laaris and Keller, 2002). We found that only 13% of axon length crossed into neighboring columns within a barrel arc, and 24% crossed into neighboring columns within a barrel row. This preferential divergence into neighboring columns within a row occurred despite the fact that the tangential spread of axon in L2/3 was equal, in absolute distance, in both within-row and across-row dimensions (Fig. 6A). Instead, divergence was greater within a row because interbarrel septa are thinner between barrels within a row, so that more axons reached neighboring barrel columns within a row than within an arc (Figs. 6, 7). Horizontal axonal projections of L2/3 pyramidal neurons show a similar bias along barrel rows (Bernardo et al., 1990; Hoeflinger et al., 1995; Keller and Carlson, 1999; Petersen et al., 2003), suggesting that convergence of information from neighboring whiskers within a row is an important feature of processing in L2/3.
Because some axon branches are inevitably lost during slice preparation and tissue processing (resectioning for the anti-biocytin reaction reduces total tissue thickness to ∼350 μm), the axonal length measurements reported here should be considered minimal estimates of total axon length in vivo. We cannot rule out the possibility that long-range axonal projections exist in vivo but are missing from our reconstructions, and thus actual topography in vivo may be somewhat less columnar than observed here; however, substantially different topography is unlikely because receptive field analysis and imaging studies in vivo suggest strongly that L4 to L2/3 projections are functionally column specific (Armstrong-James et al., 1992; Petersen et al., 2003), and axons of single L4 neurons filled in vivo are confined primarily to single columns in L2/3, consistent with our findings (Brecht and Sakmann, 2002). Similar topography has been observed for L4 axons in visual and auditory cortices (Lund et al., 1977; Winer, 1984; Burkhalter, 1989; Callaway and Katz, 1992; Yabuta and Callaway, 1998a), suggesting that columnar projections from L4 to L2/3 are a basic building block of neocortical columns (Mountcastle, 1997).
Development of axonal topography
The L4 to L2/3 projection develops columnar topography in the across-row dimension from a relatively coarse initial projection with topography that is consistent with nondirected growth. Topographic refinement of this early projection occurs during a discrete developmental period (P11-14). Such refinement of an early, somewhat coarse projection is consistent with classic models of development of axonal topography and is similar to the pattern observed for callosal and horizontal intracortical projections (Innocenti, 1981, 1995; Luhmann et al., 1986; Katz and Shatz, 1996; Debski and Cline, 2002). Perhaps because initial overarborization is fairly modest, topographic refinement of L4 to L2/3 axons in the across-row dimension occurs through selective addition and/or retention of axon within the home barrel column and growth of barrel columns relative to the axon arbors, rather than through net retraction of axon from neighboring columns (Figs. 5, 9). Such targeted growth contributes to development of mature topography in many projections (Callaway and Katz, 1990; Katz and Shatz, 1996; Yates et al., 2001; Rebsam et al., 2002). In contrast, topography in the within-row dimension was initially precise, and precision was maintained throughout development, apparently by equal growth of axon both within and outside the home column (Figs. 6, 7). This pattern of axonal development is illustrated schematically in Figure 9.
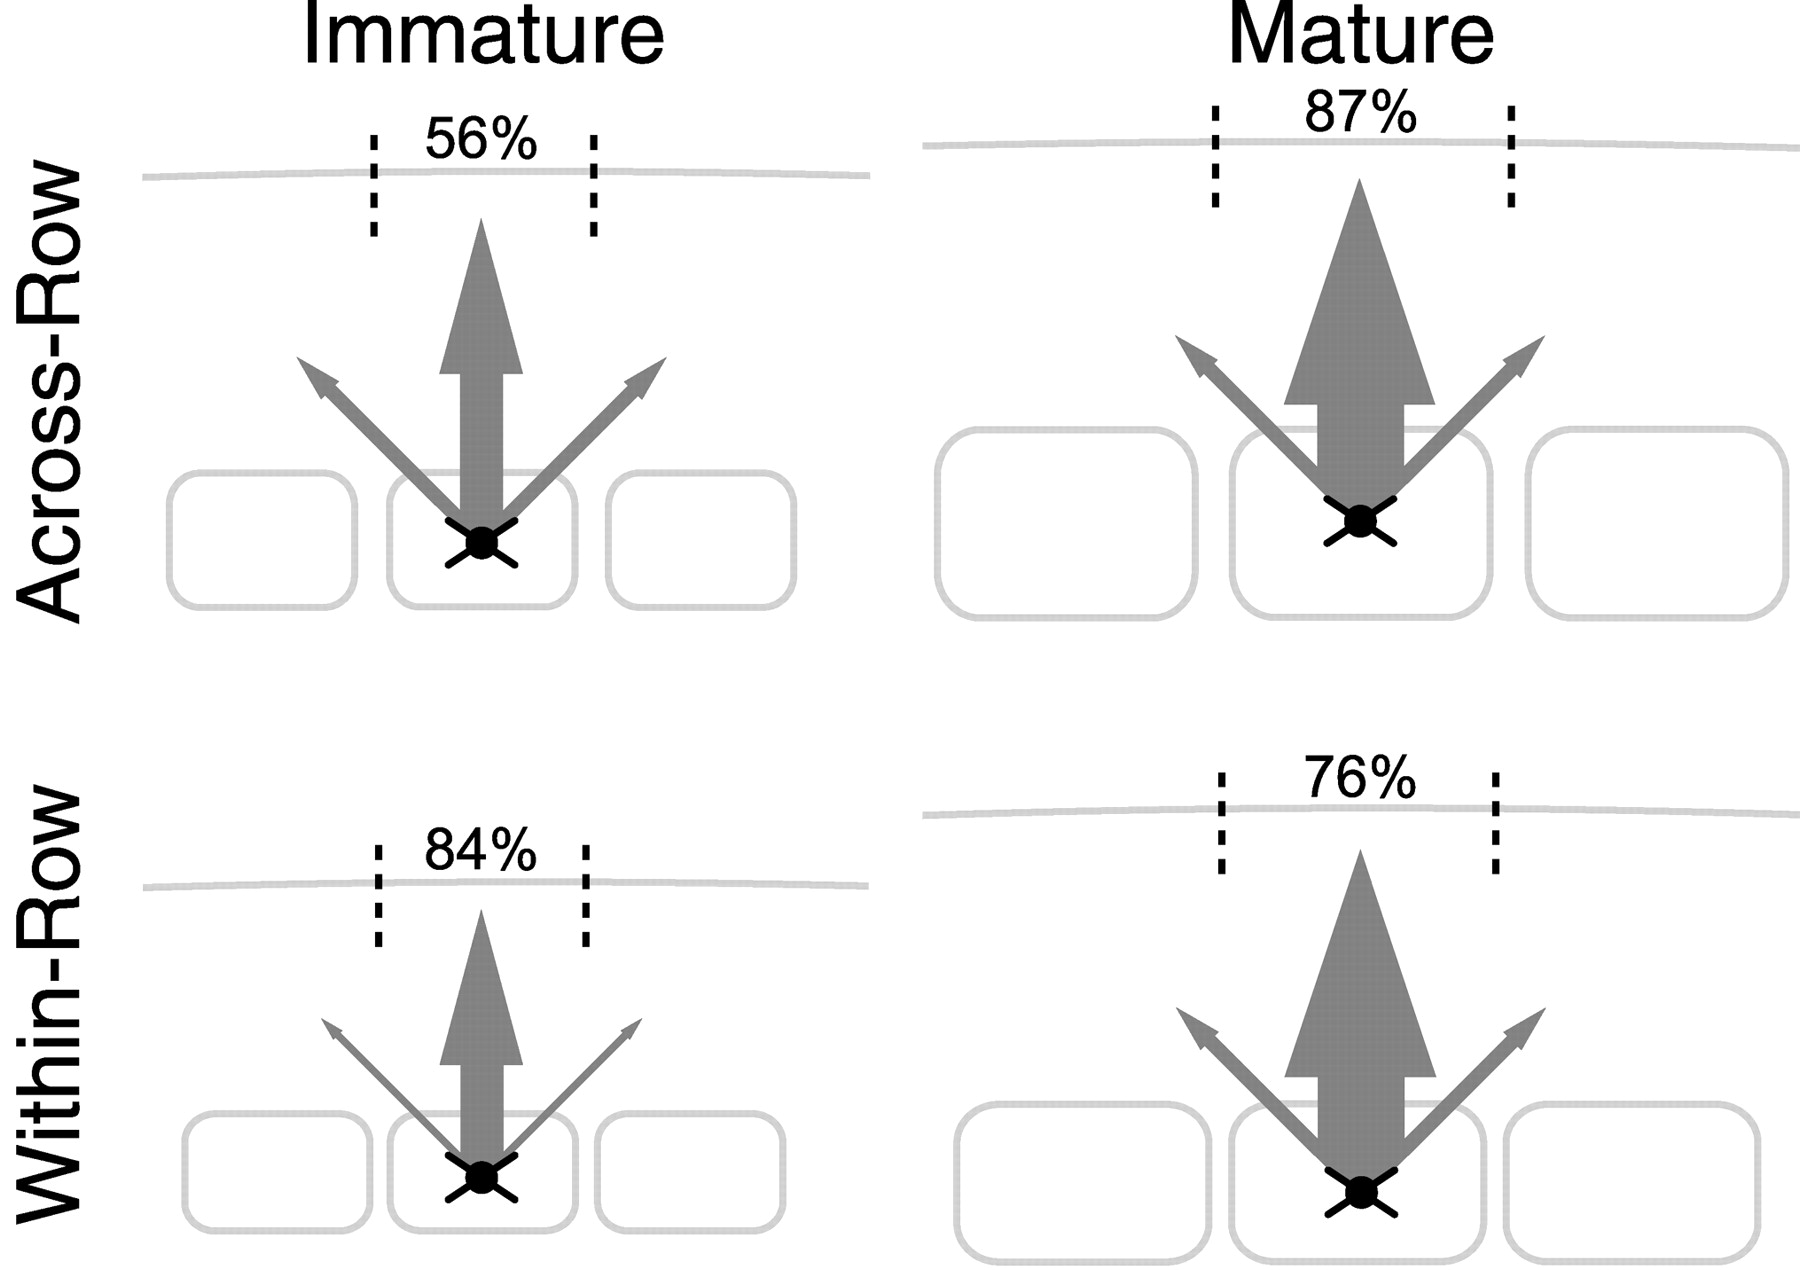
Schematic model of L4 to L2/3 axonal development. Arrow thickness is proportional to mean total axon length in L2/3 of the home column (center arrow) and each of two neighboring columns through development. Numbers indicate percentage of axon in the home barrel column for that age (dashed lines). Barrels and septa are drawn to scale across all conditions, as in Figure 7.
It has been controversial whether thalamocortical axons, which are also restricted primarily to single columns in adults, develop similarly. Some studies found that thalamacortical axons develop by initial overarborization followed by substantial refinement (LeVay et al., 1978; Finney and Shatz, 1998; Ruthazer et al., 1999; Rebsam et al., 2002). Other studies indicate that even the earliest axons are confined to single, column-sized termination zones in L4 of S1 (Agmon et al., 1993; Catalano et al., 1996) and V1 (Crowley and Katz, 2002), and that development involves addition of terminal branches in those zones (Senft and Woolsey, 1991; Agmon et al., 1993; Catalano et al., 1996). Our results suggest that to determine whether early thalamocortical axons are fully precise or somewhat overarborized requires determining not only whether individual axon arbors are the correct size, but also whether they are located in correct termination zones within the target map and whether this precision is equal in all dimensions.
In our data, the same pattern of developmental refinement observed for L4 to L2/3 axonal projections was also found for L4 axon branches innervating L4, which show a high degree of column-specific topography in mature animals (Harris and Woolsey, 1983; Lubke et al., 2000; Petersen and Sakmann, 2000; Brecht and Sakmann, 2002). At P8-11, immature L4 axons showed significantly less topographic precision than in mature animals, with a greater proportion of axon innervating L4 of adjacent, neighboring-row barrel columns. This refinement was attributable both to growth of barrel columns relative to the axonal arbors and to targeted growth of axon within the home L4 barrel. As in L2/3, initial projections were topographically precise in the orthogonal, within-row dimension.
Axonal development is independent of normal sensory experience
In many projections, patterns of sensory experience or endogenous activity modulate development of axonal topography. For example, visual deprivation alters the size and complexity of thalamocortical axon arbors in V1 (Antonini and Stryker, 1993a,b; Antonini et al., 1998), binocular experience guides tangential clustering of horizontal axons in L2/3 of primary visual cortex (Luhmann et al., 1986; Lowel and Singer, 1992), and spontaneous retinal activity is required for segregation of retinogeniculate axons into layers in the thalamus (Katz and Shatz, 1996). However, activity is not necessary for proper topographic development of all projections (Lin et al., 2000; Butler et al., 2001; White et al., 2001).
Rats begin to actively whisk at ∼P12 (Welker, 1964), coincident with the period of active refinement of the L4 to L2/3 axonal projection. Because trimming whiskers at this age alters spine dynamics and causes large-scale changes in functional connectivity on the L4 to L2/3 pathway (Lendvai et al., 2000; Stern et al., 2001), we hypothesized that whisker experience would regulate development of L4 to L2/3 axonal topography. Interestingly, whisker deprivation had no effect on development of axonal length, topography, or bouton density (Fig. 8). This result indicates that unlike thalamocortical and horizontal intracortical projections, development of L4 to L2/3 axonal projections does not require normal sensory experience, at least during the period when axons begin to innervate L2/3. Whether L4 to L2/3 axonal development is driven by spontaneous activity in the absence of normal whisker input, is completely activity independent, or is influenced indirectly by experience at younger ages, during the critical period for plasticity in L4 (Fox, 1992), is unknown. Although it is possible that anatomical plasticity was prevented by the transient isoflurane anesthesia used during whisker plucking, such interference seems unlikely because plucking under anesthesia successfully drives robust changes in both functional synaptic efficacy (Allen et al., 2003) and whisker receptive fields in S1 (Fox, 1992; Glazewski and Fox, 1996; E. Foeller and D. E. Feldman, unpublished data).
Implications for experience-dependent plasticity
Because sensory manipulations can induce receptive field plasticity in L2/3 before or in the absence of plasticity in L4 (Glazewski and Fox, 1996; Stern et al., 2001), L4 to L2/3 synapses have long been hypothesized to be a site of experience-dependent plasticity in S1. Consistent with this hypothesis, whisker deprivation induces measurable synaptic depression at L4 to L2/3 synapses (Allen et al., 2003) and significantly alters the functional topography of the L4 to L2/3 projection (Shepherd et al., 2003); however, whether these effects are mediated in part by experience-dependent changes in L4 axonal morphology had not been tested before the present study.
Our data show that plucking a single row of whiskers from P8, the manipulation that induced maximal synaptic depression at L4 to L2/3 synapses (Allen et al., 2003), caused no differences in axonal length, topography, or bouton density compared with age-matched controls (Fig. 8). This suggests that deprivation-induced synaptic weakening at these ages is caused by physiological weakening of synapses (e.g., long-term synaptic depression) but not physical removal of axon.
Our data also show that depriving all contralateral whiskers from P9-14, the manipulation that drove robust receptive field plasticity in L2/3 and changes in functional connectivity of the L4 to L2/3 projection as assessed by photostimulation (Stern et al., 2001; Shepherd et al., 2003), also caused no differences in axonal length, topography, or bouton density compared with age-matched controls (Fig. 8). This indicates that functional plasticity on this projection is not caused by large-scale anatomical restructuring of L4 axons, as had been proposed originally (Stern et al., 2001); however, we cannot exclude changes in axonal ultrastructure below the resolution of light microscopy.
Possible mechanisms for axonal development
Because we did not follow single cells over time, the present results do not address the underlying mechanism for topographic refinement on the single-cell level. In other systems, refinement can involve apoptosis to remove mistargeted neurons from the population (Cellerino et al., 2000), pruning of mistargeted axonal branches without cell death (Innocenti, 1995), and targeted growth of axon in correct target areas (Callaway and Katz, 1990; Katz and Shatz, 1996; Yates et al., 2001; Rebsam et al., 2002). Because absolute length of mistargeted L4 axon did not decrease with development, apoptosis of mistargeted cells and pruning of inappropriate branches are unlikely to be major mechanisms for development of the L4 to L2/3 projection. Our data indicate that sensory experience is not required for topographic refinement. It will therefore be interesting to determine what molecular (Bolz et al., 1996; O'Leary and Wilkinson, 1999) or spontaneous activity cues (Crair, 1999) contribute to refinement of this projection.
Footnotes
This work was supported by the Klingenstein Foundation, the McKnight Endowment Fund for Neuroscience, and National Institute of Neurological Disorders and Stroke Grant 1 R01 NS046652. D.E.F. is an Alfred P. Sloan Research Fellow. We are grateful to Edward Callaway, Marla Feller, and the members of the Feldman lab for critically reading this manuscript, and to Tansu Celikel for MATLAB programming.
Correspondence should be addressed to Dr. Daniel Feldman, Neurobiology Section 0357, Division of Biological Sciences, University of California, San Diego, 9500 Gilman Drive, La Jolla, CA 92093-0357. E-mail: dfeldman{at}biomail.ucsd.edu.
Copyright © 2003 Society for Neuroscience 0270-6474/03/238759-12$15.00/0


